|
Contents Of This Report: |

|
Please note that the values presented in this report are based on preliminary data. They will change when the final data are processed, but will not be replaced on these pages.
National Drought Overview
|
|
[top]
Detailed Drought Discussion
Overview

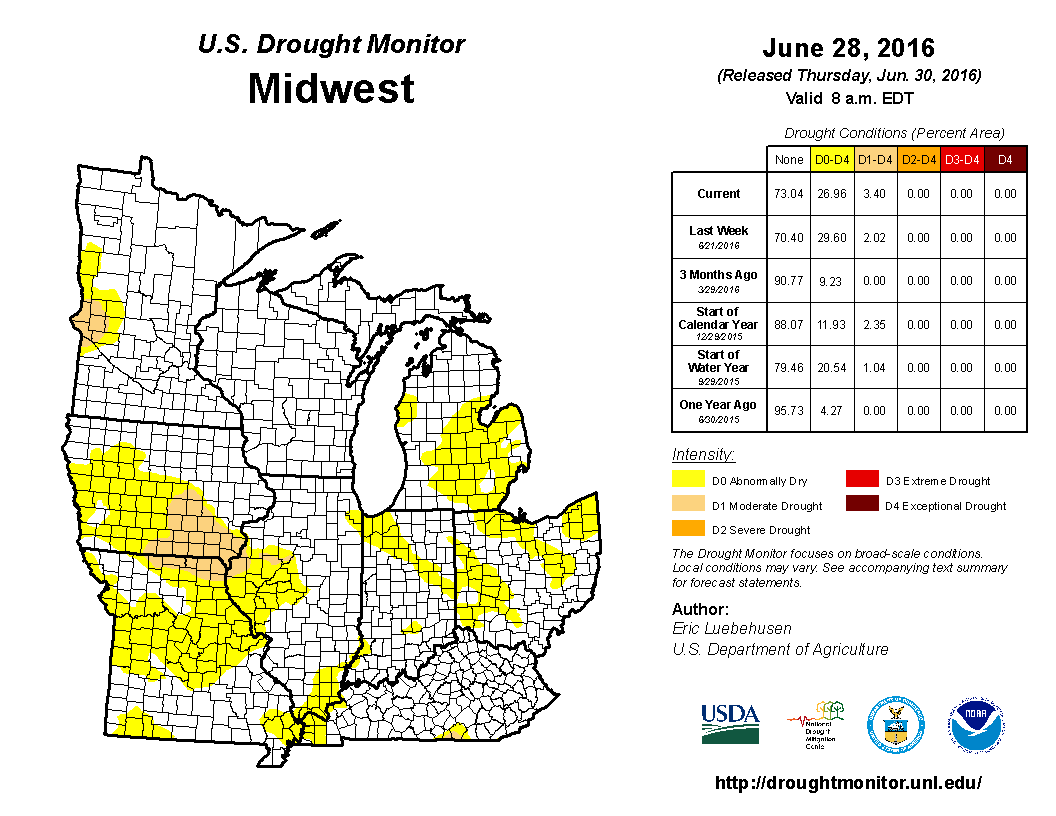
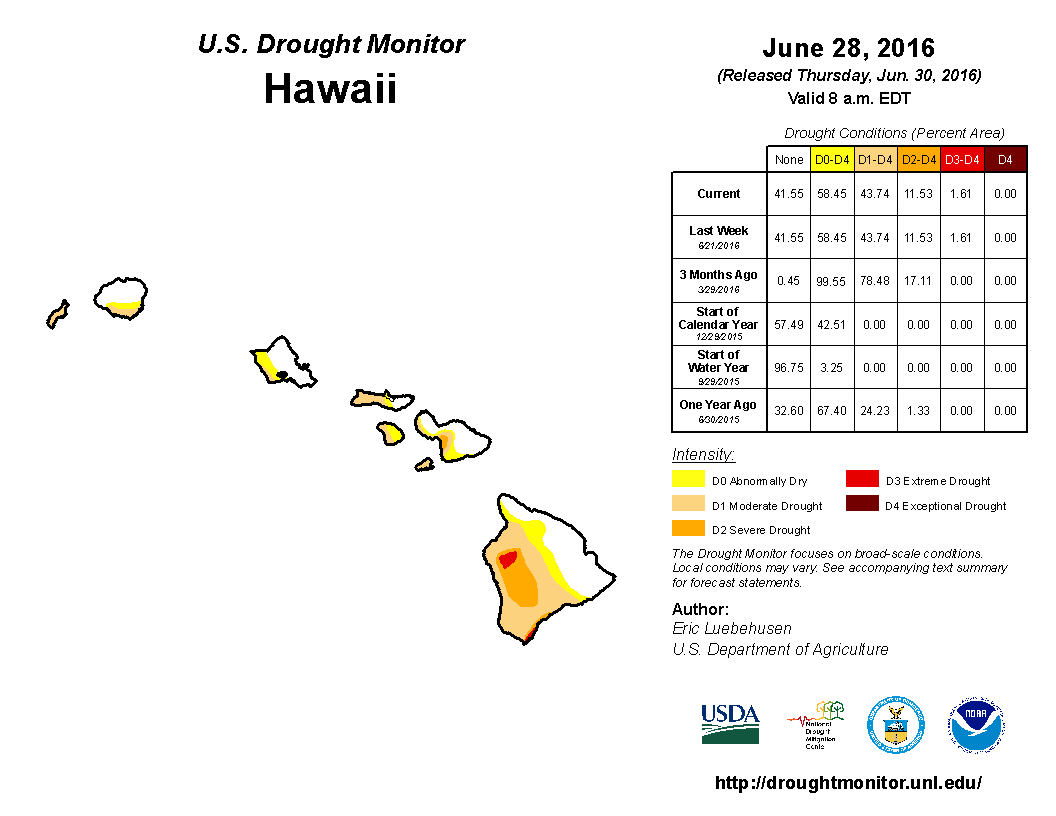
The U.S. Drought Monitor drought map valid June 28, 2016.
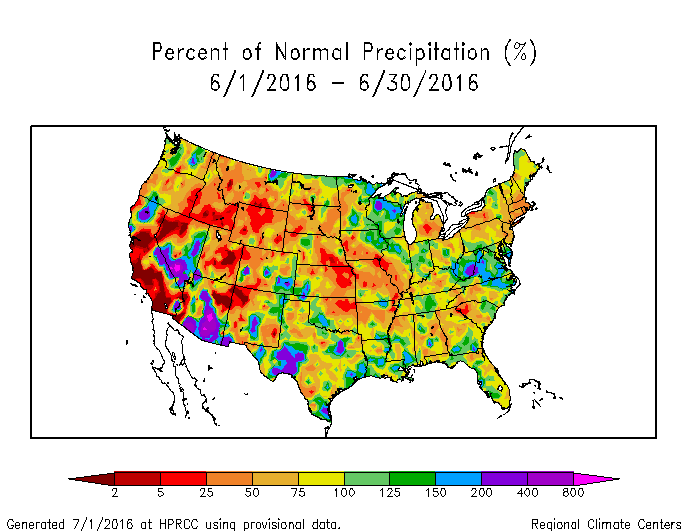
During June 2016, the Earth's atmosphere-ocean system was in a state of transition — from El Niño to La Niña, and from spring to summer. The Aleutian Low weakened considerably, reducing the amount of energy it propagates through the upper-level circulation to North America. Consequently, a longwave ridge largely dominated most of the CONUS. Weather systems moved in the jet stream flow along the top of the ridge, mainly keeping the storm track along the U.S.-Canadian border. The ridge kept much of the CONUS abnormally warm and dry. An upper-level trough, with its dry northwesterly flow, dominated the Northeast, keeping temperatures moderate but giving the region a drier-than-normal month. Areas of above-normal precipitation occurred with storm systems moving along the storm track and with monsoon showers that developed in the Southwest. But with dry weather dominating the country, drought and abnormal dryness expanded in the Northwest, Northern to Central Plains, Southeast, and Northeast. June was wetter than normal across much of Hawaii, contracting drought. A mixed precipitation anomaly pattern occurred in Alaska, where abnormal dryness expanded, and in Puerto Rico. With El Niño having ended, above-normal precipitation began returning to parts of the U.S.-Affiliated Pacific Islands. When integrated across the CONUS, June 2016 ranked as the 14th driest June in the 1895-2016 record. Drought expanded more than it shrank, with the national drought footprint increasing to 13.6 percent of the U.S. (16.2 percent of the CONUS). According to the Palmer Drought Index, which goes back to the beginning of the 20th century, about 15.4 percent of the CONUS was in moderate to extreme drought at the end of June, an increase of about 6 percent compared to last month.
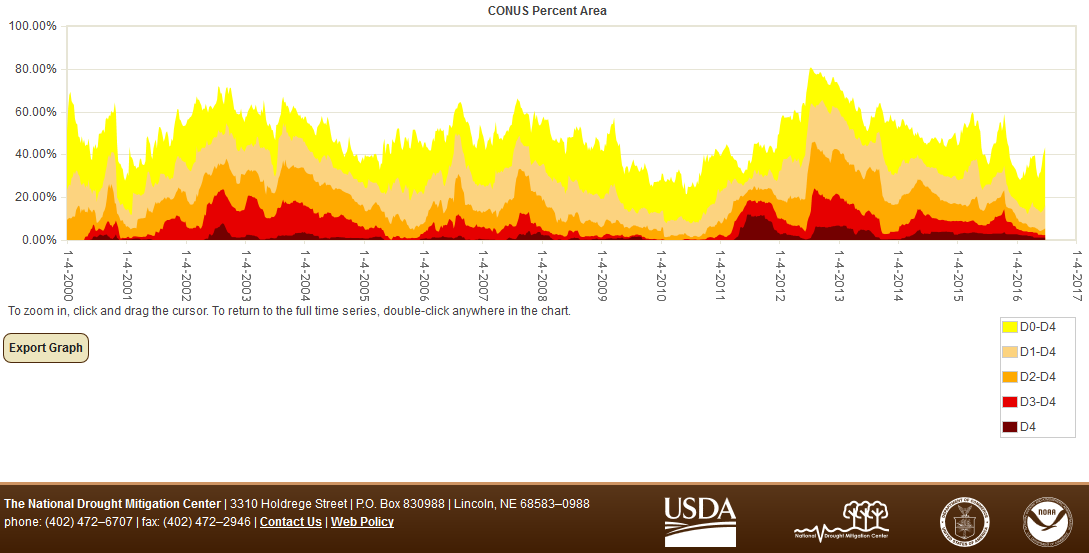
Percent area of the CONUS in moderate to exceptional drought, January 4, 2000 to present, based on the U.S. Drought Monitor.
Palmer Drought Index
The Palmer drought indices measure the balance between moisture demand (evapotranspiration driven by temperature) and moisture supply (precipitation). The Palmer Z Index depicts moisture conditions for the current month, while the Palmer Hydrological Drought Index (PHDI) and Palmer Drought Severity Index (PDSI) depict the current month's cumulative moisture conditions integrated over the last several months. While both the PDSI and PHDI indices show long-term moisture conditions, the PDSI depicts meteorological drought while the PHDI depicts hydrological drought. The PDSI map shows less severe and extensive drought in parts of the West than the PHDI map because the meteorological conditions that produce drought and wet spell conditions are not as long-lasting as the hydrological impacts.
|
 |
Used together, the Palmer Z Index and PHDI maps show that short-term dry conditions occurred from the Northern Rockies to the Mid-Mississippi Valley and across parts of the Southwest, Southeast, Great Lakes, and Northeast. This short-term dryness expanded or initiated long-term dry conditions in June compared to May in the Northwest to Northern Plains, Southwest, Northeast, and Southeast. It reduced long-term wet conditions in the Central Plains. Short-term wet conditions expanded or intensified long-term wet conditions in parts of the Southern Plains, Central Appalachians, and Mid-Atlantic coast.
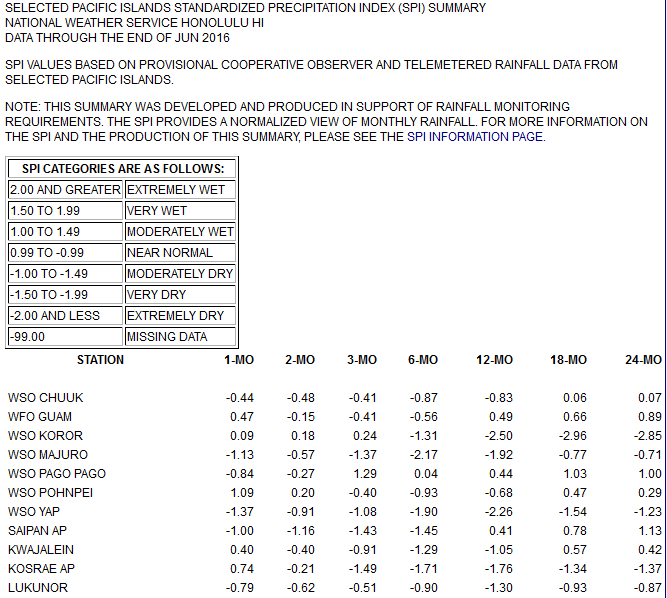
Standardized Precipitation Index
The Standardized Precipitation Index (SPI) measures moisture supply. The SPI maps here show the spatial extent of anomalously wet and dry areas at time scales ranging from 1 month to 24 months.
 |
 |
 |

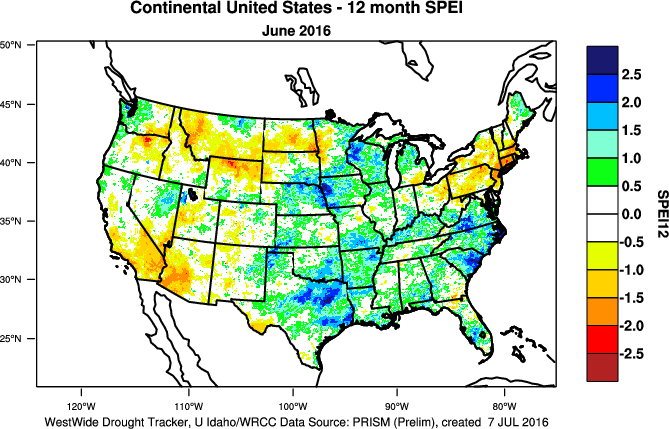
The SPI maps illustrate how moisture conditions have varied considerably through time and space over the last two years. Dryness dominates the Northern Rockies to Northern Plains at the 1- to 2-month time scales (May-June) and is evident in parts of this region at the longer time scales. The coastal Northwest is dry at the 2- to 3-month time scales. The interior Southeast is dry at the 1- to 6-month time scales. Much of the Northeast is dry at the 1- to 6-month time scales, with parts dry at the longer time scales. The Central Plains is dry at the 1-month time scale (June), while the adjacent Mid-Mississippi Valley shows dry conditions at the 1- to 6-month time scales. The dryness in California does not show up well at these spatial and temporal scales, but there is an indication of dry conditions in southern California at the 9- to 24-month time scales. In the Southern Plains, parts of Oklahoma are dry at the 1- to 2-month time scales, but Texas shows up as near normal to wet at all time scales. Wet conditions dominate large parts of the country at the 9- to 24-month time scales.
 |
 |
 |
Standardized Precipitation Evapotranspiration Index
The SPI measures water supply (precipitation), while the SPEI (Standardized Precipitation Evapotranspiration Index) measures the combination of water supply (precipitation) and water demand (evapotranspiration as computed from temperature). Warmer temperatures tend to increase evapotranspiration, which generally makes droughts more intense.
 1-month SPEI for current month.
|
 1-month SPI for current month.
|
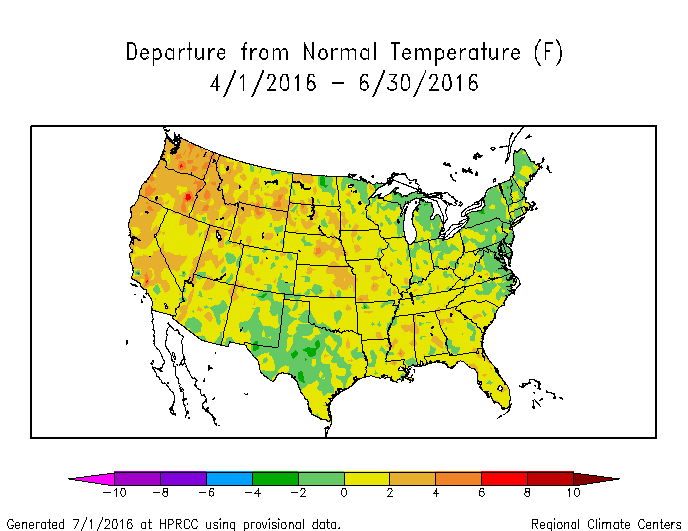
Temperatures were much warmer than normal across most of the West and Central Plains to Southeast during June. Precipitation from monsoon showers resulted in the 1-month SPI map showing normal to wet conditions in the Southwest reflecting the adequate monthly water supply. But when the much greater water demand (due to the hot temperatures) is incorporated, the 1-month SPEI map showed drought conditions there. Temperature anomalies for the last three months were not as extreme as June's so the April-June 2016 SPEI and SPI maps showed similar conditions, although the SPEI showed dry conditions just a little worse in the Pacific Northwest even at this time scale. Warmer temperature anomalies for the year to date from the Great Plains to parts of the West contributed to more severe drought in parts of the West on the 6-month SPEI map compared to the SPI map. Widespread warm temperature anomalies for the last 12 months resulted in more severe drought in the areas with below-normal precipitation on the July 2015-June 2016 SPEI map compared to the SPI map.

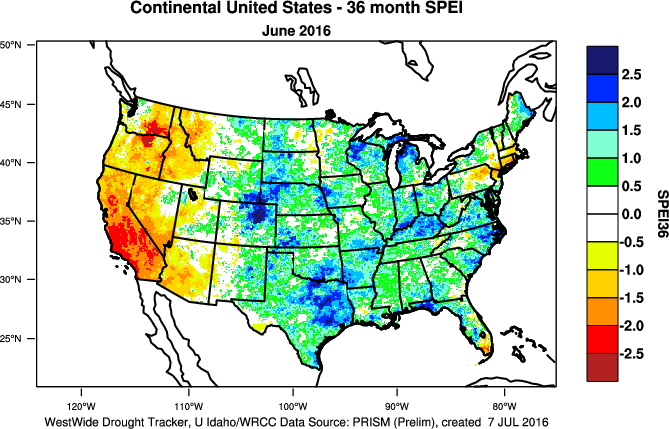
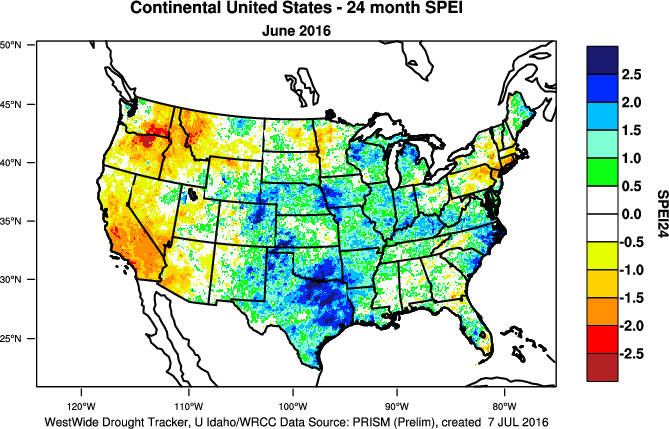
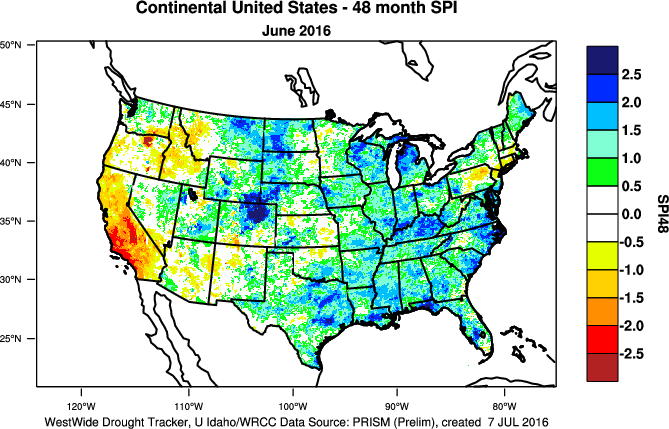
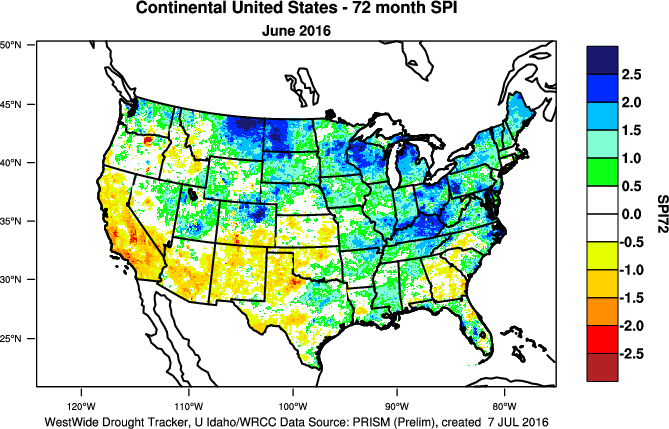
Significant differences between the SPEI and SPI maps begin to appear in the West at the 24-month time frame (SPEI vs. SPI) and become increasingly significant at the 36-month (SPEI vs. SPI), 48-month (SPEI vs. SPI), 60-month (SPEI vs. SPI), and even 72-month (SPEI vs. SPI) time scales. This is due to persistent above-normal temperatures in the West for the last several years which have increased evapotranspiration and exacerbated drought conditions.
 |
 |
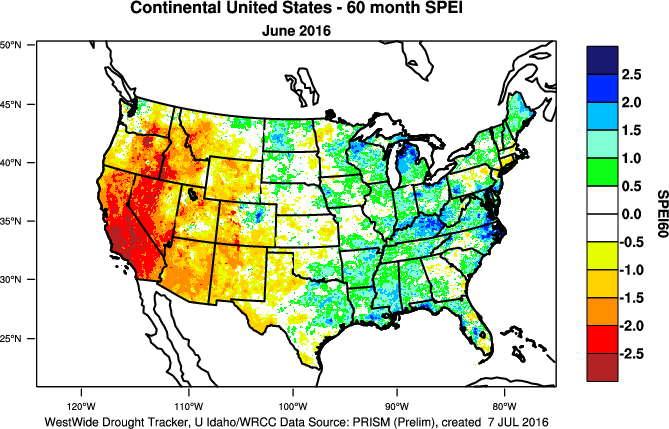 |
This is especially the case in California, where the last three July-June 12-month periods ranked as the three warmest such periods for the state in the 1895-2016 record. The last three years cap a period of persistent unusual warmth which has lasted over three decades. The precipitation for the last 12 months gave California a statewide precipitation rank of 46th wettest (76th driest) for July 2015-June 2016. But the persistent dryness over the last nine years still gave the state the driest SPI for the last 60 months and a top-ten dry SPI for the last 48 months and 72 months. When the temperature is factored in, California has had the most severe SPEI for the last 60 and 72 months, second most severe SPEI for the last 48 months, and third most severe SPEI for the last 36 months. Nearby Nevada has had the second most severe SPEI for the last 60 months.
 California statewide temperature, July-June, 1895-2016.
|
 California statewide 60-month SPEI for June, 1895-2016.
|
Regional Discussion
 Monthly streamflow
|
 USDA topsoil moisture short to very short
|
CONUS Agricultural & Hydrological Impacts:
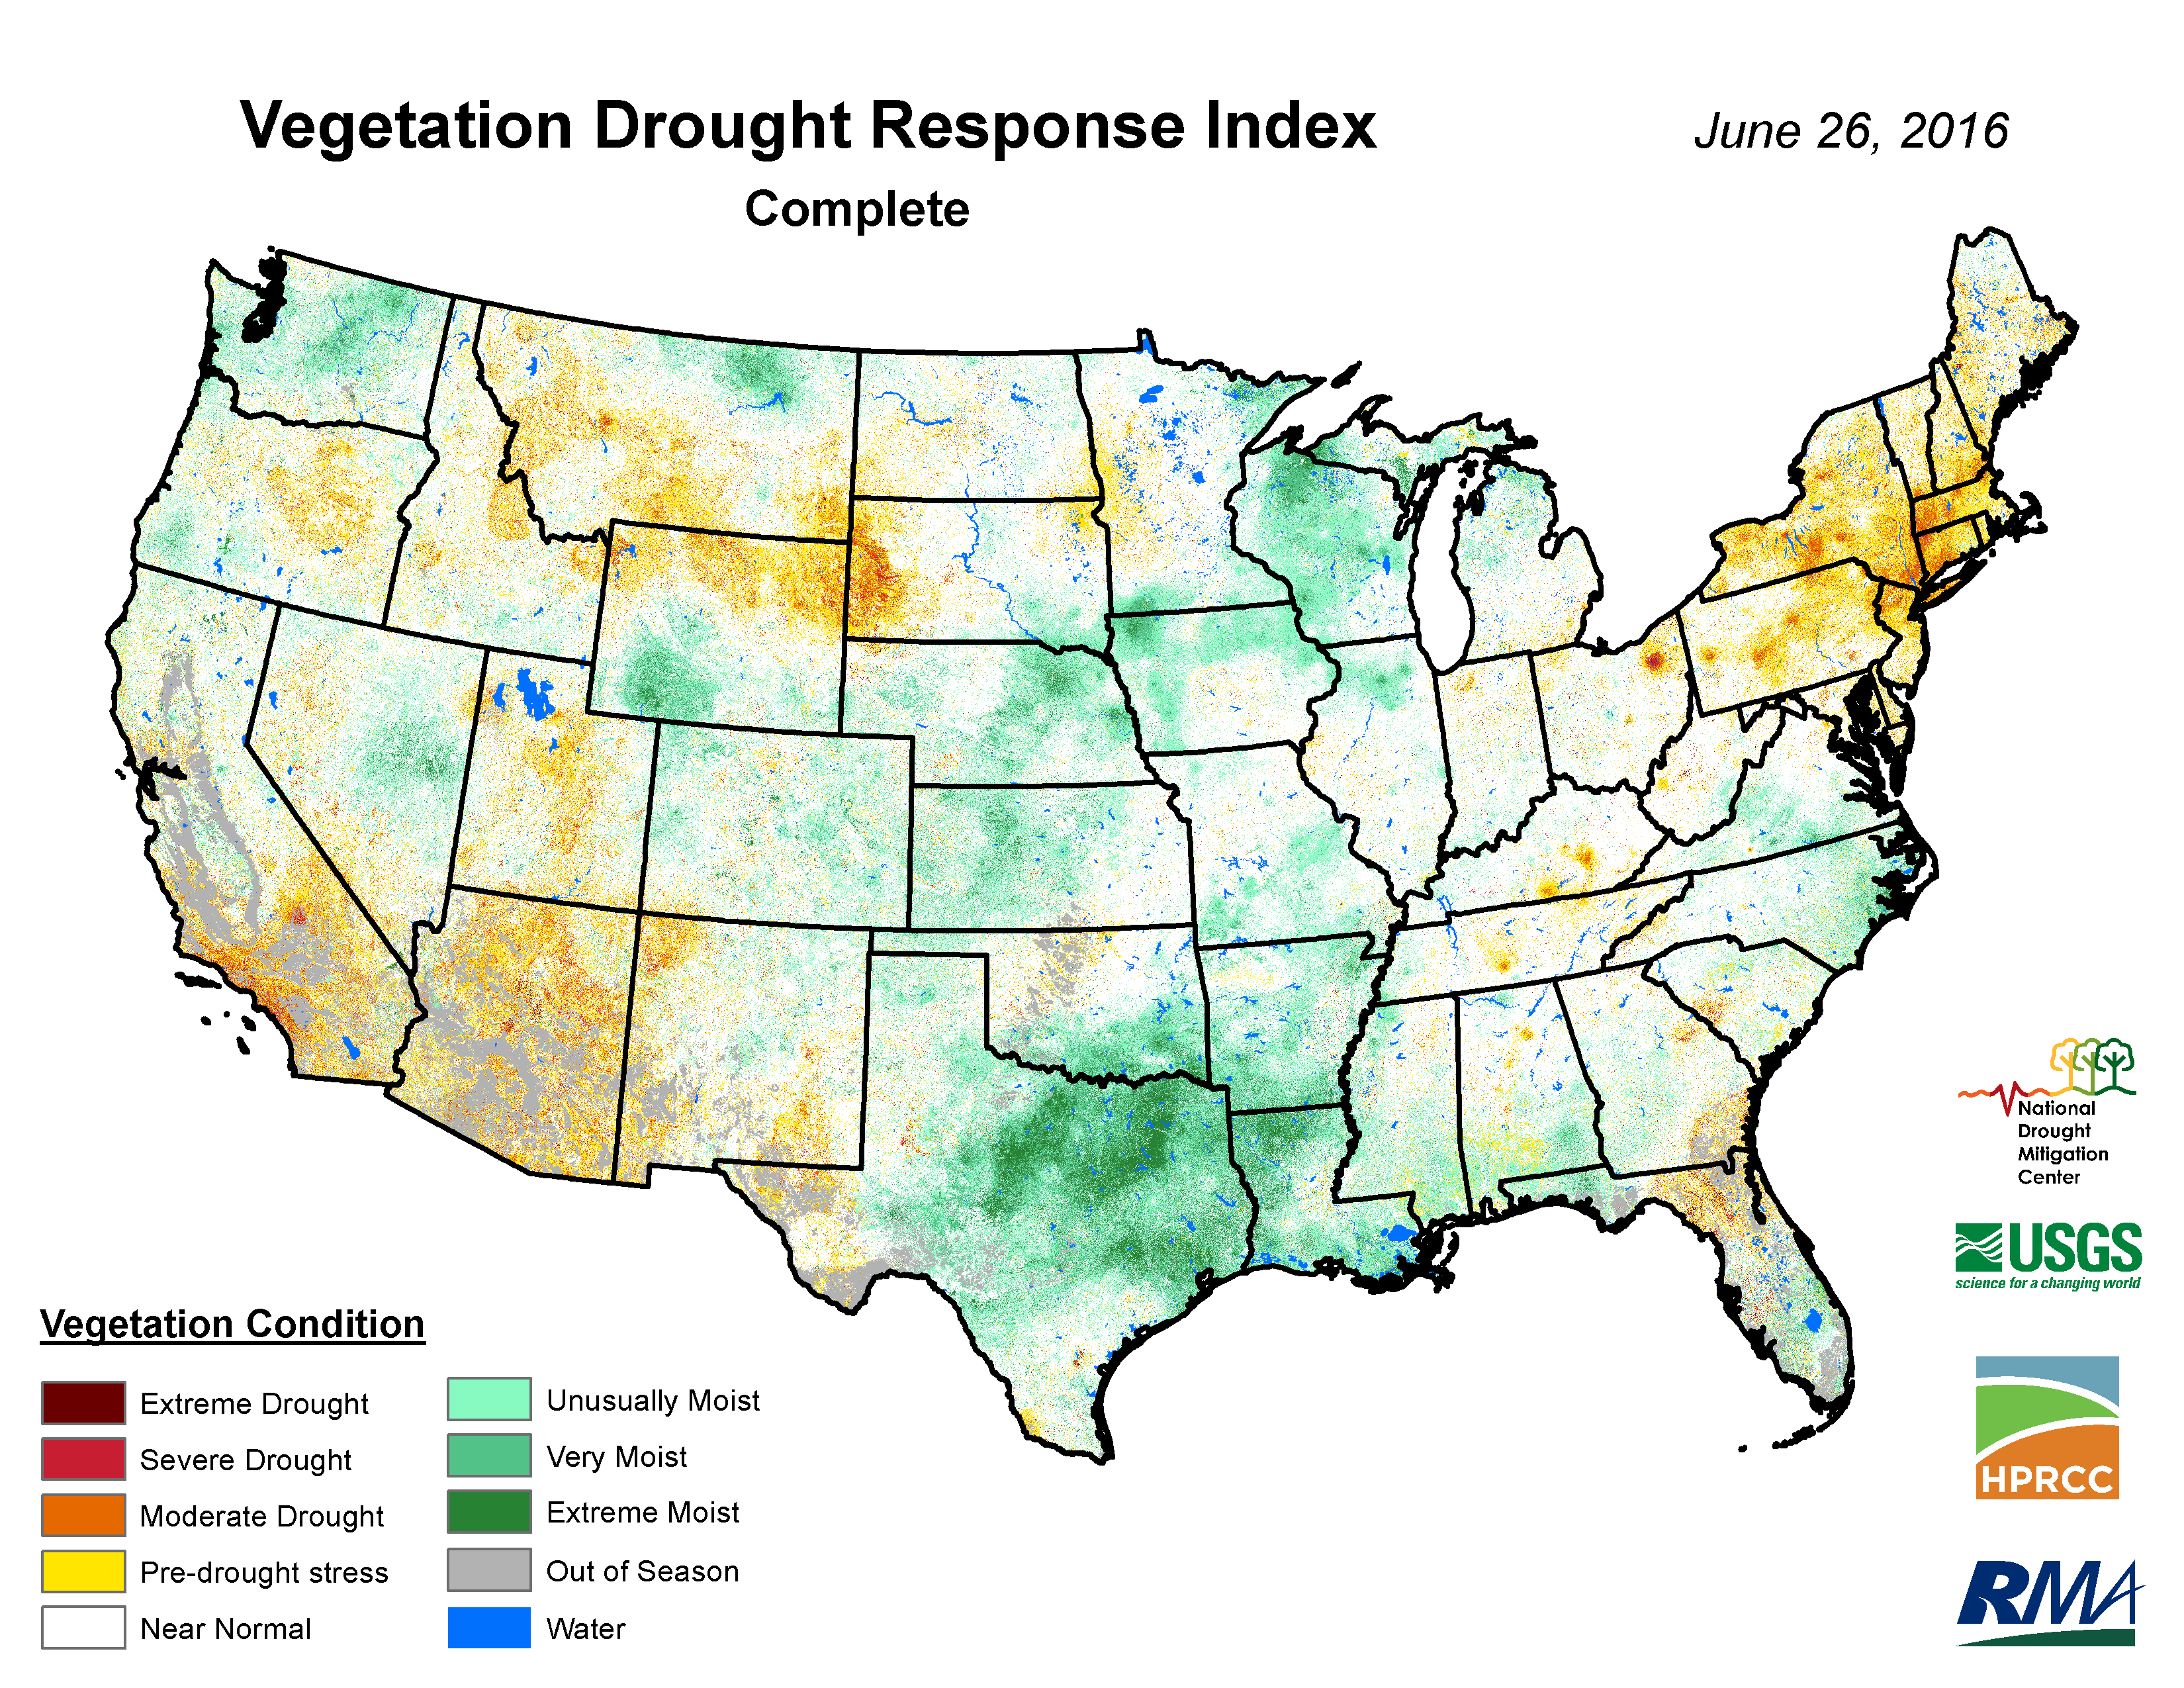
The dry and hot weather of June increased short-term drought conditions and, for some areas, exacerbated long-term drought. This is reflected in numerous agricultural, hydrological, and other meteorological indicators, both observed and modeled. The dry weather, with increased evapotranspiration, dried soils and stressed vegetation. Where the dry conditions have been continuing for several months, hydrological conditions such as streamflow and groundwater supplies were reduced.
On a national scale, as of June 28th, 13 percent of the nation's cattle inventory, 12 percent of the nation's hay, 7 percent of winter wheat production, 5 percent of corn, and 5 percent of soybean production were in drought. These percentages are all more than the values for the end of May.
According to June 26th U.S. Department of Agriculture (USDA) reports, only 9 percent of the winter wheat and 10 percent of the nation's pasture and rangeland were rated in poor to very poor condition. These are slight increases compared to last month, but are still low. However, 31 percent of the nation's topsoil moisture and 26 percent of the subsoil moisture were rated short to very short (dry to very dry). These are roughly twice the values from last month.
On a regional basis, conditions were more extreme.
Drought conditions at the end of the month, as depicted on the June 28th USDM map, included the following CONUS core drought and abnormally dry areas:
- Moderate (D1) drought covered a large part of the western U.S., with to severe (D2) to exceptional (D4) drought extending from California into Nevada and occurring in parts of southern Arizona and northeastern Wyoming. —
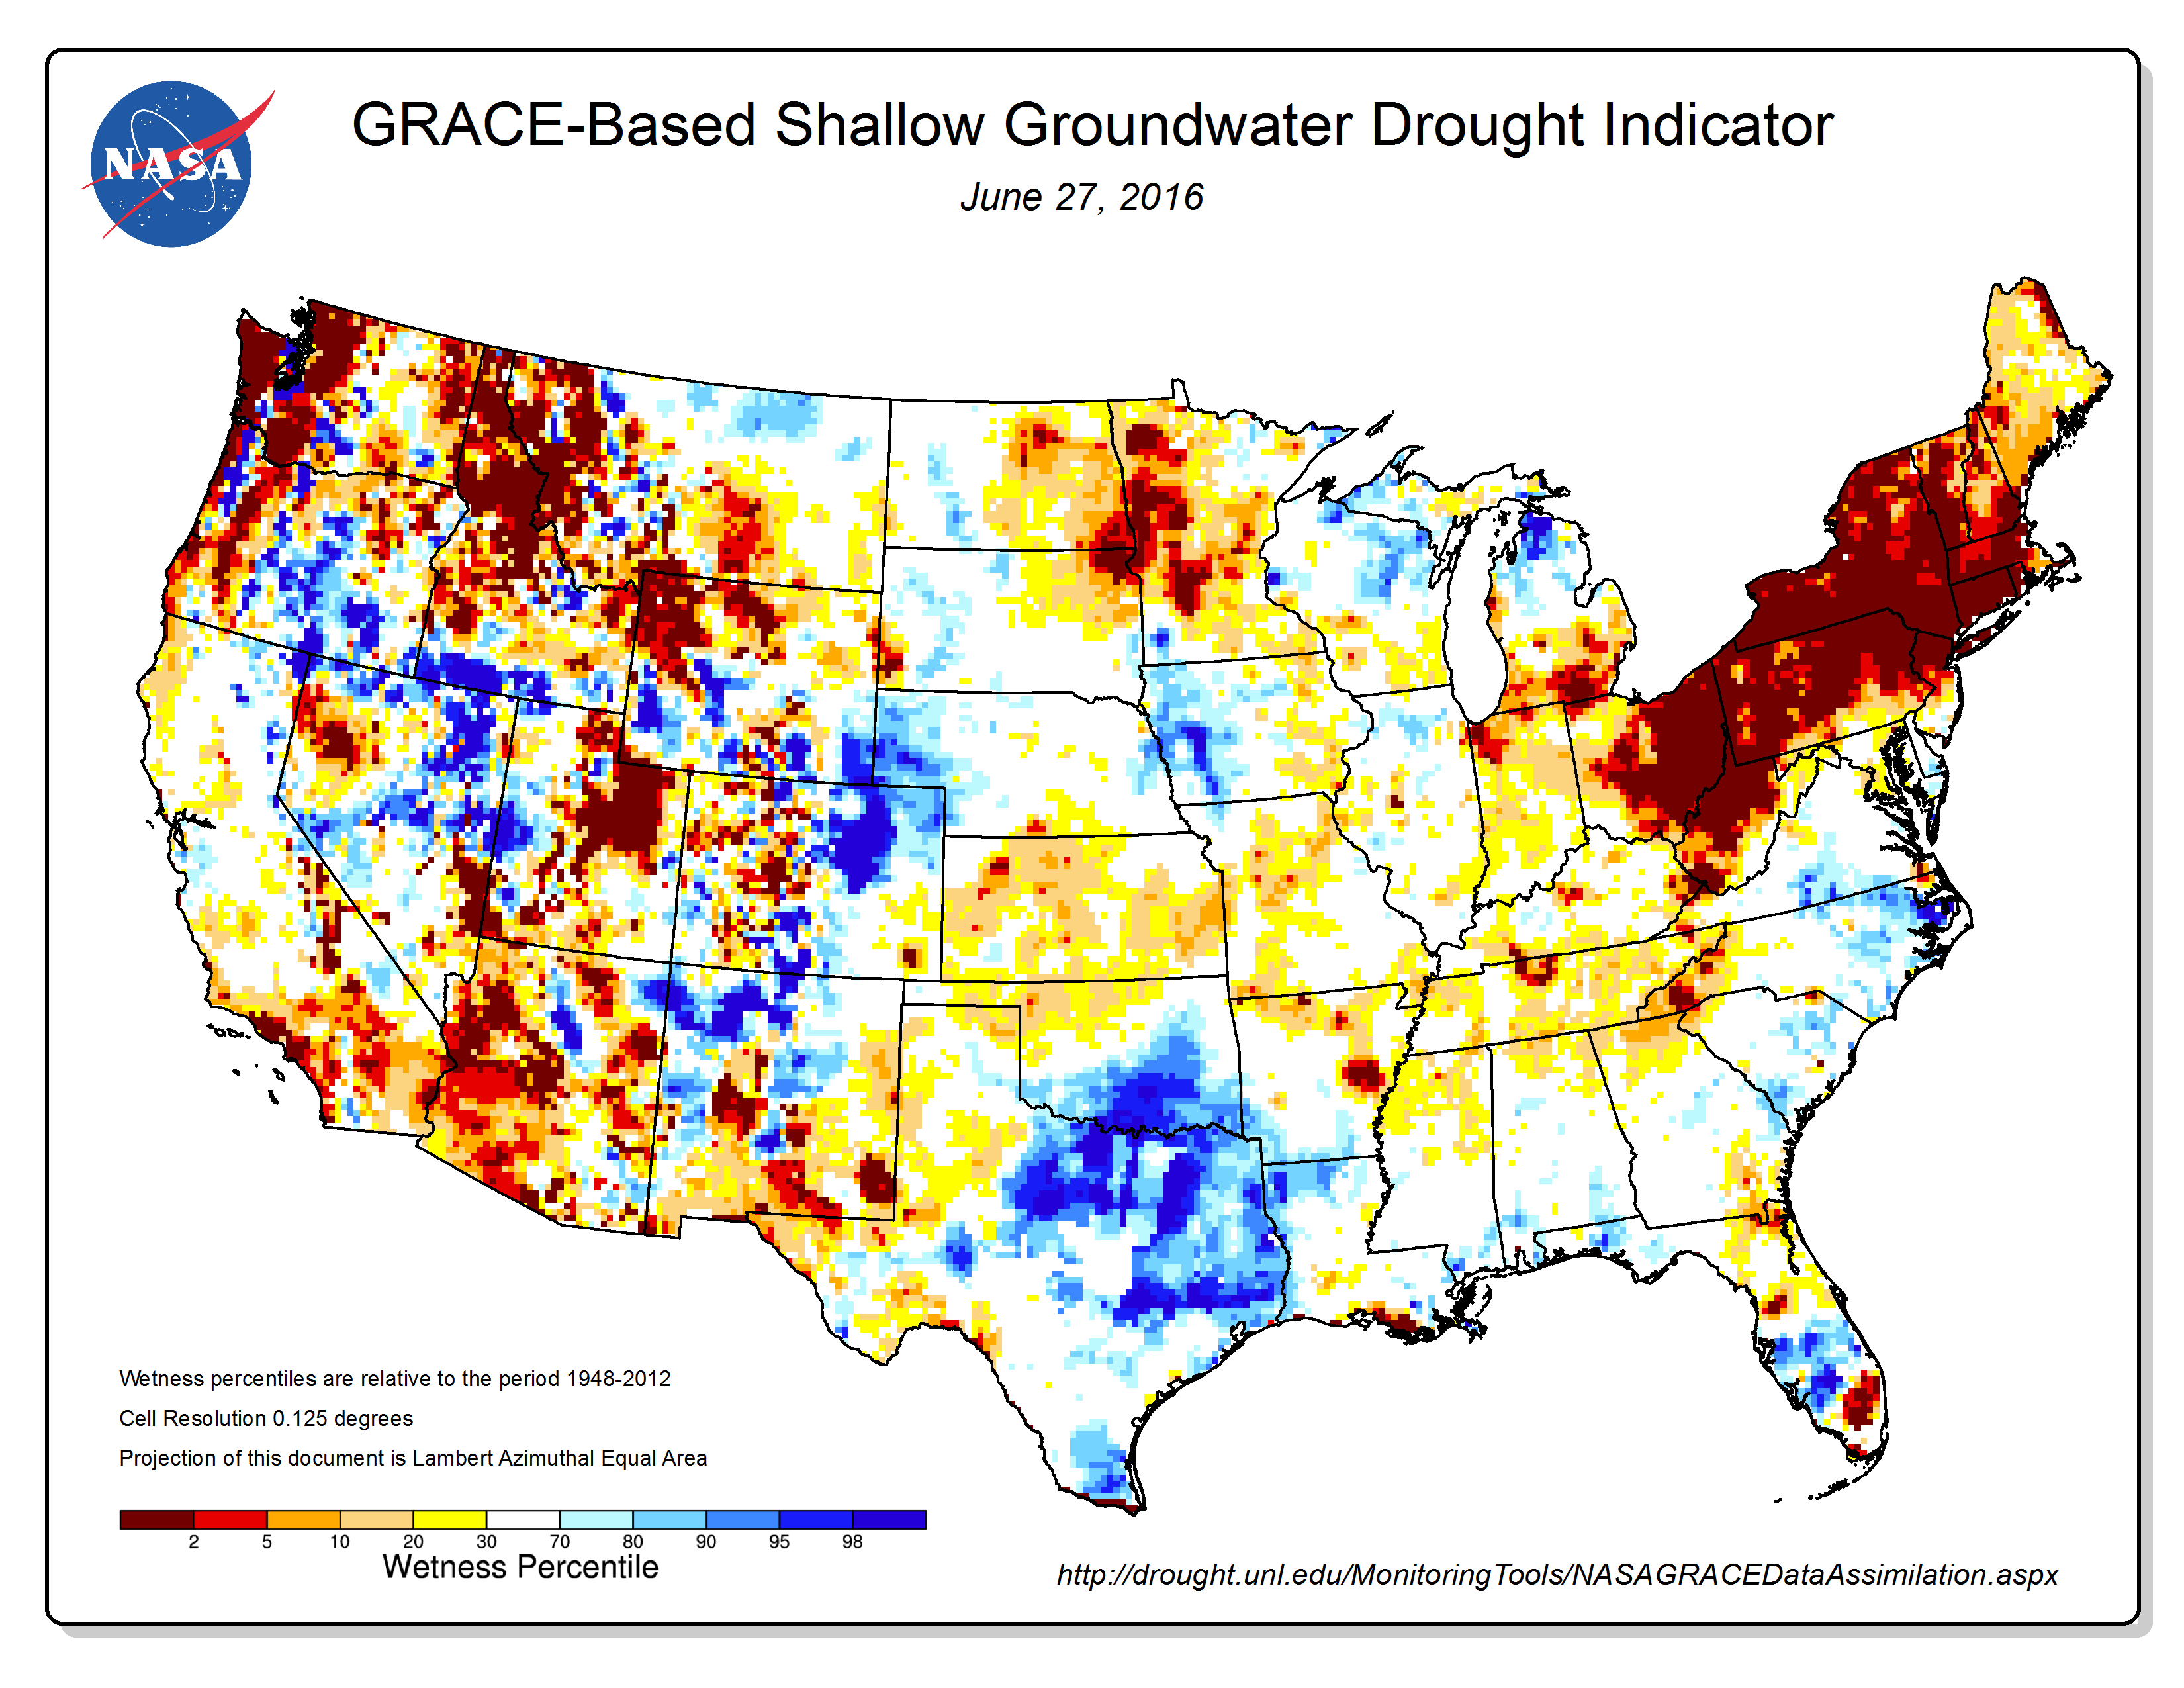
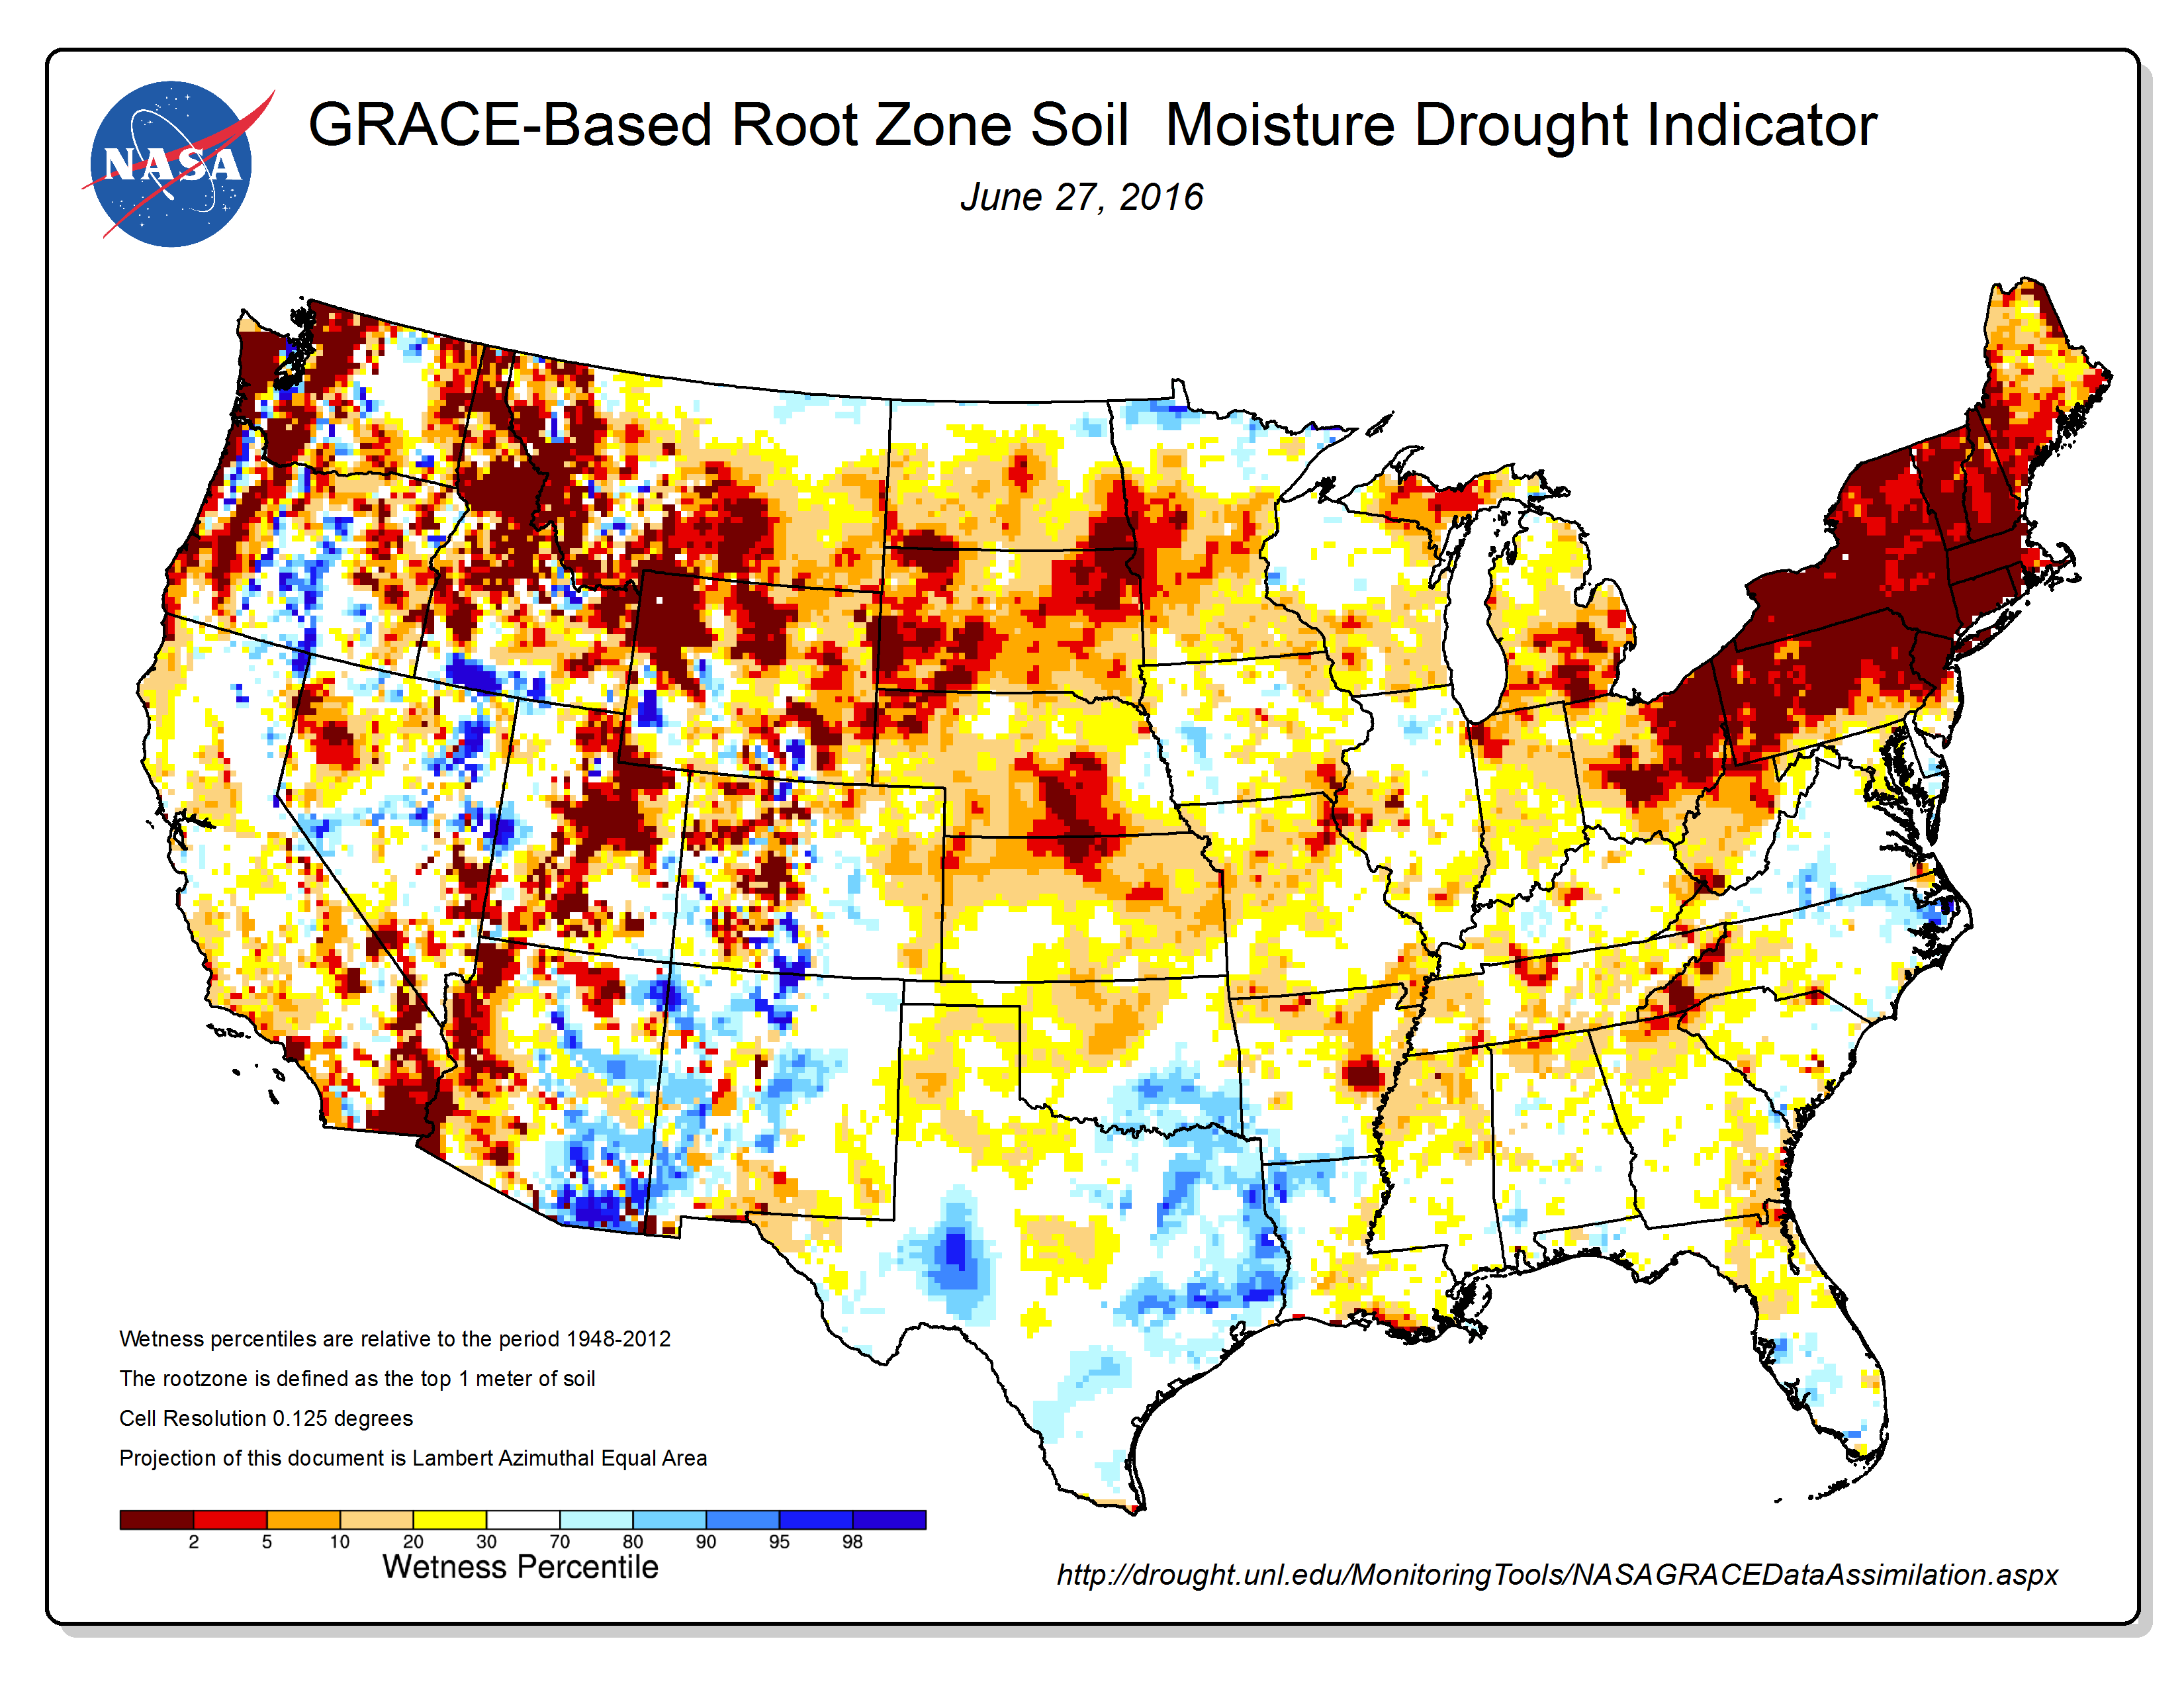
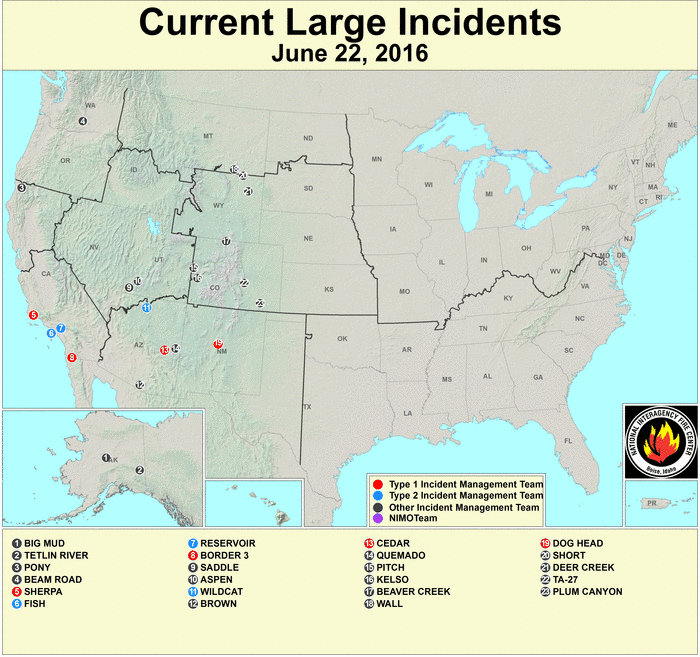
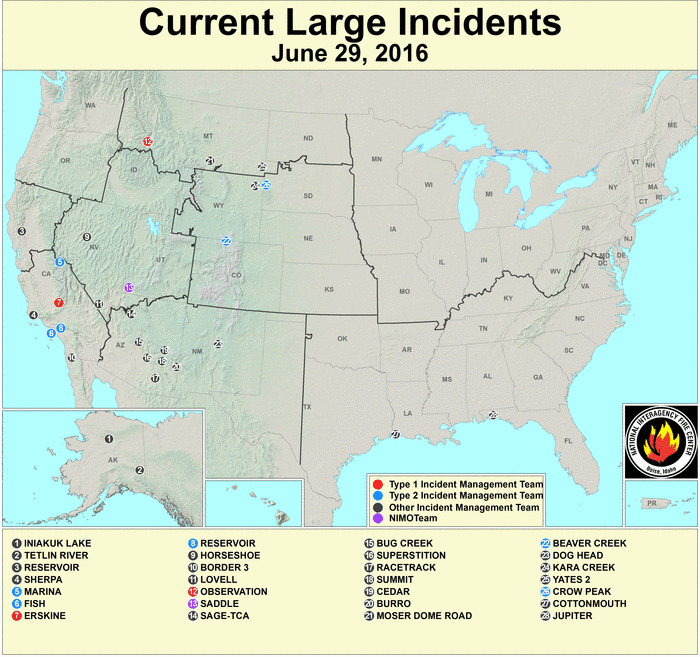
- This is the dry season for the West coast and Pacific Northwest. Slow melting of mountain snowpack built up during the winter usually provides an important water source during the spring and summer months. Due to the anomalously warm temperatures of June and earlier months, the mountain snowpack is essentially melted out in the western CONUS. Mountain snowmelt, as well as groundwater, feeds streams. Satellite-based estimates of groundwater indicated dry conditions in parts of the West. USGS observations revealed low streamflow levels across parts of the Northwest. The unusually warmer-than-normal temperatures increased evaporative stress in the Pacific Northwest (based on the Evaporative Drought Demand Index (EDDI) and Evaporative Stress Index (ESI)). June 26th USDA reports indicated that 35% of the pasture and rangeland was rated in poor to very poor condition in California. According to models, soil moisture was dry in parts of the West (CPC, CPC percentiles, VIC percentiles). Satellite-based estimates of root-zone soil moisture indicated very dry conditions in parts of the Northwest. Drying of the soils was evident in the Palmer Crop Moisture Index (CMI) which worsened in the Northern Rockies throughout the month (CMI for week 1, 2, 3, 4, 5). June 26th USDA reports indicated 40 percent or more of the topsoil moisture was rated short or very short (dry or very dry) in New Mexico (72%), California (70%), and Nevada (50%) and 40 percent or more of the subsoil moisture was rated short or very short in California (75%), Nevada (50%), New Mexico (50%), and Oregon (43%). Wildfires expanded across the West during the last half of June. While reservoirs in northern California have recovered to near-average levels, reservoirs in most central and southern California areas continued below average. Statewide, reservoirs were below average in Arizona, Nevada, New Mexico, Oregon, and Washington; near to slightly above average in Colorado, Idaho, Montana, and Utah; and above average in Wyoming.
- Abnormally dry to moderate drought conditions returned to the Southern Plains; moderate to extreme drought expanded in parts of the Northern Plains. —
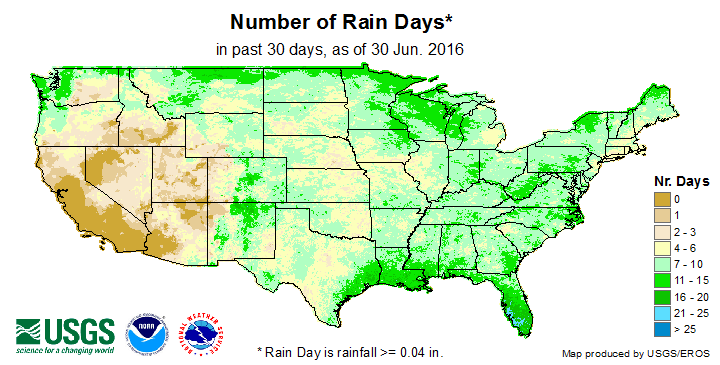
- According to the USGS, there were few days with rain and long runs of consecutive dry days in parts of the Great Plains. The unusually warmer-than-normal temperatures increased evaporative stress (based on the EDDI and ESI). According to models (CPC, CPC percentiles, VIC percentiles, NLDAS top layer, NLDAS total column), soil moisture was dry in some areas. Satellite-based estimates of root-zone soil moisture indicated very dry conditions across much of the Plains. Drying of the soils was evident in the CMI which worsened in the Northern High Plains throughout the month (CMI for week 1, 2, 3, 4, 5). June 26th USDA reports rated 51 percent of the topsoil moisture short or very short in Missouri. Satellite-based observations of vegetative health indicated stressed vegetation in parts of the Plains. Satellite-based estimates of groundwater indicated dry conditions in some areas.
- Abnormal dryness and drought expanded in parts of the Midwest and Northeast. —
- The persistent below-normal precipitation resulted in low streamflow and groundwater levels, especially in the Northeast. Evaporative stress increased in the Midwest and especially in the Northeast (based on the EDDI and ESI). Satellite-based estimates of root-zone soil moisture, and other models (CPC anomalies, CPC percentiles, VIC percentiles, NLDAS top layer, NLDAS total column), indicated dry soil moisture conditions. According to June 26th USDA reports, 40 percent or more of the topsoil moisture was rated short or very short (dry or very dry) in New Hampshire (81%), Vermont (75%), Connecticut (69%), Maine (66%), Massachusetts (65%), Michigan (60%), Rhode Island (55%), and New York (48%), and 40 percent or more of the subsoil moisture was rated short or very short in Vermont (72%), New Hampshire (57%), Connecticut (57%), Maine (52%), Rhode Island (50%), Massachusetts (49%), Michigan (48%), and New York (42%). A week later, these values were even higher for some states. Satellite-based observations of vegetative health indicated stressed vegetation in some areas, and June 26th USDA reports revealed 55% of the pasture and rangeland was rated in poor to very poor condition in Vermont. This value had increased to 62% a week later. As noted by the National Drought Mitigation Center (NDMC), drought advisories or water restrictions had been declared by the end of June in New Hampshire, Connecticut, and Massachusetts.
- Abnormal dryness and drought expanded and intensified in parts of the Southeast, including Tennessee and the Lower Mississippi Valley, with pockets of extreme drought developing. —
- The unusually warmer-than-normal temperatures increased evaporative stress (based on the EDDI and ESI) and contributed to the continued drying of soils, based on models (CPC, CPC percentiles, VIC percentiles, NLDAS top layer, NLDAS total column) and satellite-based estimates of root-zone soil moisture. Drying of the soils was evident in the CMI which worsened throughout the month (CMI for week 1, 2, 3, 4, 5). According to USDA reports, as of June 26th, 40 percent or more of the topsoil moisture was rated short or very short in Arkansas (59%), Mississippi (58%), Georgia (55%), Alabama (54%), and Tennessee (42%), and 40 percent or more of the subsoil moisture was rated short or very short in Mississippi (50%), Alabama (48%), Georgia (46%), Arkansas (43%), and Tennessee (40%). The June 26th USDA reports noted that 34% of the winter wheat was rated in poor to very poor condition in North Carolina, although much of it has been harvested by now. Streamflow levels were low and satellite-based estimates of groundwater indicated dry conditions in parts of the Southeast.
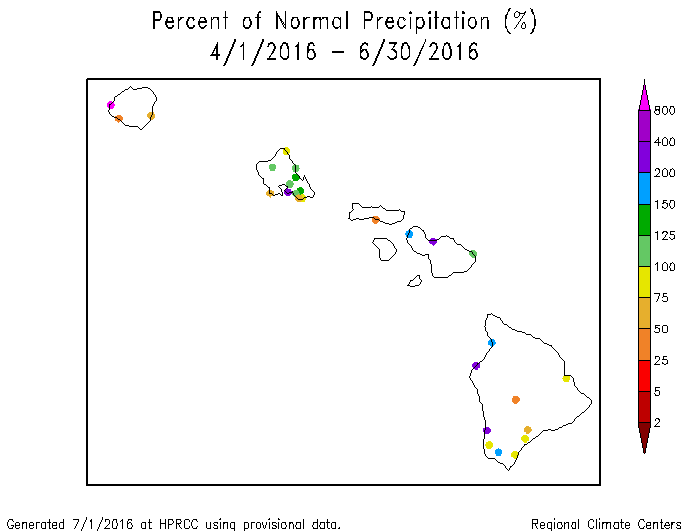
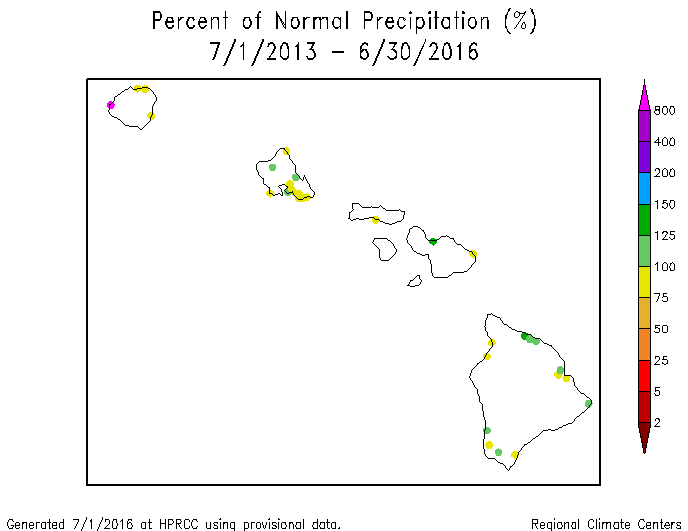
Hawaii: June 2016 was wetter than normal across much of Hawaii. The last 2 months were wet, but increasing dryness was evident in some areas at longer time scales (last 3, 6, and 9 months). A mixed precipitation anomaly pattern is evident at the one to three year time scales (last 12, 24, and 36 months). Moderate to extreme drought contracted to cover about 44 percent of the state according to the June 28th USDM map.

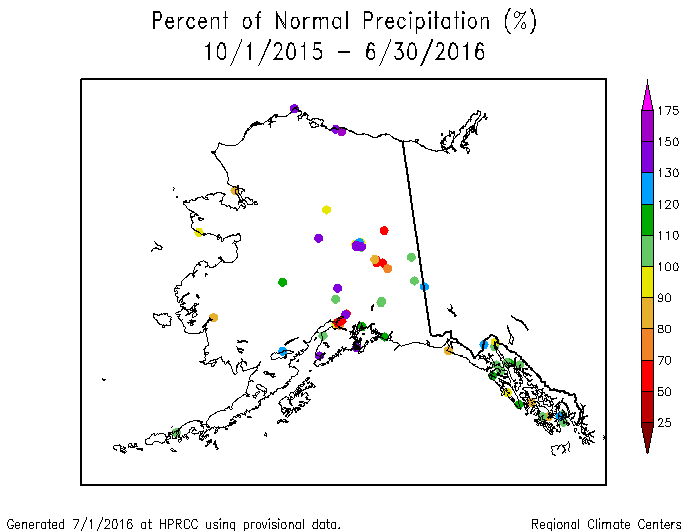
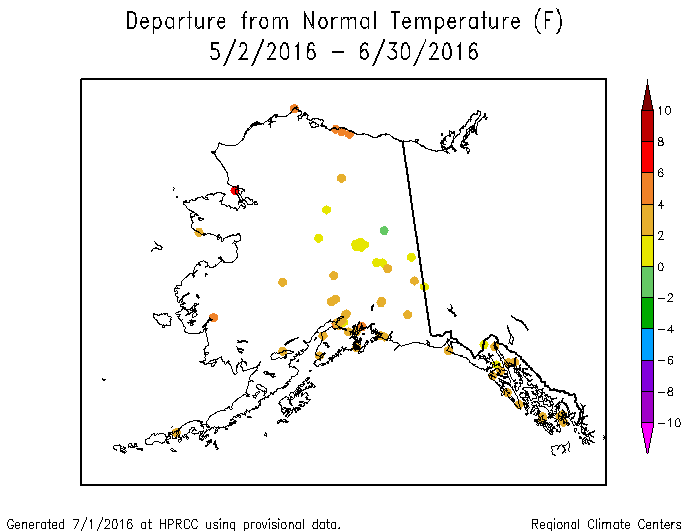
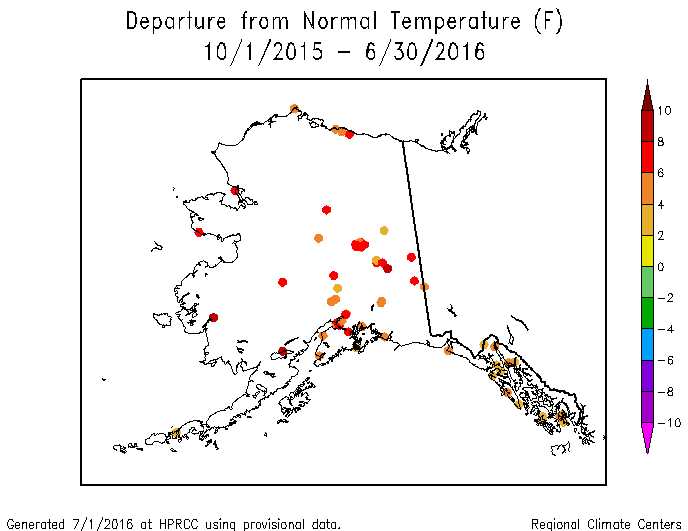
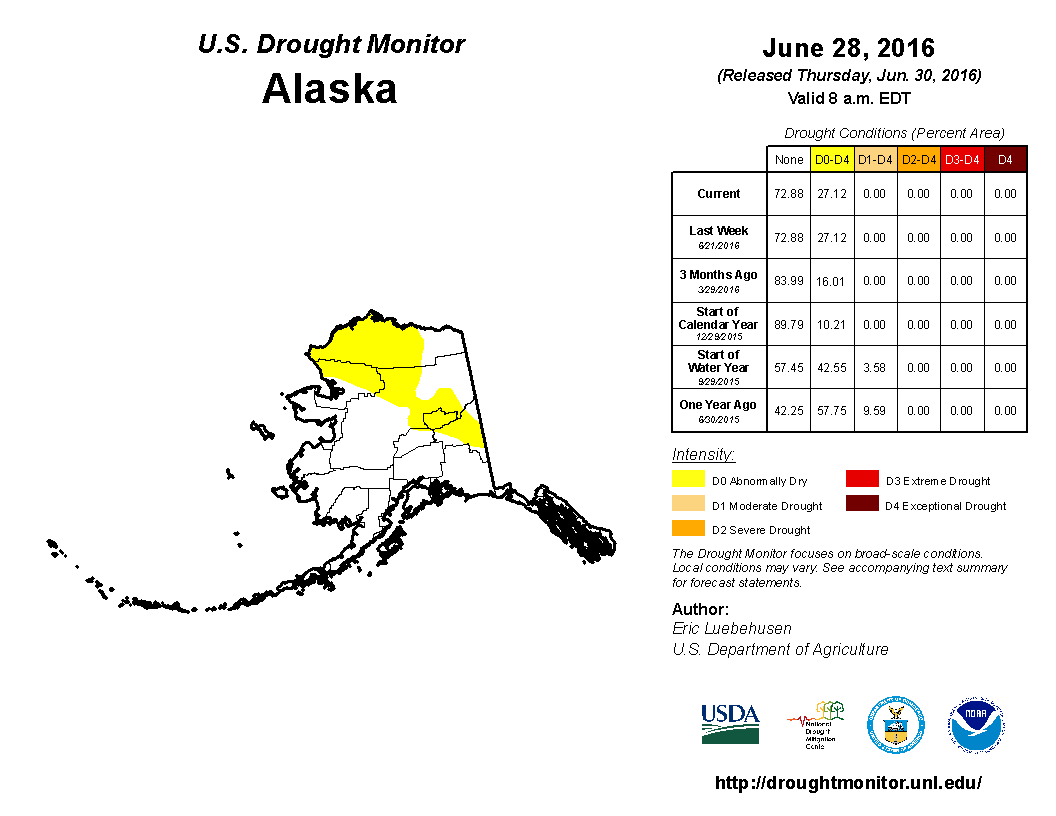
Alaska: A mixed precipitation pattern was evident across Alaska during June when examining low elevation station data, but when aggregated into climate divisions a wet pattern emerged. The high elevation (SNOTEL) stations were also mostly wetter than normal. The pattern was mostly wetter than normal for the last two to three months (station map, divisional map). But for the year-to-date (station map, divisional map), a dry pattern dominates. The pattern becomes mixed again with wet conditions dominating at longer time scales (climate division map for July-June; SNOTEL station map for October-June; SNOTEL river basin map for October-June; station maps for the last 9, 12, 24, and 36 months). Some interior stations were cooler than normal during June, but warmer-than-normal temperatures have essentially dominated for the last 12 months on both the climate division (last 1, 3, 6, 12 months) and station (last 1, 2, 3, 6, 9, 12 months) analyses. Temperatures were record warm on the climate division maps at the longer time scales. The persistent warmer-than-normal temperatures have melted the snowpack earlier than usual, with less than a foot of snowpack remaining in the mountains of Alaska. June Streamflow was near normal at most stream gauges, although a few in the northwest and the southern panhandle were below normal. Wildfires developed in Alaska during the last half of June. Abnormal dryness expanded to about 27 percent of the state on the June 28th USDM map.
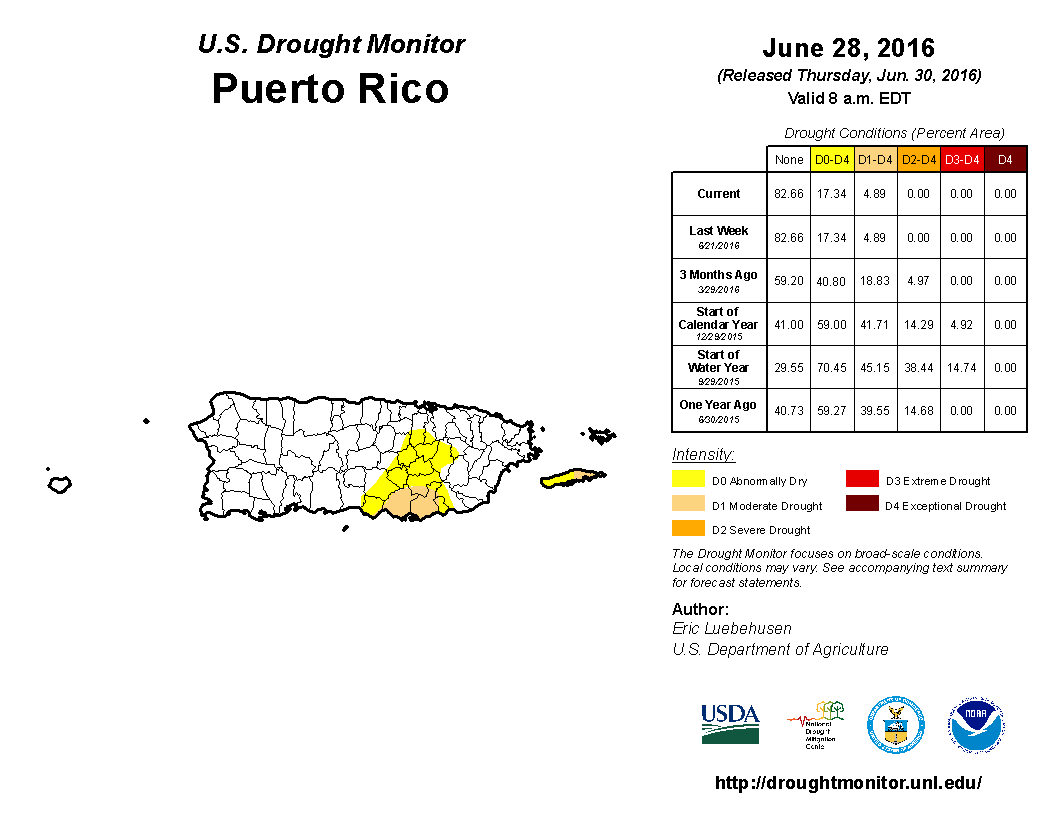
Puerto Rico: Puerto Rico was drier-than-normal in the south and east and wetter than normal in the west during June. This pattern is fairly consistent for the last 2, 3, 6, and 9 months. Soils were still dry across parts of central Puerto Rico and the southern coastal area. As shown by the June 28th USDM map, abnormal dryness and drought continued at about 17 percent of Puerto Rico, with moderate drought at about 5 percent of the island.
CONUS State Precipitation Ranks:
 |

|

Connecticut precipitation, July-June, 1895-2016.
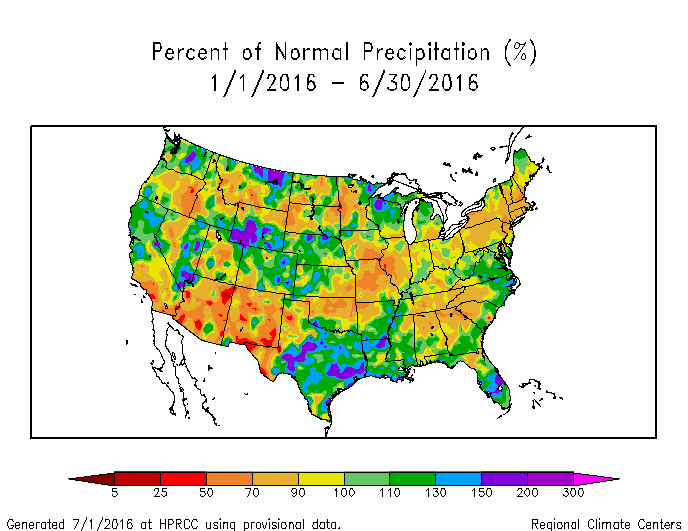
June 2016 was drier than normal across a wide swath of the CONUS from the Northern Rockies to Mid-Mississippi Valley and much of the Southwest, Northeast, and Southeast. Several states ranked in their driest third of the 1895-2016 record, with Nebraska, South Dakota, and Wyoming (in the central CONUS) and Massachusetts and Rhode Island (in the Northeast) in the top twelve driest category. Dryness was not as widespread and intense for the April-June period. Fifteen states (in the Northwest, Northeast, and Mid-Mississippi Valley) ranked in their driest third of the historical record with Connecticut having the eleventh driest April-June. The year-to-date (January-June) precipitation anomaly pattern continued dry anomalies in the Northeast, Deep South, and Mid-Mississippi Valley, as well as the Southwest. Twelve states ranked in the driest third of the historical record, with Connecticut having the ninth driest year to date. Three of the last four January-June periods have been very dry in Connecticut. Wetter-than-normal conditions dominated at the 12-month time scale. Six Northeast states ranked in the driest third of the historical record for July 2015-June 2016, with Connecticut having the fourth driest such 12-month period. The last three July-June periods have been very dry for Connecticut.

|

|
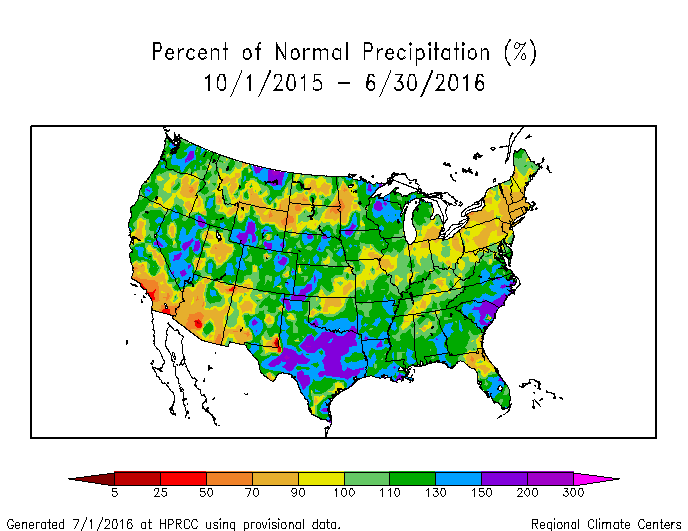
Percent area of the Western U.S. in moderate to extreme drought, January 1900 to present, based on the Palmer Drought Index.
As noted earlier, June was much drier than normal across much of the West, with only a few locations in the Southwest wetter than normal. The water year-to-date (October 1, 2015-June 30, 2016), overall, has been near to wetter than normal for much of the West but drier than normal in other parts. Mountain snowpack, which provides an important source of meltwater during the summer melt season, has essentially melted out already. Even though precipitation during this water year has been generally above normal, one wet season cannot make up for several years of moisture deficits, so drought continued in both the USDM and Palmer analyses. According to the USDM, 27.7 percent of the West was experiencing moderate to exceptional drought at the end of June, which is essentially the same as the previous month. The Palmer Drought Index percent area statistic for the West increased to 30.4 percent.
 Primary Corn and Soybean Belt precipitation, June, 1895-2016.
|
 Primary Corn and Soybean Belt precipitation, March-June, 1895-2016.
|
June was warmer and generally drier than normal in the Primary Corn and Soybean agricultural belt. Regionwide, June 2016 ranked as the 15th driest and ninth warmest June in the 1895-2016 record. March serves as the beginning of the growing season. Regionwide, March-June 2016 ranked as the 57th wettest and seventh warmest March-June in the 1895-2016 record.
NOAA Regional Climate Centers:
A more detailed drought discussion, provided by the NOAA Regional Climate Centers and others, can be found below.
As described by the High Plains Regional Climate Center, a major pattern change occurred in the High Plains in June, as cooler and wetter conditions in May abruptly transitioned to warmer and drier weather to start the summer season. The warmth and dryness experienced in June caused impacts around the region. Streamflows declined in some areas. Drought developed in the eastern Dakotas and south-central Nebraska, and it intensified rapidly in western South Dakota and northeastern Wyoming. Topsoil dried out quickly, and subsoil moisture began to decline. At the beginning of the month, topsoil moisture was just 12 percent short to very short in South Dakota, but that number more than quadrupled to 50 percent by the end of the month. In Nebraska, topsoil moisture went from 7 percent to 33 percent short to very short during June. Subsoil moisture also suffered regionwide, as South Dakota was faring the worst at the end of the month with 39 percent short to very short, followed by 31 percent in Wyoming. The deficiencies in soil moisture were impacting agriculture, as visual stress to corn was reported in southern Nebraska and northeastern South Dakota. But the drought impacts to crops or rangeland were mainly localized. Despite the high temperatures and lack of adequate precipitation and soil moisture, crop and pasture conditions were mostly in good shape. This was likely due in part to cool and wet conditions in May, although this is likely to change if dryness continues into July. Dry weather also had positive impacts around the region, as it accelerated maturation of small grains in North Dakota and allowed for harvesting of winter wheat in Kansas.
The warmth and dryness experienced across most of the region in June caused expansion of drought conditions in several locations. According to the USDM, the area experiencing drought or abnormally dry conditions (D0-D4) increased from about 9 percent to over 27 percent in the last month. The largest area in drought extended from far southwestern North Dakota southward to include most of western South Dakota and northeastern Wyoming. Dryness that has been present since spring has caused several impacts, such as increased fires, low productivity of rangeland, reductions in livestock, hay losses, and early irrigation. The continued dryness prompted the introduction of severe drought (D2), and then extreme drought (D3), to part of the region by USDM authors. A second area of drought developed in northeastern South Dakota/southeastern North Dakota in June. This region has been rather dry since May. The combination of high temperatures and little precipitation was causing stress to lawns and corn. Dryness also developed across central/eastern Nebraska and eastern Kansas during June, prompting the introduction of widespread abnormal dryness (D0) to the region, as well as a small area of moderate drought (D1) in south-central Nebraska. Dry topsoil was being reported by extension educators in eastern Nebraska. If above-normal temperatures and dry conditions continue into July, drought is likely to spread and intensify across the region.
As explained by the Southern Regional Climate Center, with the exception of southwestern Texas, the Southern region experienced a warmer than normal June. Precipitation was predominantly controlled by convective activity. This ultimately resulted in a very scattered pattern of precipitation, with islands of both negative and positive precipitation anomalies. In general, precipitation regionwide averaged below normal with very dry conditions in western Arkansas and eastern Oklahoma. Drought conditions did not change much from the month of May. As of July 5, 2016, Arkansas and Texas remain drought-free. There is some new moderate (D1) drought in central Oklahoma, and conditions have deteriorated in Mississippi, which is now showing a fair amount of moderate and some severe (D2) drought in the central counties. In Tennessee, drought conditions have improved in the north-central counties, however, conditions have gotten a bit worse in the southern counties of middle Tennessee. An area of severe (D2) drought now covers the south central counties of the state.
As summarized by the Midwest Regional Climate Center, the Midwest was drier than normal in June, ranking as the 26th driest on record (1895-2016). It was the 18th warmest June on record regionwide. The month began with no drought in the region and just under 14 percent of the region classified as abnormally dry according to the May 31st release of the USDM. The areas of dryness were mostly in the western half of the region at the onset of the month, with Illinois, Indiana, Ohio, and Lower Michigan all free of drought and abnormally dry conditions. Areas of abnormally dry, and a few areas of drought, were introduced and expanded as the month went on. As of the June 28th release, drought covered 3.4 percent of the region and another 23.6 percent was abnormally dry. The moderate drought areas included west central Minnesota, southeast Iowa, northeast Missouri, and west central Illinois. Dryness touched all Midwest states except Wisconsin.
The corn crop in the Midwest was nearly all planted by the beginning of the month and the remaining acres were quickly finished in the first week or so of June. The soybean crop was well over half way planted at the beginning of the month and was nearly all in the ground by the latter part of the month. Corn condition, according to the June 27th National Agricultural Statistics Service, were good or excellent for a majority of the region. Statewide conditions of good or excellent ranged from 86 percent in Wisconsin to 63 percent in Missouri and Michigan. Soybeans were similar with good or excellent conditions ranging from 84 percent in Wisconsin to 57 percent in Missouri. The warm and dry weather dried out topsoil in the region from the May 30th to June 27th reports, particularly in Missouri (7 to 51 percent short or very short topsoil moisture) and Michigan (28 to 60 percent).
As noted by the Southeast Regional Climate Center, temperatures were above average across much of the Southeast region and precipitation was highly variable, with extremes of both observed. The driest locations were found across portions of eastern Alabama, central and northern Georgia, Upstate South Carolina, western North Carolina, and the Florida Keys, where monthly precipitation totals were between 5 and 50 percent of normal. Precipitation was generally above normal across western Puerto Rico and below normal across eastern Puerto Rico and the U.S. Virgin Islands during the month.
Drought conditions intensified and expanded in coverage across several areas of the Southeast region during June, including northern Georgia, northern Alabama, and western portions of the Carolinas. By June 28th, severe (D2) drought conditions, with a few localized pockets of extreme (D3) drought, had developed across nearly 25 percent of Georgia and 15 percent of Alabama. Small areas of severe drought also emerged in far western portions of the Carolinas. Drought conditions did not change across Puerto Rico during the month, as a small southeastern portion of the island remained under moderate (D1) drought. A persistence of above-average temperatures and lack of rainfall during June severely stressed field crops (corn, cotton, and soybeans) and pastures across Alabama and Georgia. Many livestock producers in these areas had to begin a supplemental feeding for their herds due to a shortage of forage grasses. Unfavorable growing conditions resulted in well below average wheat yields in Virginia and North Carolina, and over 50 (25) percent of the peach crop in Virginia (North Carolina) was reported to be in poor condition, primarily due to the two freeze events in early April. Some corn fields in South Carolina were infested with an unusually large number of stink bugs, which can be partially attributed to a mild winter season.
As explained by the Northeast Regional Climate Center, the Northeast wrapped up June with above-normal temperatures and below-normal precipitation, regionwide. The USDM released on June 2 showed 39 percent of the Northeast was abnormally dry (D0) and 1 percent of the region was experiencing moderate drought (D1). D0 and D1 expanded in New England, New York, Pennsylvania, and New Jersey due to below-normal precipitation, low streamflows, and declining soil moisture. Conversely, above-normal rainfall eased lingering dryness in West Virginia and western Maryland. By the end of June, 53 percent of the Northeast was abnormally dry and 12 percent of the region was experiencing moderate drought. West Virginia, Maryland, and Delaware were the only states without areas of D0 and D1.
As summarized by the Western Regional Climate Center, temperatures were well above normal this month in a wide swath from southern California northeast to southeastern Montana. A few low-pressure systems impacted the West at mid-month, bringing late season precipitation to some areas. Above-normal precipitation was observed in the lee of the Sierra Nevada, southern Nevada, southern and central Arizona and several other scattered locations in the West. The Inland Northwest, northern Rockies, California, northern Nevada, and much of Utah were drier than normal. The Southwest received some precipitation associated with the low-pressure systems, though above-normal precipitation in this area was dominated by pre-monsoon activity during the last week of the month. Drought improvement was seen in west-central Nevada and across south-central and eastern New Mexico. Much of California and northern Nevada received little or no precipitation this month, not uncommon for June. Drought conditions worsened in northeastern Oregon as well as along the eastern Montana-Wyoming border. Several large fires impacted the West this month, especially in Arizona and California.
Most locations throughout Hawaii observed above normal precipitation this month, though June is typically the driest month of the year across the state. In Alaska, June was wetter than normal for the Southcentral region, some interior locations, and the North Slope. Western Alaska saw drier than normal conditions. Temperatures were near normal for the interior of the state and above normal in coastal areas.
Pacific Islands: The NOAA National Weather Service (NWS) offices, the Pacific ENSO Applications Climate Center (PEAC), and partners provided reports on conditions across the Pacific Islands.
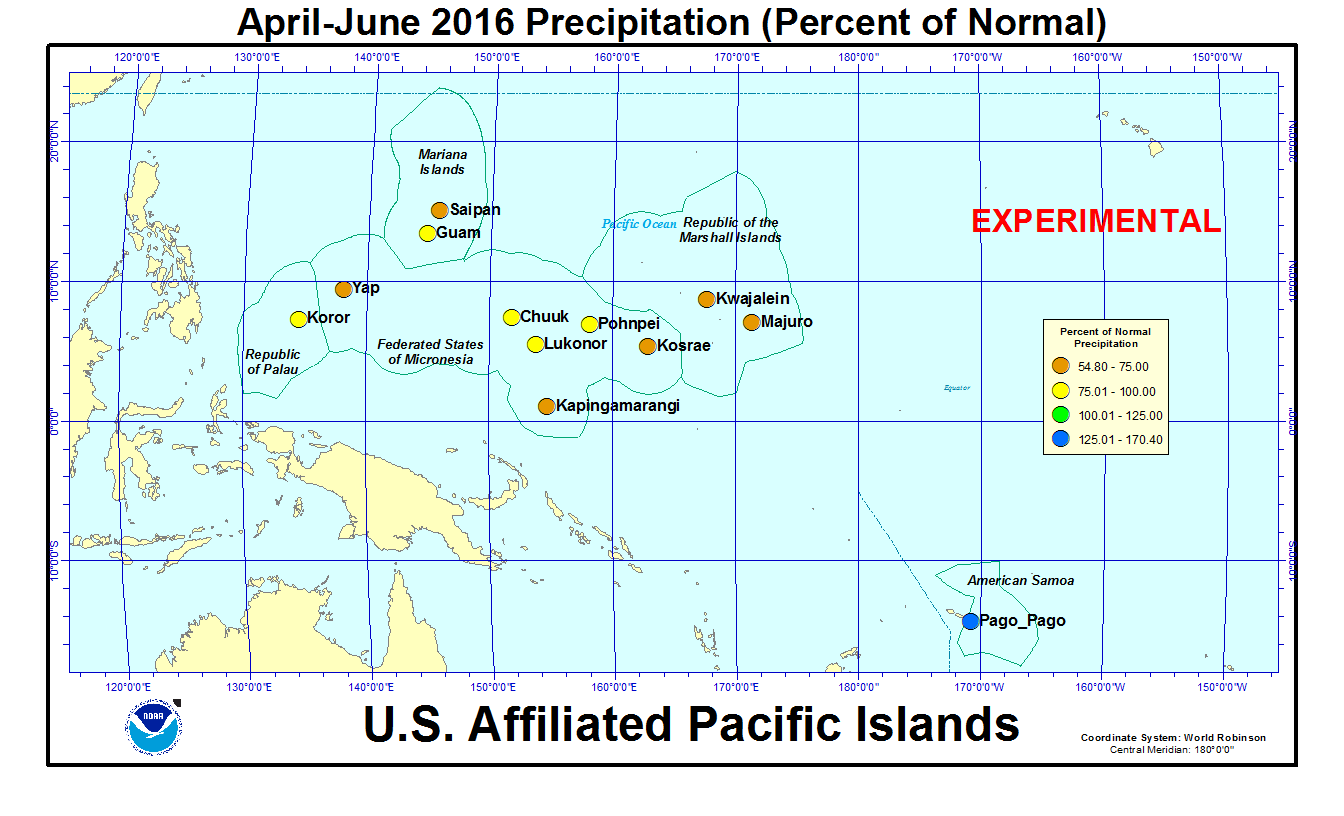
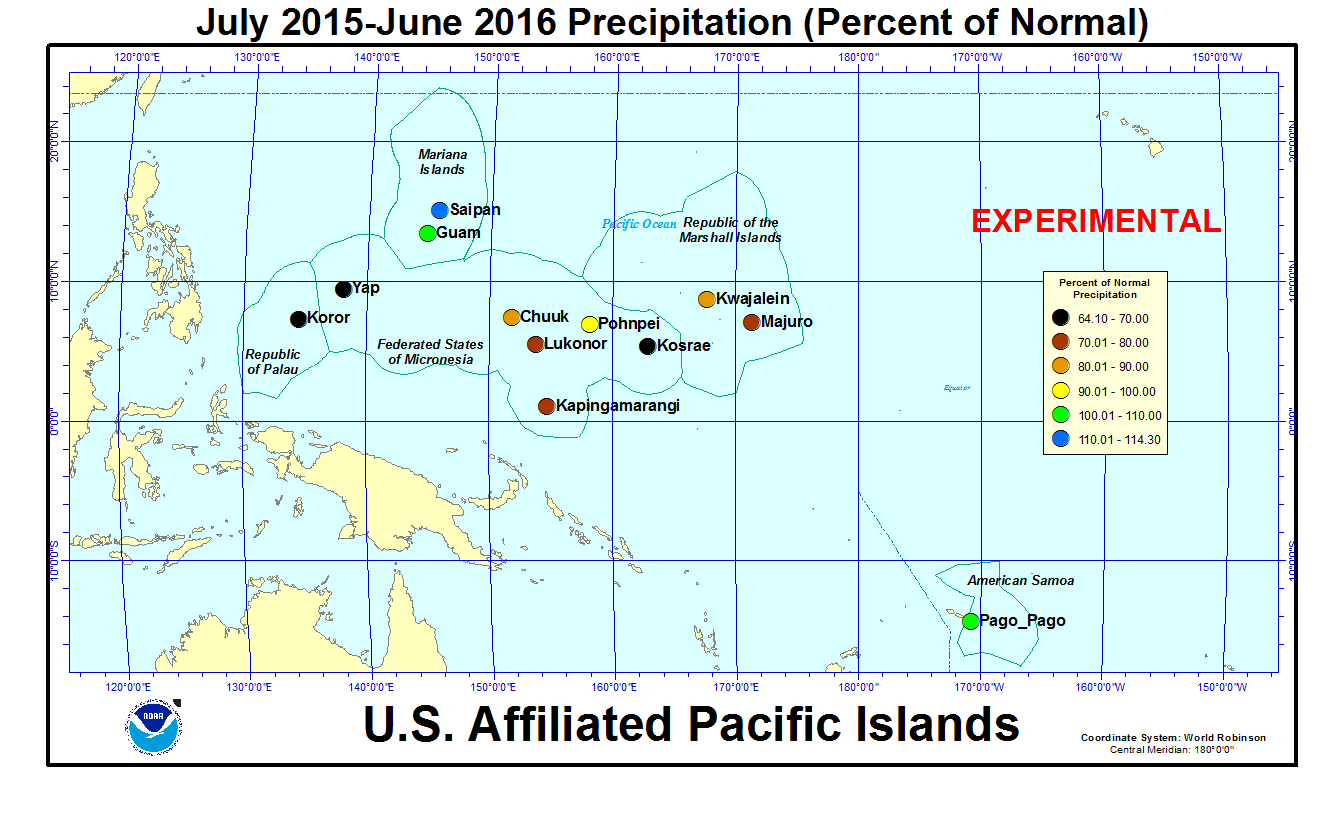
In the U.S. Affiliated Pacific Islands (maps — Federated States of Micronesia, Northern Mariana Islands, Marshall Islands, Republic of Palau, American Samoa, basinwide), June 2016 was wetter than normal at Guam, Pohnpei, Kosrae, and Kwajalein. It was drier than normal at the rest of the primary stations.
Rainfall amounts were below the minimum thresholds (4 or 8 inches) required to meet most monthly water needs at stations in the Marianas, Yap State, Pohnpei State, the Marshall Islands, and American Samoa. With the demise of the El Niño, the rainfall pattern across Micronesia shifted and beneficial rain fell across Palau, much of the Federated States of Micronesia (FSM), and parts of the Marshall Islands. June rainfall was above the monthly minimum thresholds at Guam (in the Marianas), Koror (in Palau), Kwajalein and Mili (in the Marshalls), and several stations in the FSM.
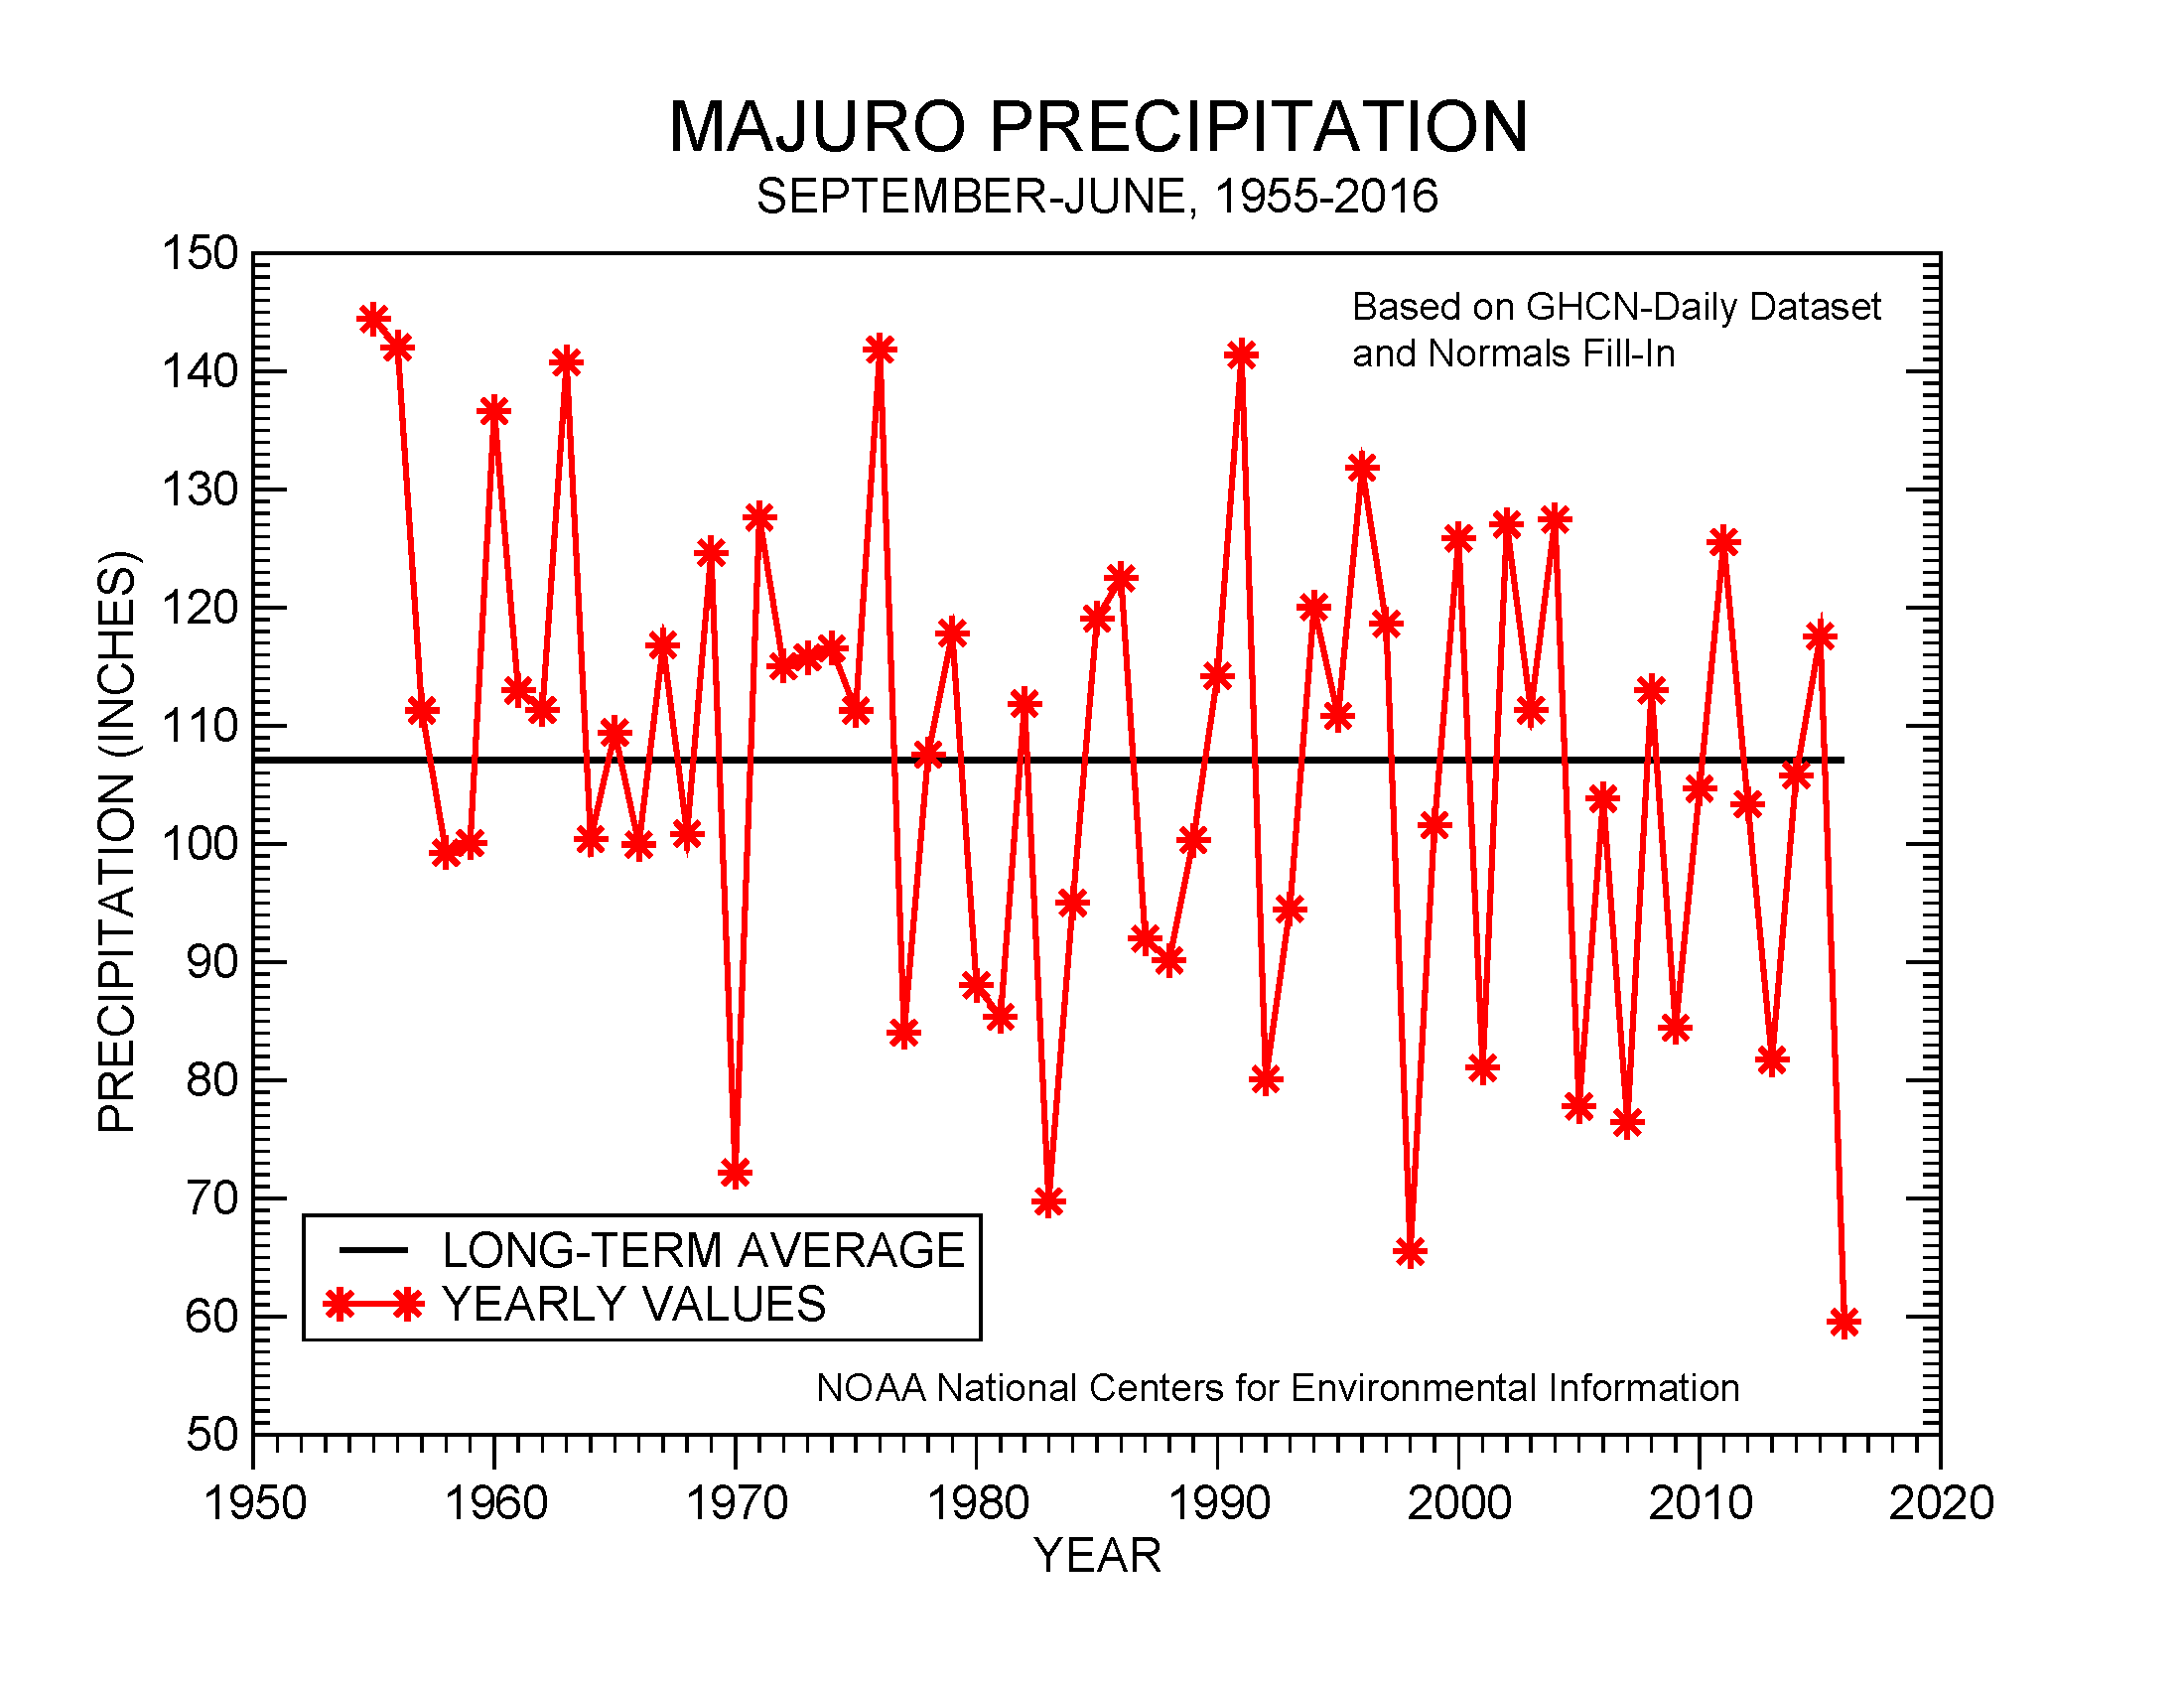
In the Marshall Islands, Utirik recorded 3.30 inches of rain in June 2016 with 17 of the last 20 months each less than 8 inches, and Jaluit measured 4.32 inches with 14 of the last 17 months dry. In the Mariana Islands, Saipan had 2.05 inches in June with seven of the last eight months dry. Rota received 2.54 inches with five of the last six months dry. In the FSM, Ulithi reported 4.88 inches with June marking the tenth consecutive dry (less than 8 inches) month. The last nine consecutive months have been dry at Maap and Rumung. The 4- and 8-inch thresholds are important because, if monthly precipitation falls below the threshold, then drought becomes a concern. The tropical Pacific is in an ENSO-neutral state with a La Niña predicted to begin later this year. During a La Niña, rainfall decreases in southern Pohnpei State. Kapingamarangi, which is in southern Pohnpei State, received 3.30 inches of rain during June, which is below their 4-inch monthly threshold.
As measured by percent of normal precipitation, Chuuk, Kapingamarangi, Majuro, and Yap have been drier than normal in the short term (June and the last 3 months [April-June 2016]) as well as the long term (year to date [January-June 2016] and last 12 months [July 2015-June 2016]). Saipan was drier than normal in the short term but wetter than normal in the long term. Kosrae, Kwajalein, and Pohnpei were wetter than normal during June but drier than normal for the other three time scales. Pago Pago was drier than normal during June but wetter than normal for the other three time scales. Koror was near normal at the 3-month time scale but drier than normal at the other three time scales. Lukonor was near normal at the 6-month time scale but drier than normal at the other three time scales. Guam was near to wetter than normal for June and the last 12 months, but drier than normal at the 3- and 6-month time scales.
| Station Name | Jul 2015 | Aug 2015 | Sep 2015 | Oct 2015 | Nov 2015 | Dec 2015 | Jan 2016 | Feb 2016 | Mar 2016 | Apr 2016 | May 2016 | Jun 2016 | Jul- Jun |
|---|---|---|---|---|---|---|---|---|---|---|---|---|---|
| Chuuk | 54% | 155% | 188% | 53% | 70% | 82% | 63% | 29% | 85% | 86% | 107% | 91% | 88% |
| Guam NAS | 215% | 146% | 108% | 125% | 81% | 74% | 65% | 120% | 79% | 52% | 53% | 125% | 101% |
| Kapingamarangi | 54% | 162% | 112% | 63% | 89% | 134% | 103% | 65% | 88% | 94% | 34% | 24% | 71% |
| Koror | 27% | 73% | 143% | 53% | 69% | 41% | 26% | 30% | 36% | 135% | 115% | 93% | 64% |
| Kosrae | 108% | 138% | 115% | 63% | 33% | 95% | 60% | 113% | 32% | 23% | 72% | 130% | 68% |
| Kwajalein | 104% | 171% | 95% | 105% | 88% | 59% | 64% | 17% | 45% | 21% | 57% | 142% | 90% |
| Lukonor | 77% | 75% | 149% | 40% | 123% | 56% | 123% | 61% | 51% | 113% | 102% | 73% | 75% |
| Majuro | 87% | 207% | 96% | 83% | 40% | 61% | 14% | 46% | 20% | 22% | 110% | 66% | 75% |
| Pago Pago | 72% | 125% | 18% | 88% | 210% | 183% | 34% | 54% | 101% | 329% | 102% | 73% | 105% |
| Pohnpei | 138% | 199% | 124% | 78% | 67% | 71% | 102% | 49% | 44% | 60% | 80% | 143% | 94% |
| Saipan | 112% | 141% | 92% | 198% | 64% | 154% | 54% | 105% | 106% | 68% | 87% | 57% | 114% |
| Yap | 82% | 148% | 68% | 43% | 37% | 58% | 35% | 34% | 15% | 62% | 113% | 54% | 67% |
| Station Name | Jul 2015 | Aug 2015 | Sep 2015 | Oct 2015 | Nov 2015 | Dec 2015 | Jan 2016 | Feb 2016 | Mar 2016 | Apr 2016 | May 2016 | Jun 2016 | Jul- Jun |
|---|---|---|---|---|---|---|---|---|---|---|---|---|---|
| Chuuk | 6.45" | 19.91" | 22.07" | 6.09" | 7.46" | 9.25" | 6.40" | 2.09" | 7.08" | 10.73" | 12.11" | 10.61" | 120.25" |
| Guam NAS | 21.80" | 21.54" | 13.71" | 14.26" | 5.96" | 3.77" | 2.62" | 3.63" | 1.63" | 1.31" | 1.80" | 7.73" | 99.76" |
| Kapingamarangi | 7.71" | 13.14" | 11.08" | 5.13" | 8.28" | 13.20" | 9.40" | 6.04" | 10.02" | 12.78" | 4.07" | 3.30" | 104.15" |
| Koror | 4.98" | 9.90" | 16.88" | 6.24" | 7.86" | 4.59" | 2.64" | 2.53" | 2.68" | 9.90" | 13.55" | 16.25" | 98" |
| Kosrae | 16.17" | 19.69" | 16.36" | 6.90" | 4.55" | 15.37" | 9.95" | 14.56" | 5.15" | 3.99" | 12.70" | 18.99" | 144.38" |
| Kwajalein | 10.28" | 16.63" | 10.24" | 11.71" | 9.98" | 3.90" | 2.02" | 0.46" | 1.05" | 1.13" | 3.80" | 9.81" | 81.01" |
| Lukonor | 12.22" | 10.55" | 15.15" | 4.53" | 11.18" | 6.35" | 10.37" | 5.44" | 4.75" | 12.83" | 11.92" | 8.49" | 113.78" |
| Majuro | 9.72" | 24.24" | 10.72" | 10.52" | 5.33" | 6.93" | 1.11" | 3.17" | 1.33" | 2.05" | 11.12" | 7.27" | 93.51" |
| Pago Pago | 3.99" | 6.75" | 1.20" | 8.15" | 21.33" | 23.53" | 4.49" | 6.49" | 10.76" | 30.87" | 9.89" | 3.88" | 131.33" |
| Pohnpei | 21.31" | 28.33" | 15.59" | 11.86" | 9.95" | 11.41" | 13.49" | 4.64" | 5.76" | 11.01" | 16.06" | 21.18" | 170.59" |
| Saipan | 10.00" | 18.51" | 9.26" | 21.00" | 3.61" | 5.94" | 1.36" | 2.72" | 2.00" | 1.78" | 2.07" | 2.05" | 80.3" |
| Yap | 12.39" | 21.99" | 9.21" | 5.29" | 3.31" | 4.93" | 2.23" | 1.77" | 0.70" | 3.47" | 8.90" | 6.46" | 80.65" |
| Station Name | Jul 2015 | Aug 2015 | Sep 2015 | Oct 2015 | Nov 2015 | Dec 2015 | Jan 2016 | Feb 2016 | Mar 2016 | Apr 2016 | May 2016 | Jun 2016 | Jul- Jun |
|---|---|---|---|---|---|---|---|---|---|---|---|---|---|
| Chuuk | 11.98" | 12.86" | 11.71" | 11.51" | 10.61" | 11.25" | 10.10" | 7.25" | 8.32" | 12.47" | 11.30" | 11.66" | 136.77" |
| Guam NAS | 10.14" | 14.74" | 12.66" | 11.44" | 7.38" | 5.11" | 4.01" | 3.03" | 2.07" | 2.53" | 3.40" | 6.18" | 99.09" |
| Kapingamarangi | 14.15" | 8.13" | 9.93" | 8.19" | 9.27" | 9.84" | 9.15" | 9.27" | 11.43" | 13.64" | 12.08" | 13.78" | 145.85" |
| Koror | 18.53" | 13.50" | 11.77" | 11.84" | 11.39" | 11.16" | 10.18" | 8.56" | 7.44" | 7.32" | 11.83" | 17.48" | 152.90" |
| Kosrae | 14.91" | 14.22" | 14.22" | 10.94" | 13.83" | 16.11" | 16.67" | 12.93" | 16.06" | 17.51" | 17.75" | 14.64" | 213.87" |
| Kwajalein | 9.87" | 9.74" | 10.74" | 11.18" | 11.28" | 6.66" | 3.16" | 2.64" | 2.35" | 5.26" | 6.72" | 6.93" | 90.41" |
| Lukonor | 15.93" | 14.04" | 10.15" | 11.32" | 9.08" | 11.27" | 8.41" | 8.93" | 9.26" | 11.31" | 11.69" | 11.65" | 151.36" |
| Majuro | 11.17" | 11.69" | 11.17" | 12.73" | 13.44" | 11.39" | 7.74" | 6.88" | 6.58" | 9.42" | 10.11" | 11.01" | 125.25" |
| Pago Pago | 5.55" | 5.38" | 6.53" | 9.26" | 10.14" | 12.84" | 13.34" | 12.00" | 10.68" | 9.39" | 9.66" | 5.33" | 125.57" |
| Pohnpei | 15.43" | 14.26" | 12.55" | 15.27" | 14.83" | 16.08" | 13.18" | 9.55" | 13.17" | 18.41" | 19.96" | 14.81" | 182.36" |
| Saipan | 8.91" | 13.13" | 10.09" | 10.62" | 5.61" | 3.85" | 2.53" | 2.59" | 1.89" | 2.63" | 2.38" | 3.62" | 70.25" |
| Yap | 15.08" | 14.82" | 13.50" | 12.18" | 8.83" | 8.51" | 6.39" | 5.19" | 4.56" | 5.63" | 7.85" | 12.04" | 120.31" |
In early March, a State of Disaster was declared by the government of the Republic of the Marshall Islands, and it continued for much of the Marshall Islands as of this writing. In early July, the NOAA National Weather Service office in Guam updated the Drought Information Statement for the Republic of Palau, the Mariana Islands, the Marshall Islands, and FSM. The Drought Information Statement noted that drought persists for the Commonwealth of the Northern Mariana Islands and for the far northern Marshall Islands, and that drought could be developing for Kapingamarangi Atoll in southern Pohnpei State, but rainfall has improved at most other locations across Micronesia and immediate drought conditions have eased.
 |
 |
|
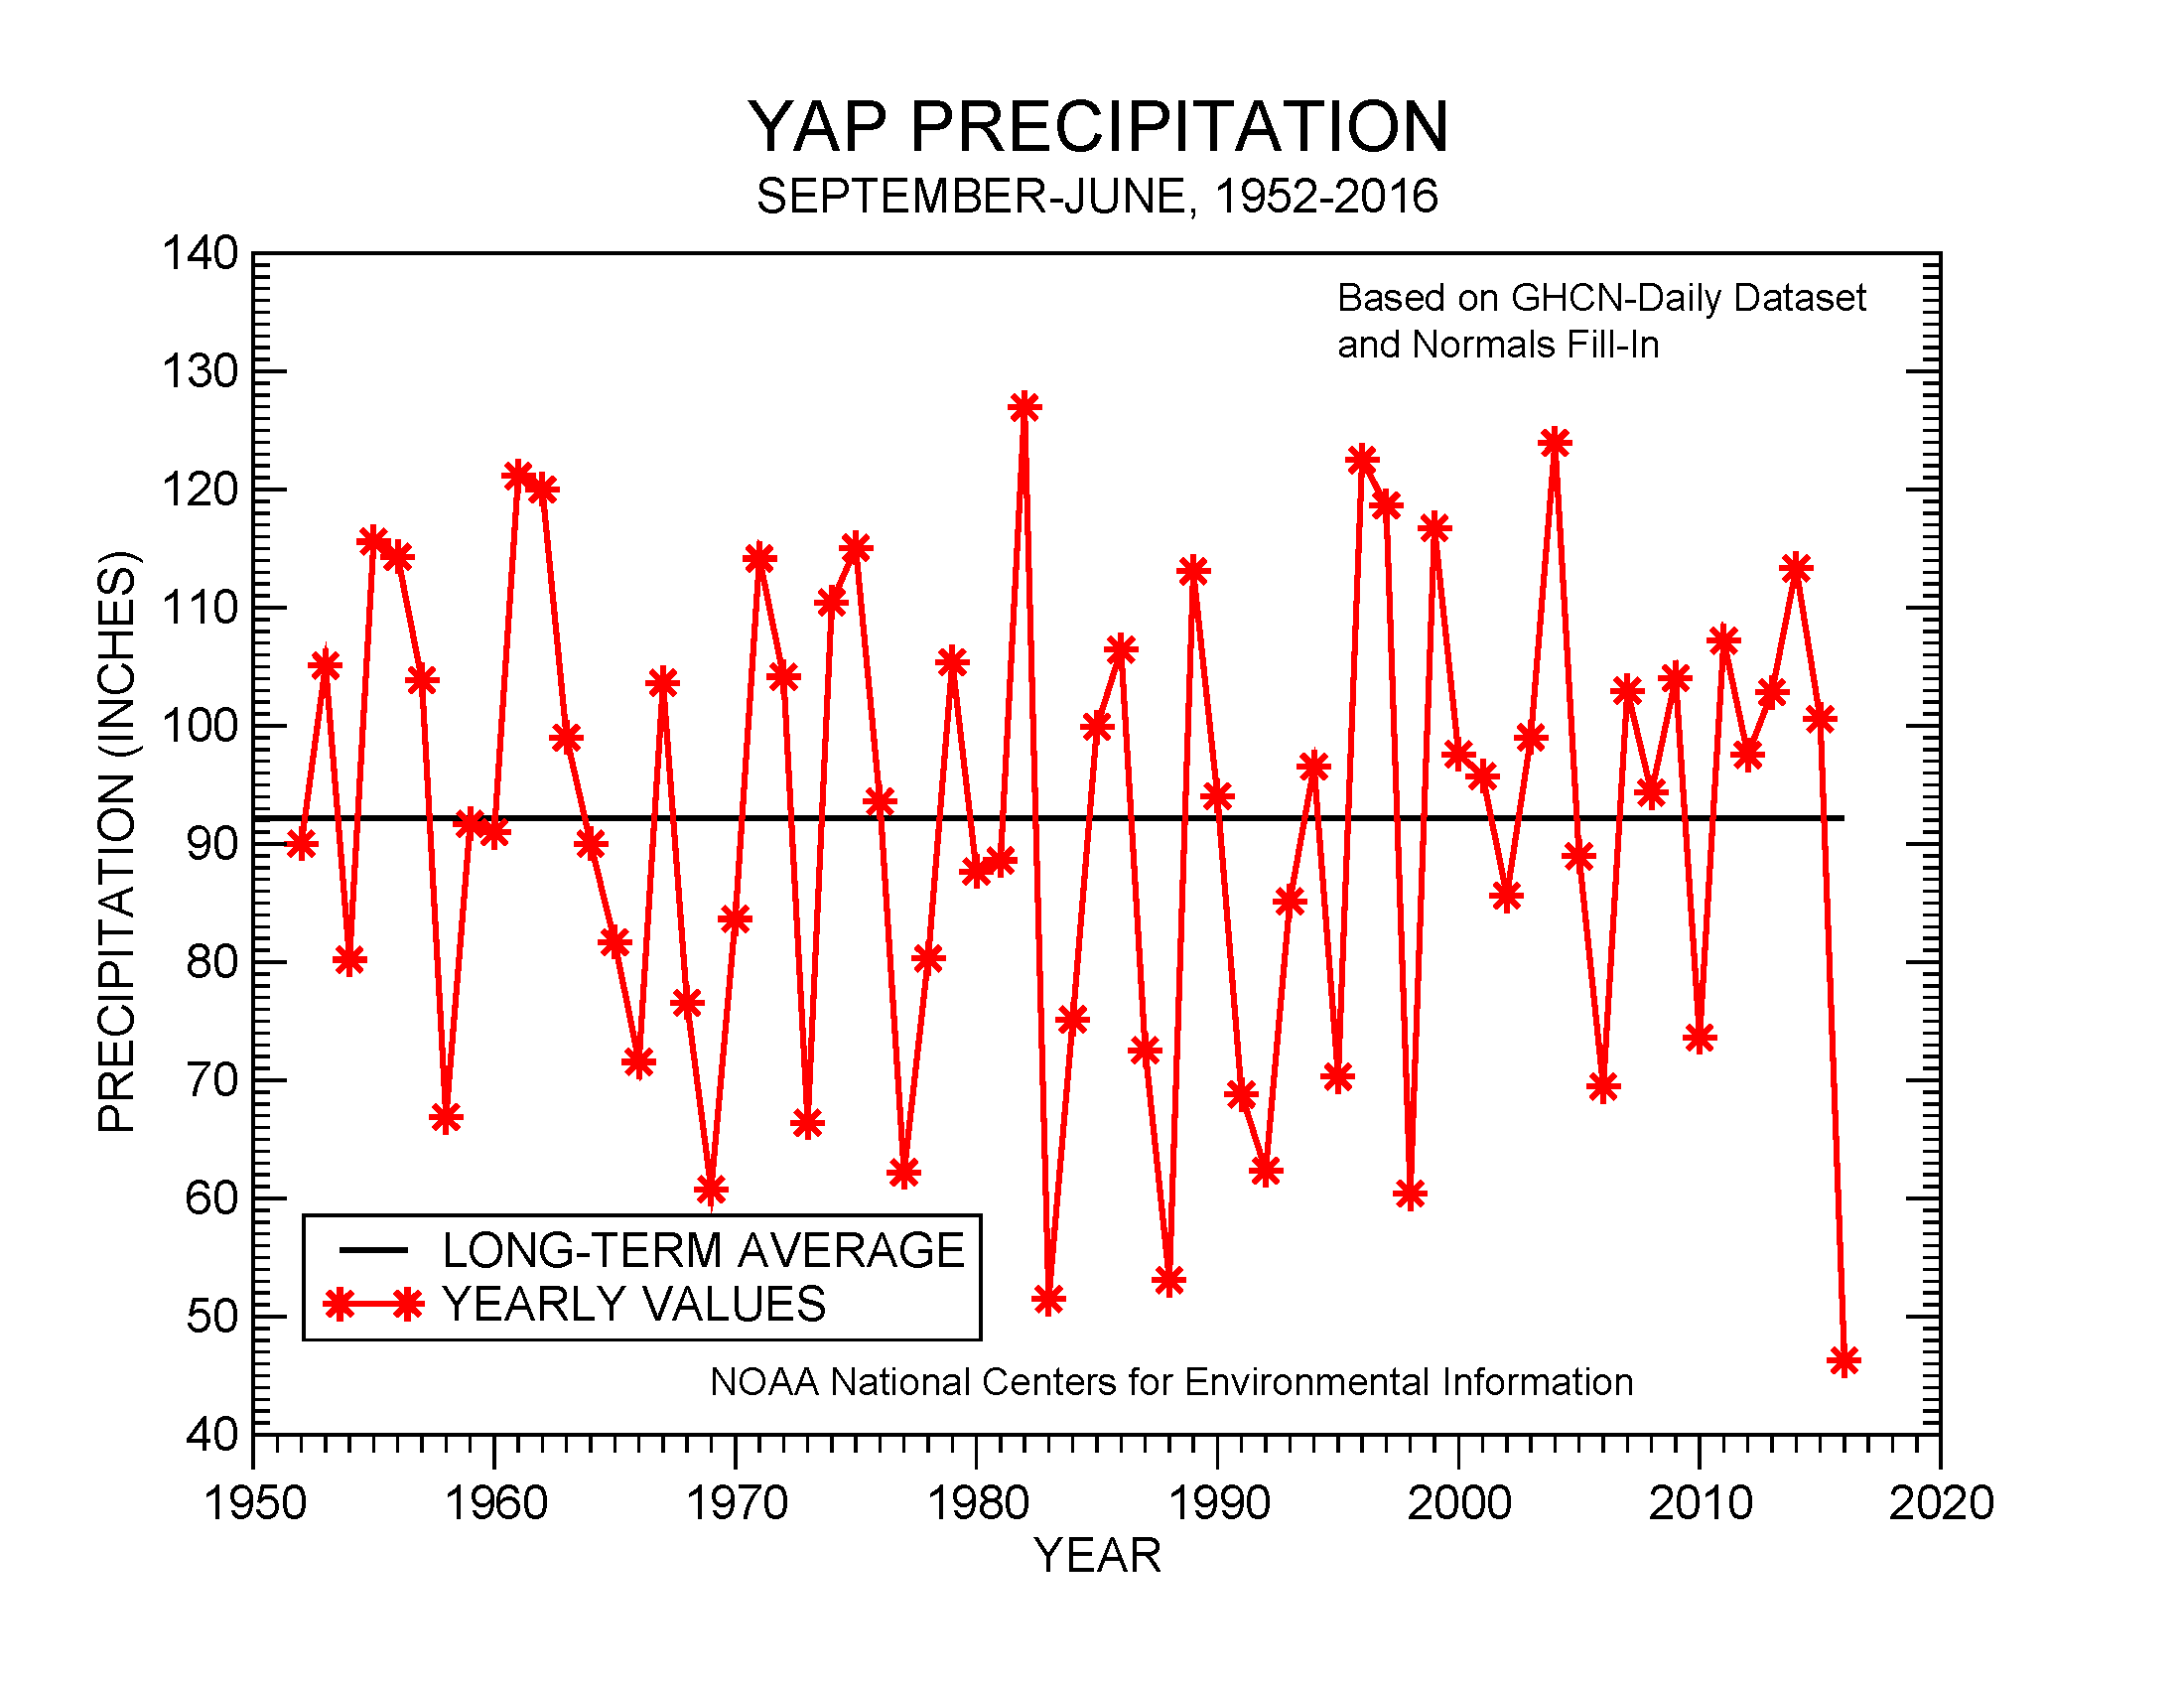
An analysis of historical data for the USAPI stations in the Global Historical Climatology Network-Daily (GHCN-D) dataset, augmented with fill-in data from the 1981-2010 Normals, indicated that several stations had record or near-record dryness during 2016 and 2015-2016. The following table lists the precipitation ranks for June 2016, January-June 2016 (year to date), and September 2015-June 2016 (roughly the time when the dry conditions began for many stations). Some stations have a long period of record and their dataset is fairly complete, while other stations have a shorter period of record and the dataset has some missing data. June 2016 was the driest June in the 1981-2016 record for Ulithi and second driest June for Jaluit (based on a 1981-2016 record), Pingelap (1981-2016), and Kapingamarangi (1962-2016). The year to date was the driest January-June on record for Utirik (1985-2016) and second driest for Jaluit, Ailinglapalap (1981-2016), Woleai (1968-2016), and Kapingamarangi. The last ten months (September 2015-June 2016) was the driest such September-June period on record at Jaluit, Woleai, Yap (1951-2016), Majuro (1954-2016), Ailinglapalap, and Pingelap.
Rank of 1 = driest.
| Station | June 2016 Rank |
June No. of Years |
Jan- Jun 2016 Rank |
Jan- Jun No. of Years |
Sep 2015- Jun 2016 Rank |
Sep- Jun No. of Years |
Period of Record |
| Jaluit | 2 | 33 | 2 | 33 | 1 | 31 | 1981-2016 |
| Koror | 33 | 65 | 9 | 65 | 4 | 65 | 1951-2016 |
| Woleai | 19 | 34 | 2 | 26 | 1 | 23 | 1968-2016 |
| Yap | 5 | 65 | 3 | 65 | 1 | 65 | 1951-2016 |
| Majuro | 10 | 63 | 3 | 62 | 1 | 62 | 1954-2016 |
| Mili | 33 | 33 | 7 | 33 | 3 | 31 | 1981-2016 |
| Ulithi | 1 | 34 | 3 | 33 | 2 | 32 | 1981-2016 |
| Ailinglapalap | 5 | 33 | 2 | 33 | 1 | 31 | 1981-2016 |
| Pingelap | 2 | 35 | 4 | 33 | 1 | 32 | 1981-2016 |
| Kosrae | 36 | 49 | 4 | 38 | 2 | 31 | 1954-2016 |
| Lukonor | 4 | 32 | 5 | 32 | 6 | 30 | 1981-2016 |
| Saipan | 6 | 36 | 6 | 35 | 3 | 27 | 1981-2016 |
| Pohnpei | 55 | 65 | 7 | 65 | 4 | 65 | 1951-2016 |
| Kwajalein | 41 | 65 | 8 | 64 | 5 | 64 | 1952-2016 |
| Kapingamarangi | 2 | 26 | 2 | 20 | 4 | 16 | 1962-2016 |
| Chuuk | 21 | 65 | 11 | 65 | 9 | 65 | 1951-2016 |
| Guam | 42 | 60 | 10 | 59 | 12 | 59 | 1957-2016 |
| Nukuoro | 10 | 34 | 11 | 33 | 14 | 31 | 1981-2016 |
| Pago Pago | 12 | 51 | 23 | 50 | 36 | 50 | 1966-2016 |
| Wotje | 24 | 33 | 14 | 33 | N/A | 30 | 1981-2016 |
| Utirik | 5 | 12 | 1 | 7 | N/A | 4 | 1985-2016 |


[top]
State/Regional/National Moisture Status
A detailed review of drought and moisture conditions is available for all contiguous U.S. states, the nine standard regions, and the nation (contiguous U.S.):
| northeast u. s. | east north central u. s. | central u. s. |
| southeast u. s. | west north central u. s. | south u. s. |
| southwest u. s. | northwest u. s. | west u. s. |
| Contiguous United States |
[top]
Contacts & Questions