|
Contents Of This Report: |

|
Please note that the values presented in this report are based on preliminary data. They will change when the final data are processed, but will not be replaced on these pages.
National Drought Overview
|
|
[top]
Detailed Drought Discussion
Overview
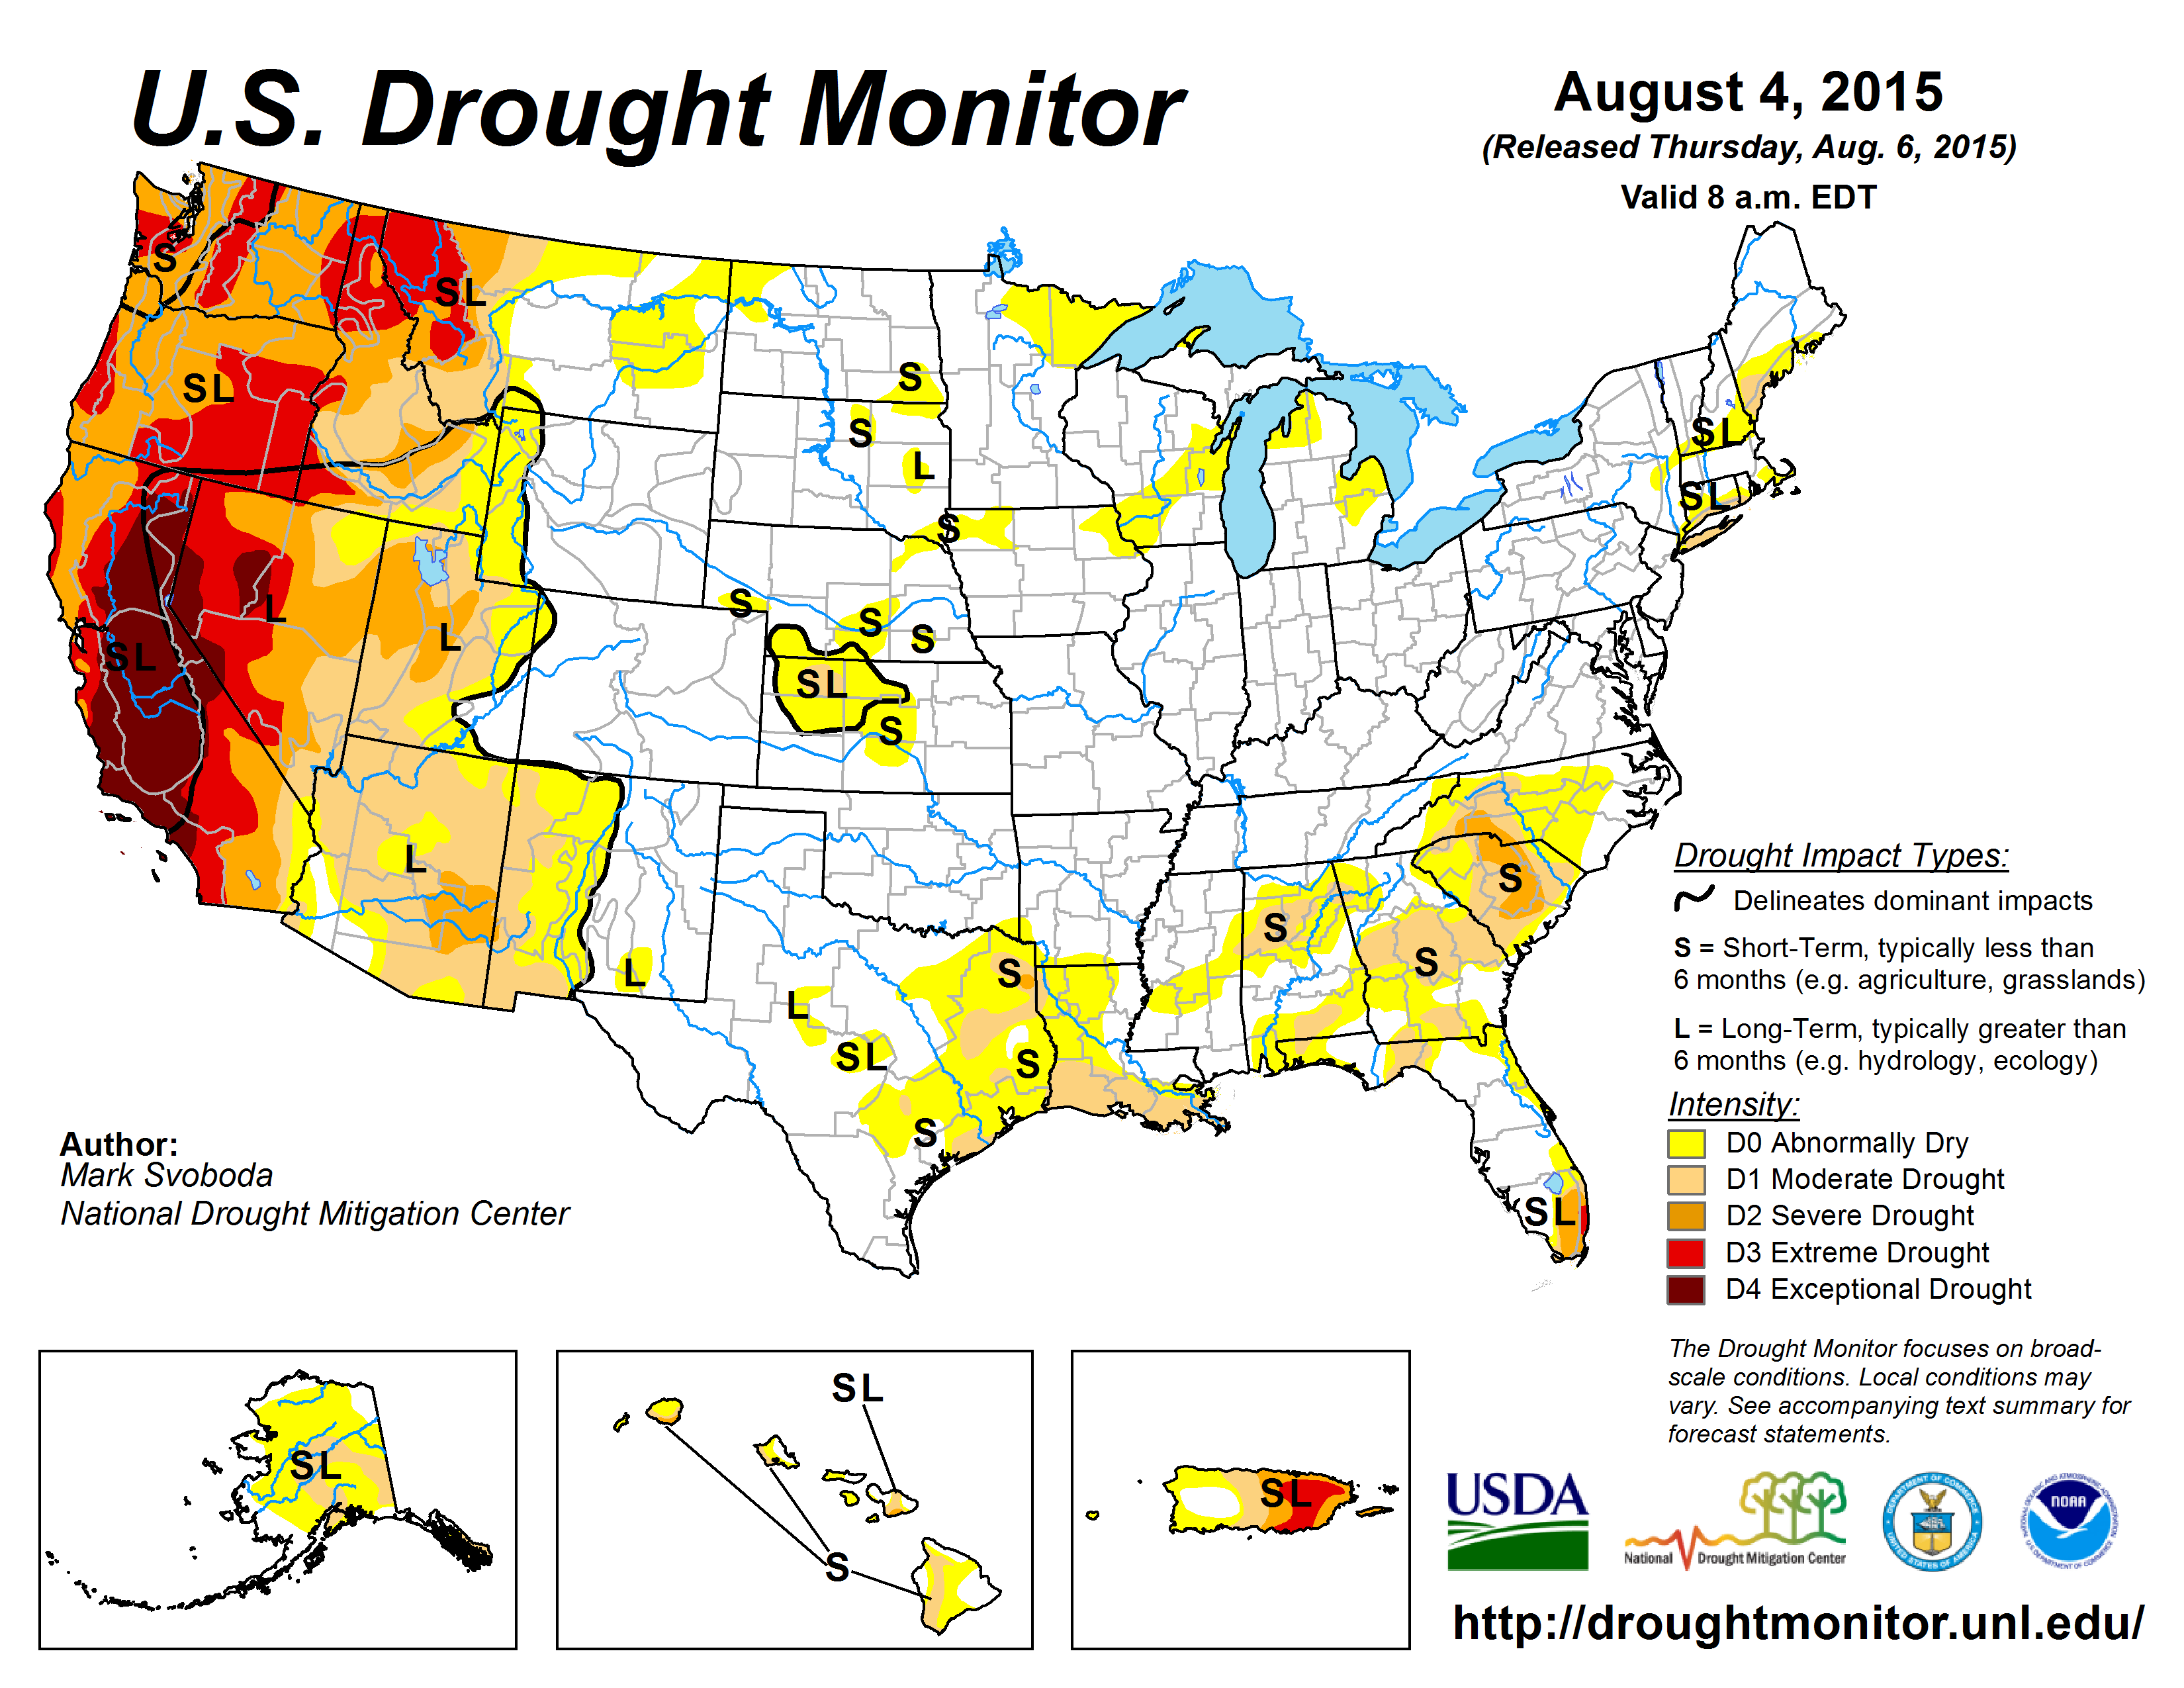
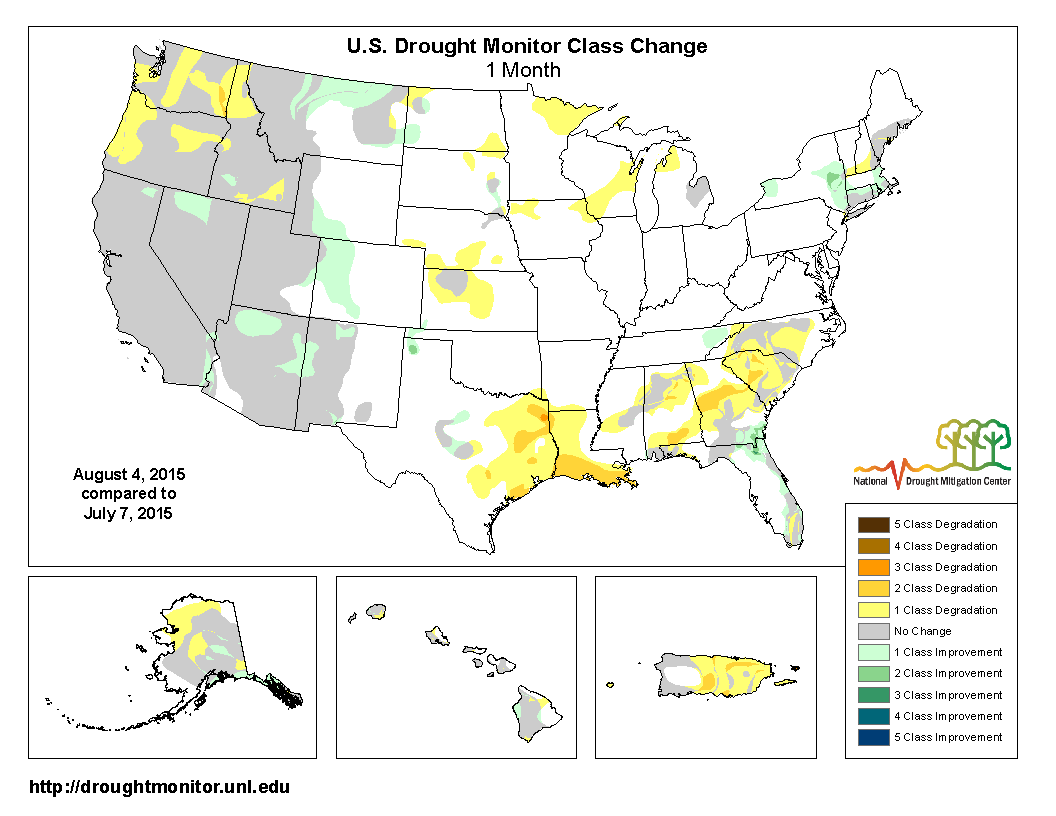
The U.S. Drought Monitor drought map valid August 4, 2015.
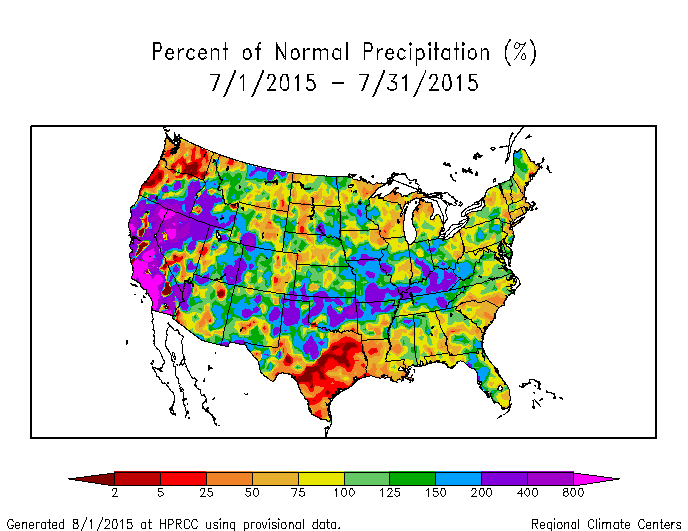
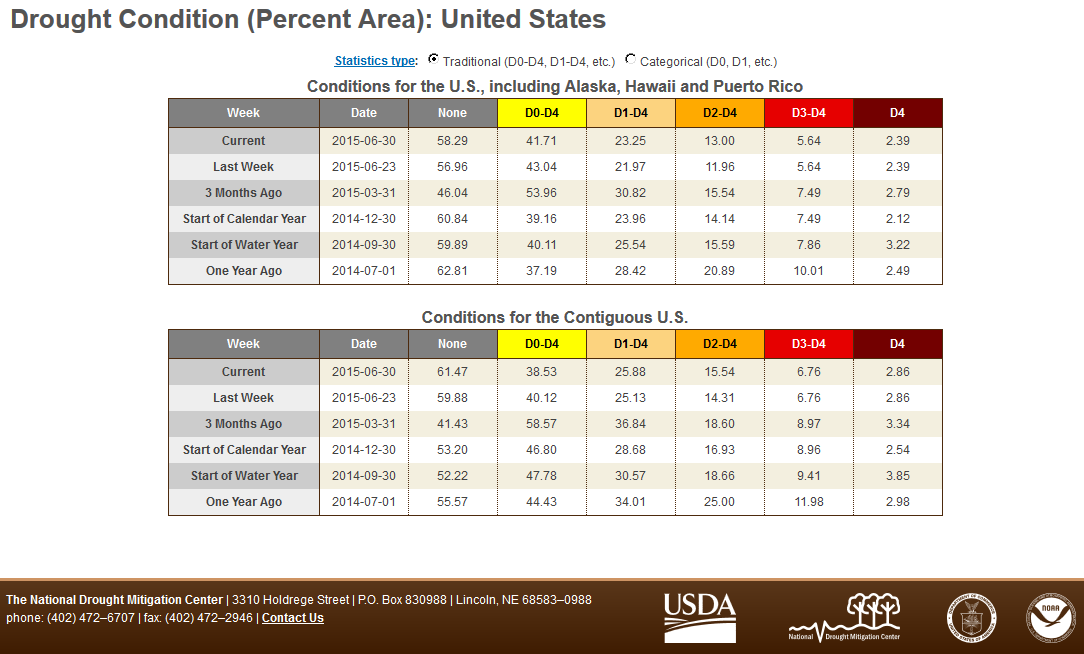
The weather and upper-level circulation during July 2015 were influenced by the North Pacific (in the Northwest) and North Atlantic (in the South) subtropical high pressure centers, El Niño-enhanced tropical moisture (over the Southwest), and an active jet stream (east of the Rockies). This combination of weather factors resulted in a generally warmer- and drier-than-normal month in the Pacific Northwest, Southern Plains, and Southeast, and cooler- and wetter-than-normal conditions across much of the West and Ohio Valley and parts of the Central Plains. As a result, drought and abnormally dry conditions expanded in the Southeast and Southern Plains, drought intensified in the Northwest, and drought and abnormally dry conditions contracted in other parts of the West and parts of the Northeast. Drier-than-normal conditions across parts of Alaska and Hawaii, and El Niño-enhanced dryness in Puerto Rico and across the Caribbean, prompted drought and abnormally dry conditions to expand in all three regions. When integrated across the CONUS, July 2015 ranked as the 14th wettest July in the 1895-2015 record, due largely to heavy rains that fell in the Midwest to Ohio Valley. On balance, the national drought footprint expanded when compared to last month, increasing from 23.3 percent of the U.S. as a whole to about 26.0 percent of the U.S. in moderate to exceptional drought, according to USDM statistics. According to the Palmer Drought Index, which goes back to the beginning of the 20th century, about 19.2 percent of the CONUS was in moderate to extreme drought at the end of July, a decrease of about 0.9 percent compared to last month.
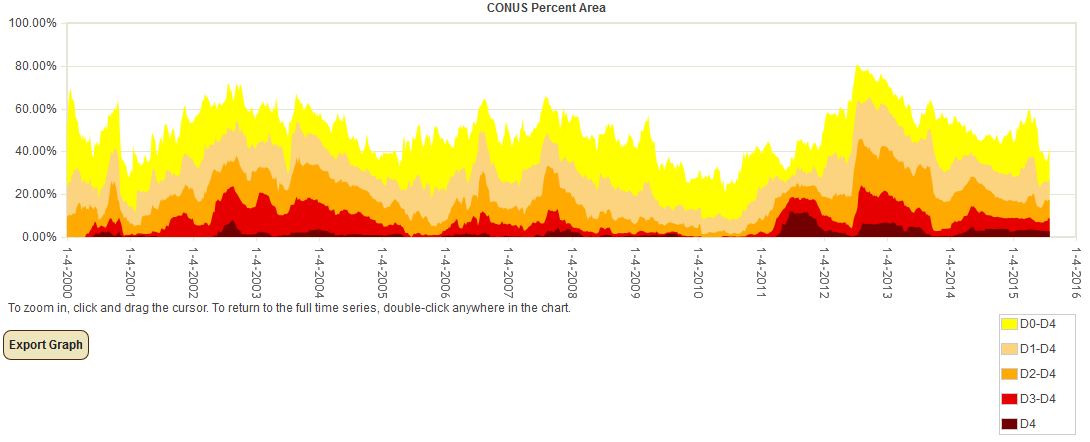
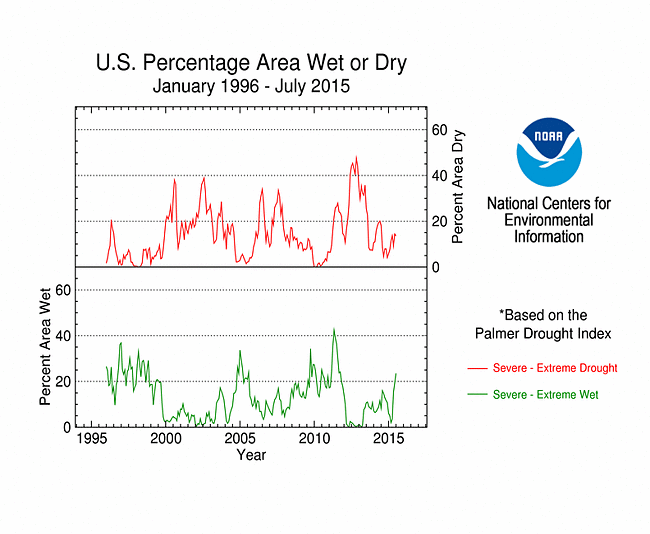
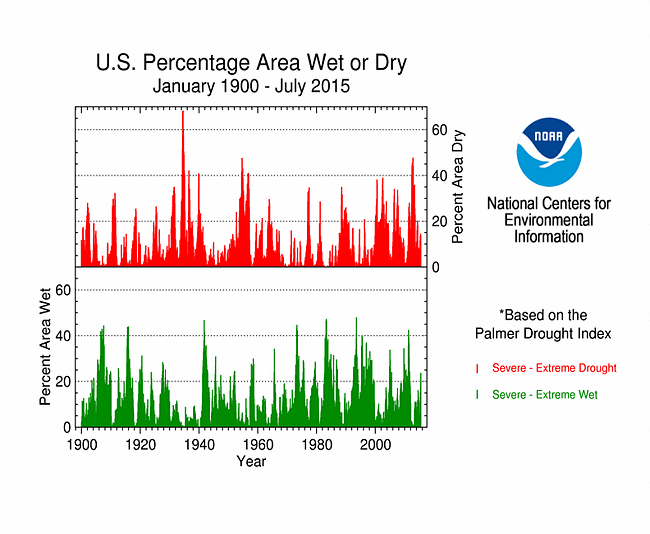
Percent area of the CONUS in moderate to exceptional drought, January 4, 2000 to present, based on the U.S. Drought Monitor.
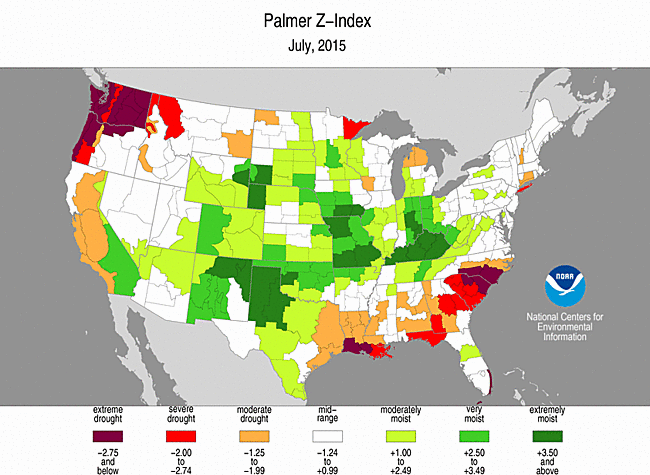
Palmer Drought Index
The Palmer drought indices measure the balance between moisture demand (evapotranspiration driven by temperature) and moisture supply (precipitation). The Palmer Z Index depicts moisture conditions for the current month, while the Palmer Hydrological Drought Index (PHDI) and Palmer Drought Severity Index (PDSI) depict the current month's cumulative moisture conditions integrated over the last several months. While both the PDSI and PHDI indices show long-term moisture conditions, the PDSI depicts meteorological drought while the PHDI depicts hydrological drought. The PDSI map shows less severe and extensive drought in parts of the West than the PHDI map because the meteorological conditions that produce drought and wet spell conditions are not as long-lasting as the hydrological impacts.
|
 |
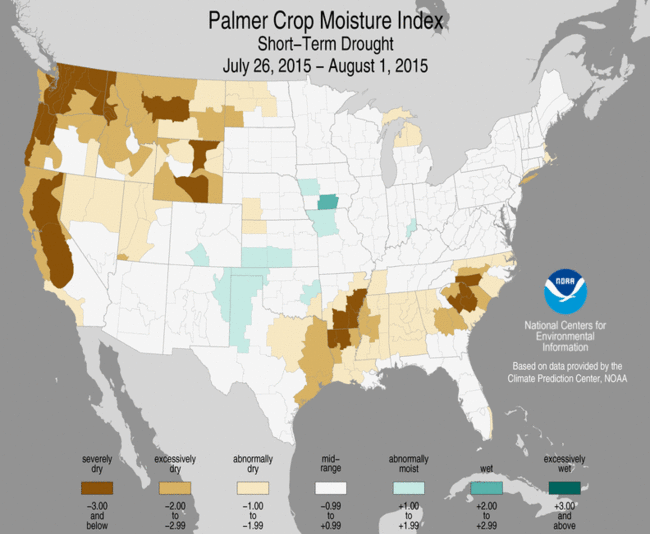
Used together, the Palmer Z Index and PHDI maps show that short-term dry conditions occurred over parts of the Pacific Northwest and Southeast, resulting in expanding or intensifying long-term drought in July compared to June. Short-term dry conditions in the Lower Mississippi Valley to eastern Texas reduced the long-term wet conditions, especially in east Texas. This is the dry season in southern California, so the short-term wet conditions there reduced the intensity of the long-term Palmer Drought Index, but did little to break the drought. Short-term wet conditions in the Midwest to Ohio Valley expanded and intensified long-term wet conditions, compared to last month.
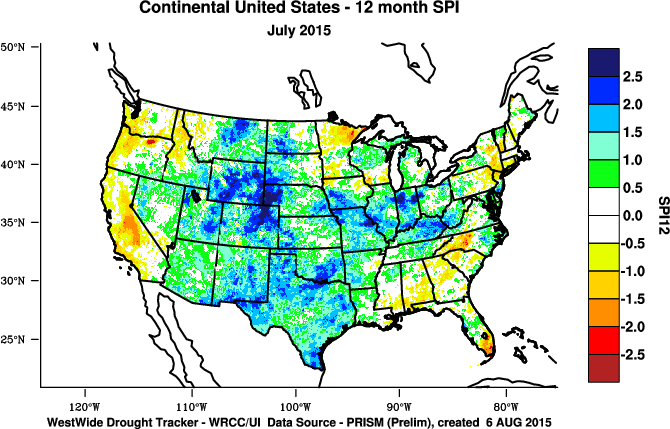
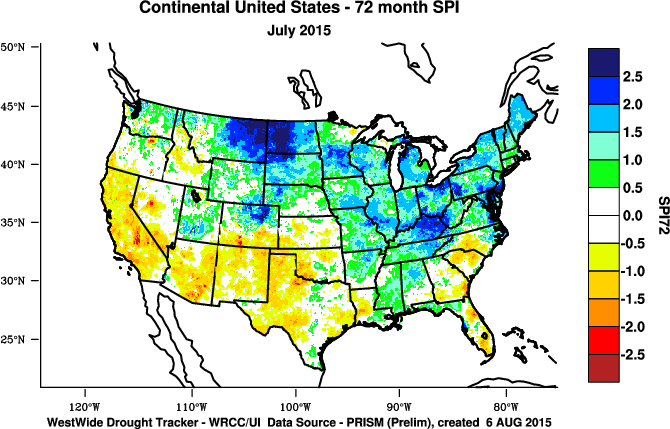
Standardized Precipitation Index
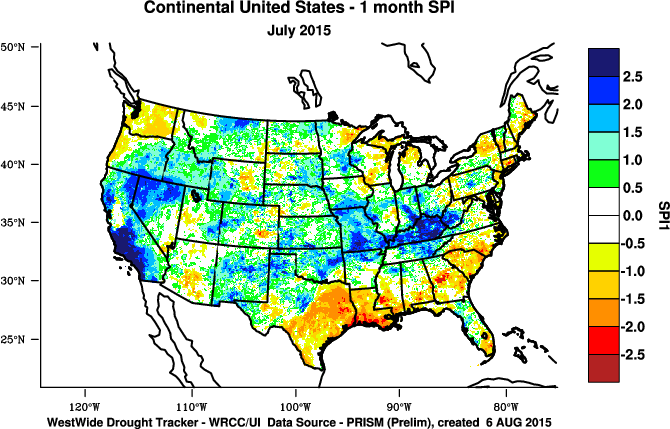
The Standardized Precipitation Index (SPI) measures moisture supply. The SPI maps here show the spatial extent of anomalously wet and dry areas at time scales ranging from 1 month to 24 months.
 |
 |
 |

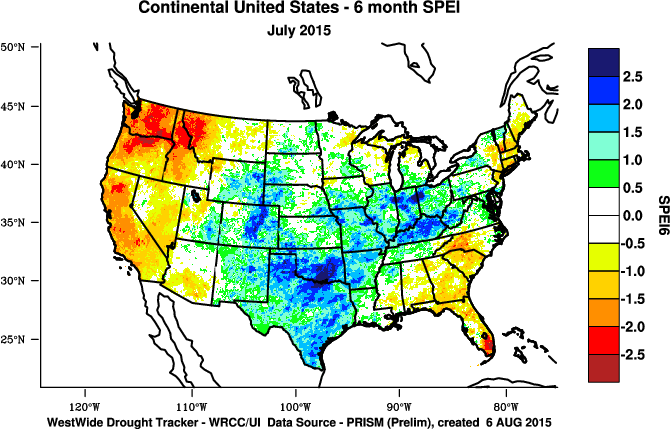
The SPI maps illustrate how moisture conditions have varied considerably through time and space over the last two years. Dryness in the Pacific Northwest is evident at all time scales, but is most severe at the 2- to 6-month time scales. Wet conditions are evident in California on the 1- to 3-month SPI maps, but May-July is part of the dry season, so above-normal precipitation at this time of year does not contribute much to California's hydrology. Dry conditions are evident for the state from the 6- to 24-month time scales. Wet conditions are evident for parts of the Southwest and Midwest to Ohio Valley at most time scales. Parts of the Southern Plains to Lower Mississippi Valley are dry at the 1- to 2-month time scales. But the extreme wetness at the end of winter and most of spring, especially in Texas and Oklahoma, give the Southern Plains a wet depiction on the 3- to 24-month SPI maps. Parts of the western Great Lakes have been dry at the 1- to 2-month, and 6- to 12-month time scales. Dryness is evident in parts of the Northeast at the 1- and 6- to 24-month time scales. Parts of the Southeast, especially in and around the Carolinas, are dry at all time scales, especially at the 1- and 3- to 6-month time scales.
 |
 |
 |
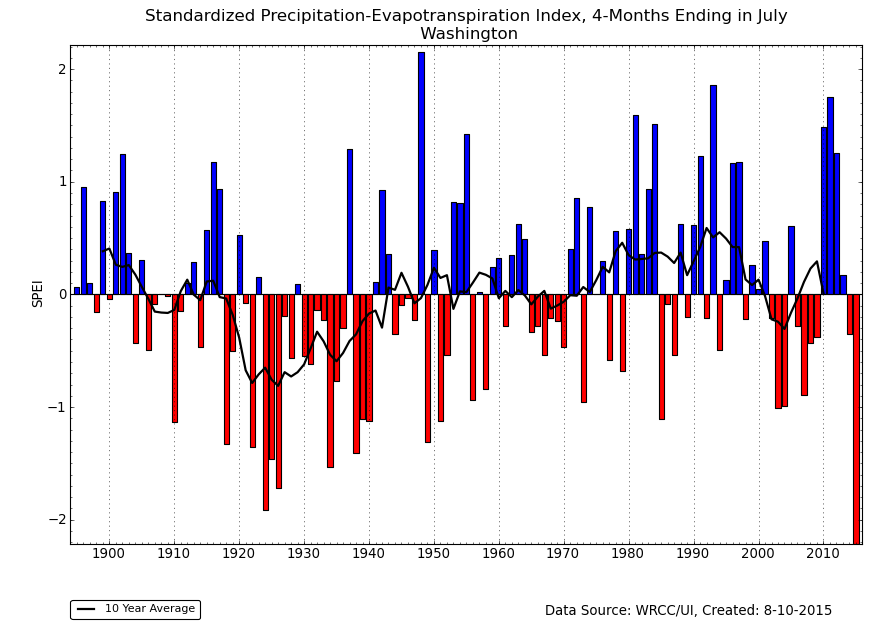
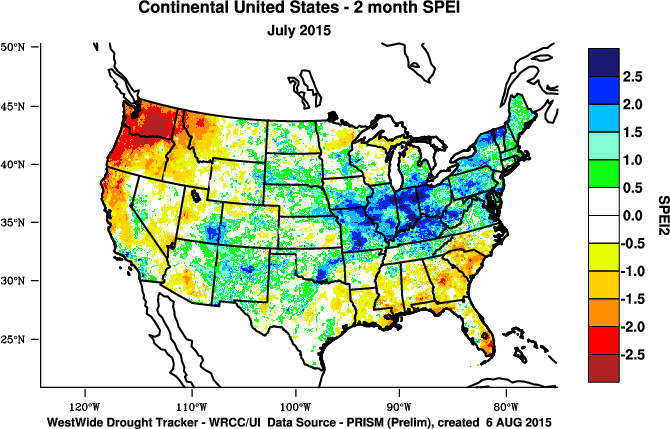
Standardized Precipitation Evapotranspiration Index
The SPI measures water supply (precipitation), while the SPEI (Standardized Precipitation Evapotranspiration Index) measures the combination of water supply (precipitation) and water demand (evapotranspiration as computed from temperature). Warmer temperatures tend to increase evapotranspiration, which generally makes droughts more intense.
 |
 |
During July 2015, temperatures were below normal across the Southwest to Central Rockies and from the Central Plains to Ohio Valley and southern Great Lakes, and much above normal in the Southeast to western Gulf of Mexico Coast, in much of the Pacific Northwest, and along the West Coast. The warmer-than-normal temperatures amplified the dry conditions in the Northwest and Lower Mississippi Valley when the 1-month SPEI is compared to the SPI. The combination of heat and dryness of the last several months has been so severe that Washington has had the most severe 2-, 3-, and 4-month SPEI in the 1895-2015 record.
 |
 |
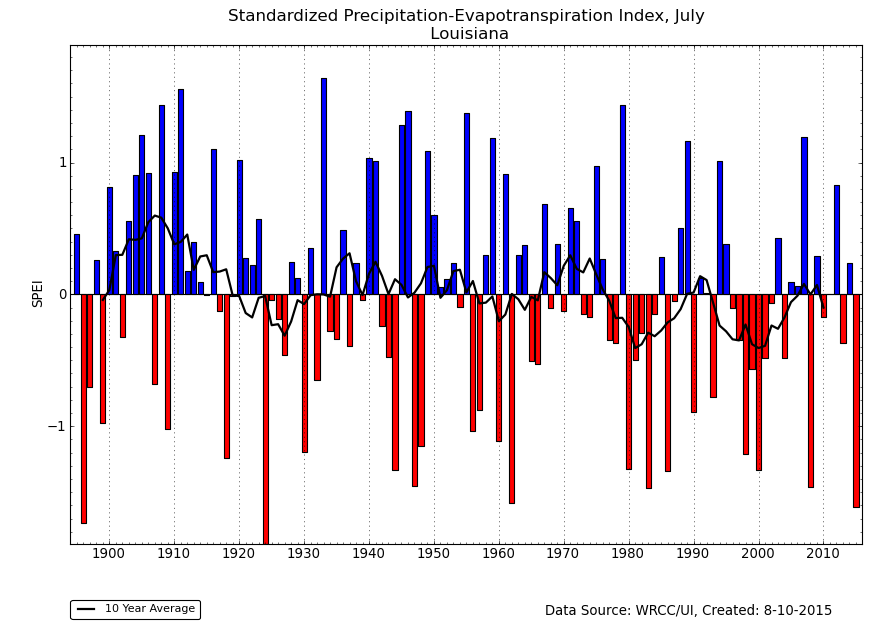
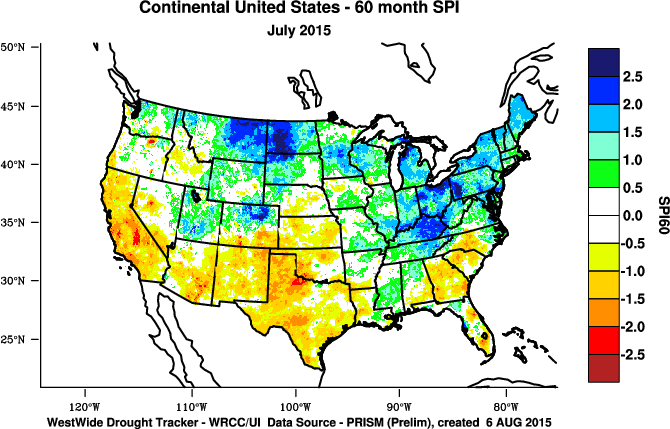
The combination of heat and dryness gave Louisiana the third most severe July SPEI on record. The heat and dryness spread into eastern Texas, but it was not enough to erase the extreme wetness of late winter through spring in the Lone Star State. In fact, the earlier 2015 wet conditions have been enough to neutralize the previous dryness in Texas and Oklahoma at the 24- to almost 48-month time scales. Only at the 60-month time scale is significant dryness still evident on the SPEI andSPI maps.

48-month SPEI for current month.
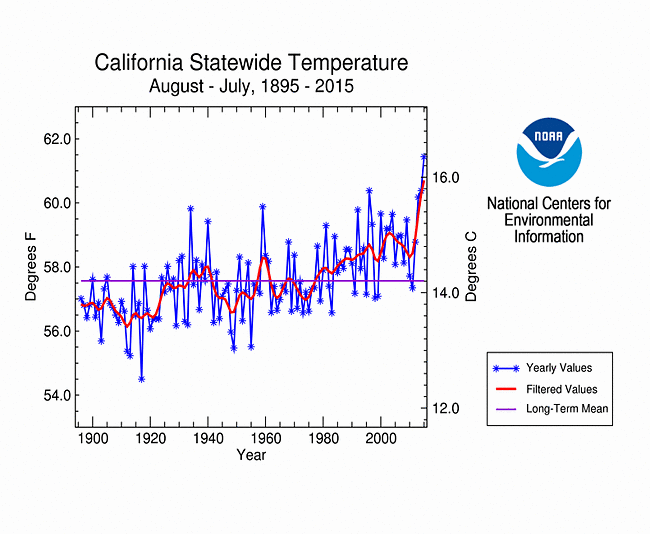
The last three years have been characterized by extreme heat in California and across much of the West. This has exacerbated drought conditions for the last 4 to 6 years, as seen when the SPEI (last 6, 12, 24, 36, 48, 60, and 72 months) is compared to the SPI (last 6, 12, 24, 36, 48, 60, and 72 months). California has been especially hit hard by drought, with the most severe 36-, 48-, 60-, and 72-month SPEI in the 1895-2015 record. The state's 24-month SPEI ranked second driest and 12-month SPEI ranked sixth driest on record for July. Even without the heat, the last 48 months have been the driest on record for California, according to the 48-month SPI. The 36-month SPI was second driest on record and 24-month SPI fourth driest on record for July.
 |
 |
Regional Discussion
 |
 |
CONUS Agricultural & Hydrological Impacts:
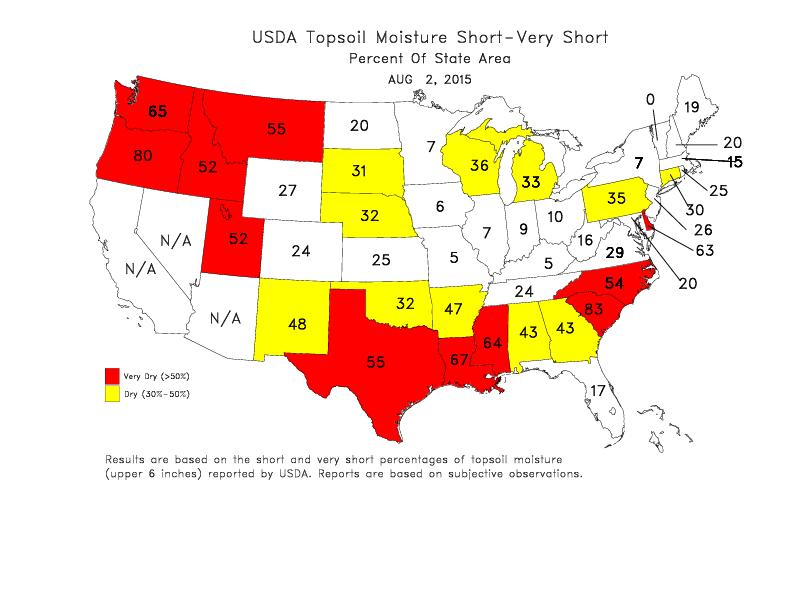
Drought conditions were reflected in numerous agricultural, hydrological, and other meteorological indicators, both observed and modeled. According to August 3rd U.S. Department of Agriculture (USDA) reports, only seven percent of the nation's spring wheat crop, nine percent of the corn crop, eleven percent of the soybean crop, and twelve percent of the pastures and rangeland were rated in poor to very poor condition. As of August 4th, 14 percent of the nation's hay, 16 percent of the cattle inventory, and 16 percent of the winter wheat production were in drought. But 30 percent of the nation's topsoil and 27 percent of the subsoil were short to very short of moisture (dry to very dry). And conditions varied considerably from state to state.
Drought conditions at the end of the month, as depicted on the August 4th USDM map, included the following drought and abnormally dry areas:
- Moderate (D1) to severe (D2) drought covered a large part of the western U.S., with extreme (D3) to exceptional (D4) drought extending from California and the Pacific Northwest into the Intermountain Basin. —
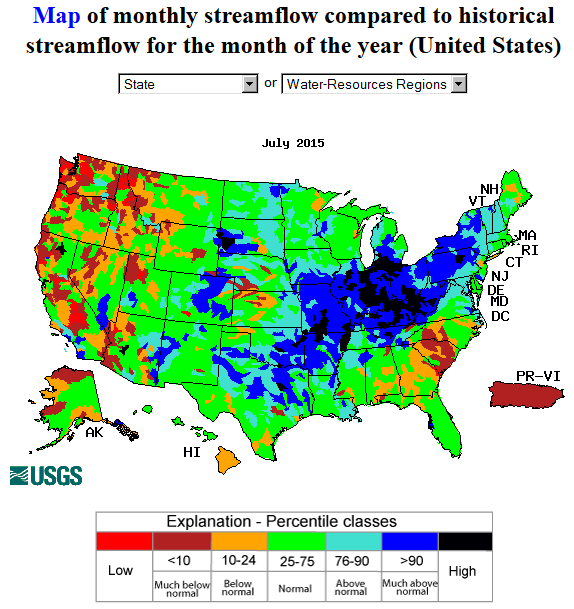
- The lack of a mountain snowpack to provide spring and summer meltwater has resulted in record to near-record low streamflow in the Cascades and coastal streams of Oregon and Washington, in the northern Rockies, and in northern and central California. Groundwater across the West is depleted. Rain fell in parts of the West, mainly the southern and interior portions, but parts of California and the Pacific Northwest had few rainy days with long runs of consecutive dry days. The rainfall improved soil moisture conditions in some areas, but soil moisture was severely depleted along the West Coast and into the Northern Rockies. The USDA estimated that 80 percent of the topsoil in California and Oregon, 65 percent in Washington, and over 50 percent in Idaho, Montana, and Utah was short or very short of moisture. Subsoil moisture conditions were just as dire with over 80 percent short or very short in California and Oregon, 60 percent or more in Nevada and Washington, and over 50 percent in Montana and Utah. Persistent hot temperatures, especially in the Northwest, increased evaporation (Evaporative Stress Index) which stressed vegetation and progressively worsened conditions for crops (Crop Moisture Index for weeks 1, 2, 3, 4, 5). August 3rd USDA reports indicated that 43 percent of the spring wheat and 45 percent of the pastures and rangeland in Washington, 49 percent of the pastures and rangeland in Oregon, and 55 percent of the pastures and rangeland in California were rated in poor to very poor condition, which are large increases compared to four weeks ago. The prolonged duration of the dryness over the last four years has severely depleted reservoirs in most western states, especially in Nevada, Oregon, and California. The drought contributed to the development of numerous large wildfires throughout the month.
- Moderate to severe drought expanded in the Southeast, with extreme drought developing in southern Florida. —
- By the end of the month, drought impacts were manifested by low streamflows, reduced groundwater, decreasing soil moisture conditions, and increasingly stressed vegetation. August 2nd USDA reports indicated that 83 percent of the topsoil and 90 percent of the subsoil in South Carolina, and 54 percent of the topsoil and 48 percent of the subsoil in North Carolina, were short or very short of moisture. The Crop Moisture Index became increasingly drier as the month progressed (weeks 1, 2, 3, 4, 5). By August 3rd, 41 percent of the pastures and rangeland in North Carolina, and 25 percent in South Carolina, were rated in poor to very poor condition.
- Abnormally dry conditions with moderate to severe drought redeveloped in parts of the Southern Plains and Lower Mississippi Valley. —
- These "flash drought" conditions developed from extremely dry and hot conditions. Virtually no rain fell in parts of eastern Texas, with long runs of consecutive dry days. Topsoil moisture quickly decreased, with the USDA estimating about two-thirds of the topsoil and more than half of the subsoil short or very short of moisture in Louisiana and Mississippi, and more than half of the topsoil short or very short in Texas, by August 2nd. The Crop Moisture Index reached excessively to severely dry levels by the end of the month, with 20 percent of the pastures and rangeland in Louisiana rated in poor to very poor condition by August 2nd. In western Texas, even though late winter and spring were excessively wet, some of the reservoirs were still well below average.
- Pockets of abnormally dry to moderate drought conditions remained in parts of the Northern and Central Plains and Northeast, and pockets of abnormally dry conditions expanded in the western Great Lakes. —
- Long-term precipitation deficits, especially in Wisconsin, Michigan, and the Arrowhead of Minnesota, were reflected in below-average soil moisture content. August 2nd USDA reports indicated a third or more of the topsoil, and a fifth or more of the subsoil, was short or very short of moisture in Michigan and Wisconsin.
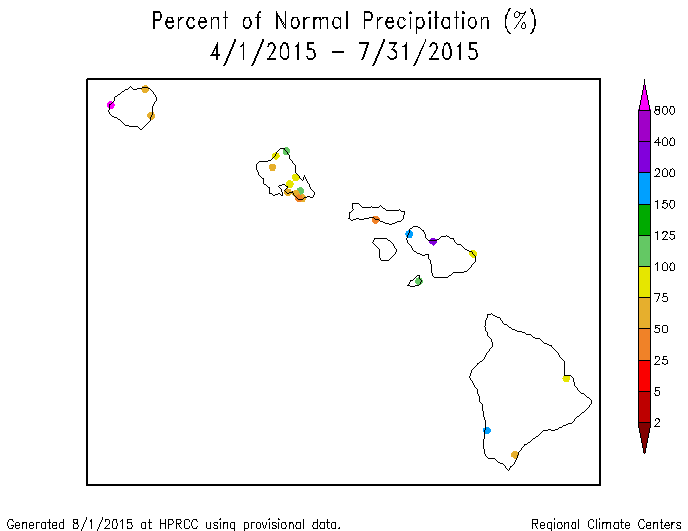
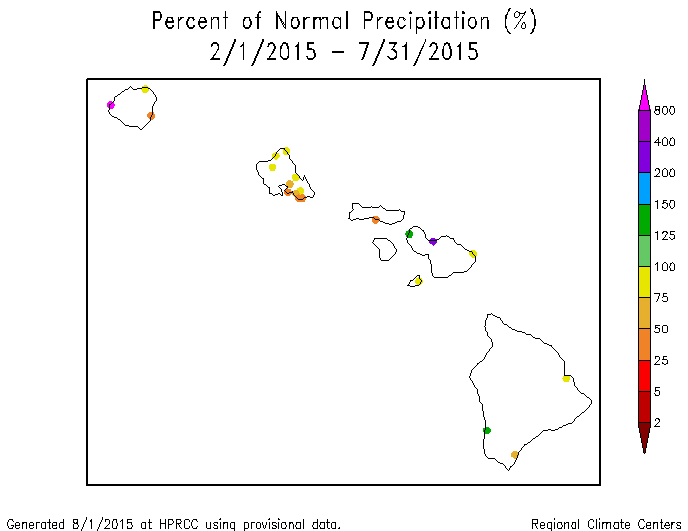
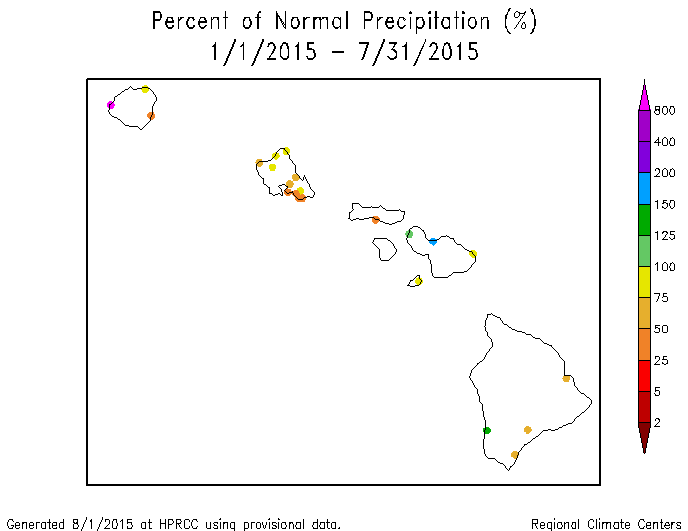
Hawaii: Hawaii had a mixed precipitation pattern for July 2015 and for much of the last three years (last 2, 3, 4, 6, 7, 10, 12, 24, and 36 months). But in general, below-normal precipitation has occurred over Oahu and most of The Big Island, while the rainfall pattern has been more mixed over the other islands, especially at the longer time scales. On the USDM map, moderate to severe drought stayed about the same as last month (25.5 percent of the state).
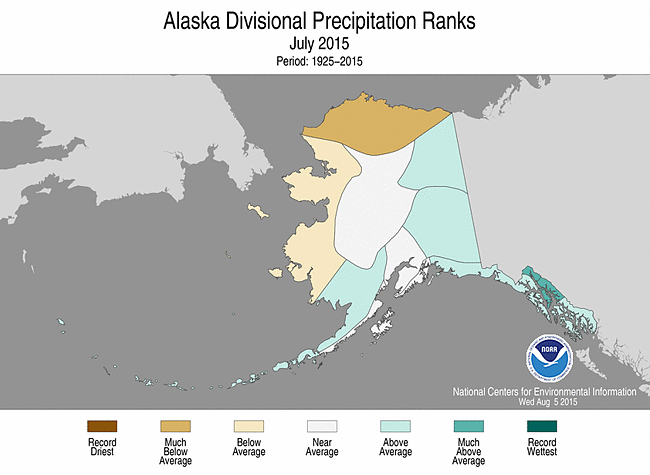
Alaska climate division precipitation ranks, July 2015.
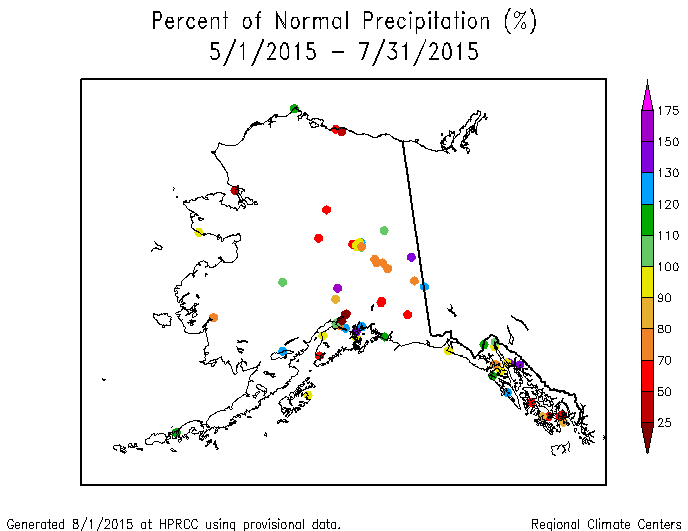
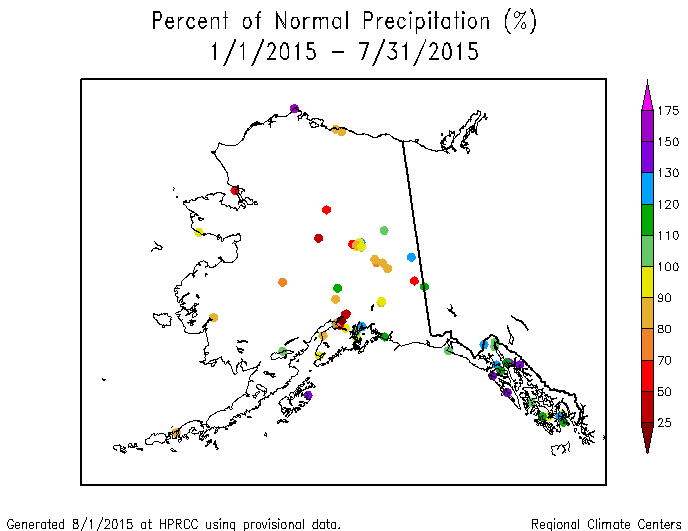
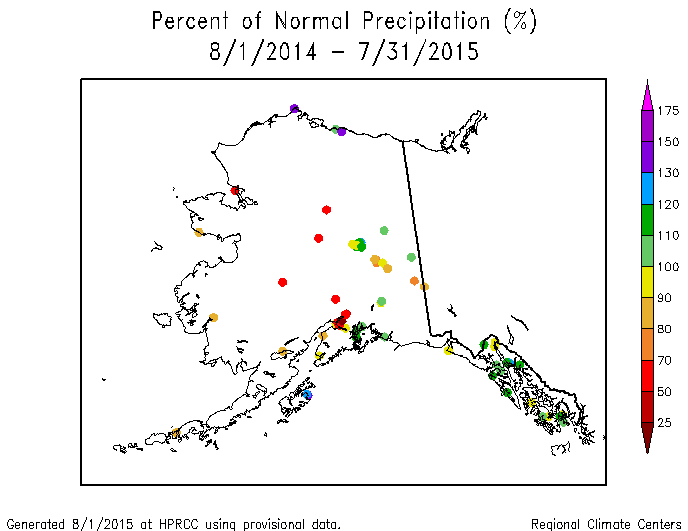
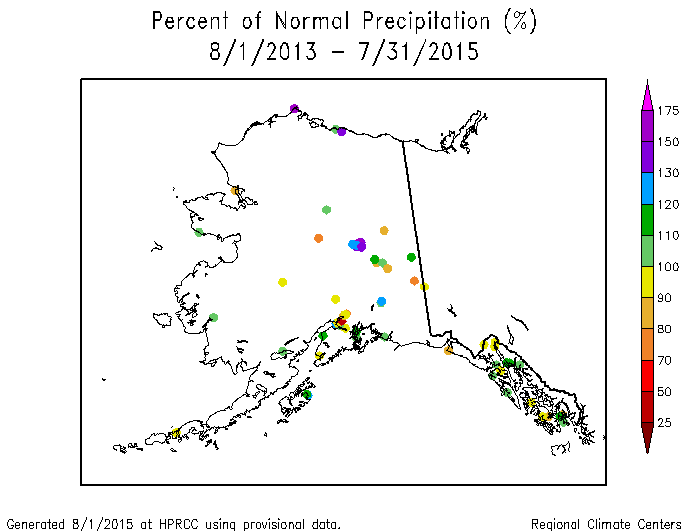
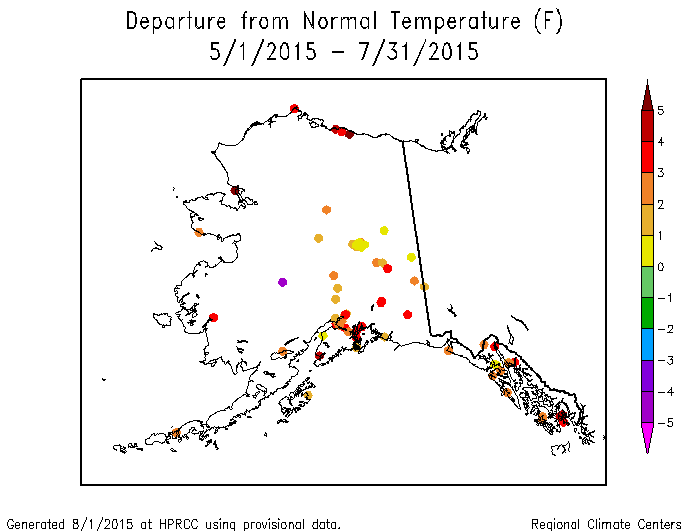
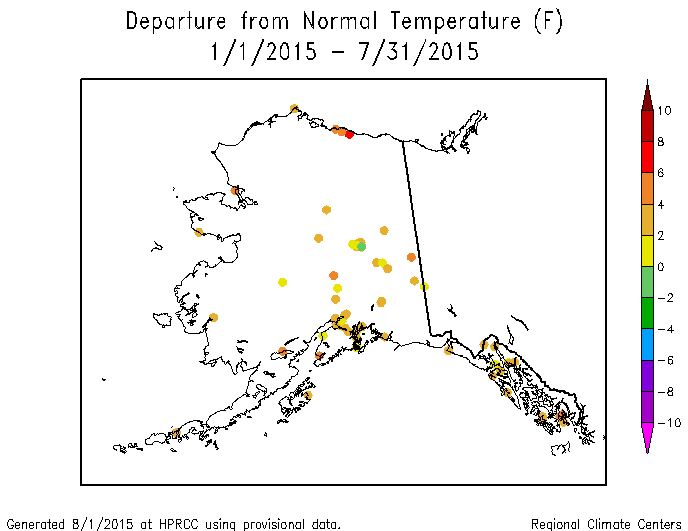
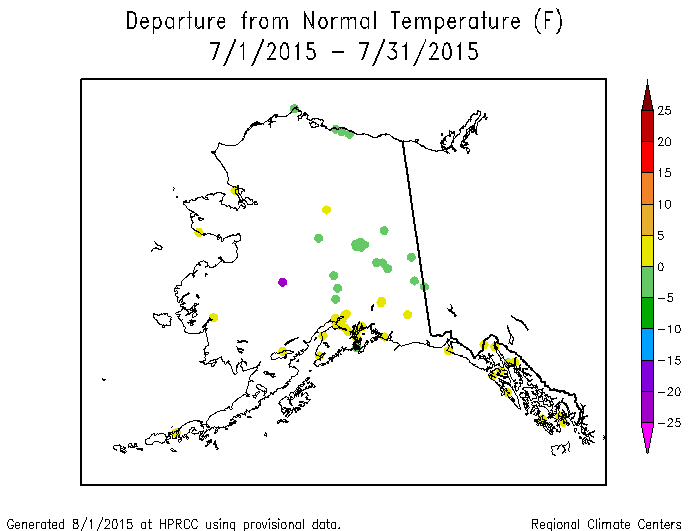
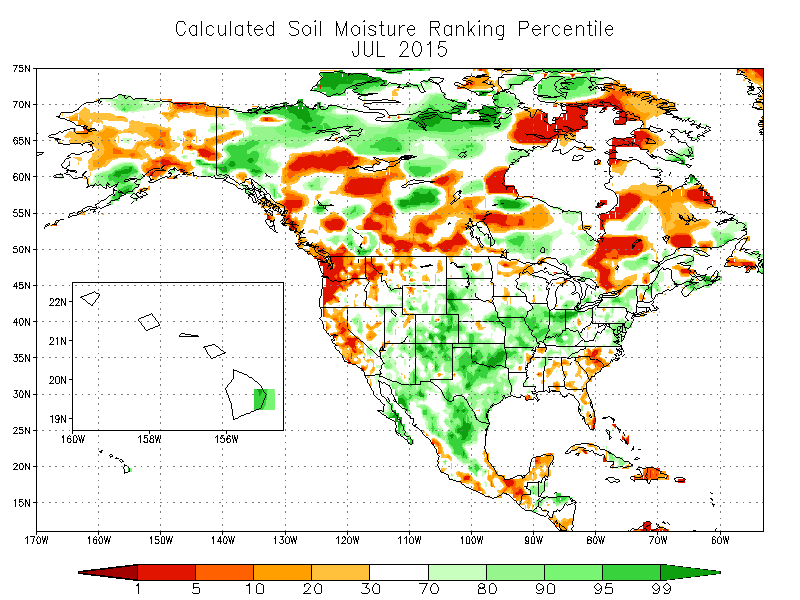
Alaska: July was generally drier than normal along the northern and western coasts of Alaska with a mixed precipitation pattern in the interior and south, both at the low elevation stations, the high elevation (SNOTEL) stations, and at the climate division level. The precipitation anomaly pattern was similar for the last two to three months, except the interior stations were slightly drier. At the four to six month time scale, the southern coastal stations were generally wetter than normal while the stations to the north were drier than normal. At the seven month to one year time scale, a pattern of dryness existed from the interior stations to the west and southwest coasts, with wetter-than-normal conditions along the northern and southeastern coasts and panhandle. The precipitation anomaly pattern is more mixed at the 2- to 3-year time scales. A persistent upper-level circulation pattern (ridge), which is responsible for the drier-than-normal conditions, also brought widespread and persistent above-normal temperatures for much of the last year (last 3, 7, 10, and 12 months). August 2014-July 2015 was the second warmest such 12-month period, statewide, in the 1925-2015 record. But a breakdown in the upper-level ridge in July brought areas of cooler- and wetter-than-normal weather. With the mountain snowpack essentially gone due to the above-normal temperatures, streamflow was significantly reduced in some areas, while July precipitation maintained the streamflow in other areas. The below-normal precipitation and above-normal temperatures helped to dry out the soils and vegetation, which set the stage for the development of numerous large wildfires (July 1, 10, 20, 29), especially in the interior regions. Moderate drought expanded to cover about a fifth (20.1 percent) of the state, with abnormal dryness and drought covering nearly three-fourths (71.1 percent), on the August 4th USDM map.
 |

|

San Juan, Puerto Rico, precipitation, April-July, 1956-2015.
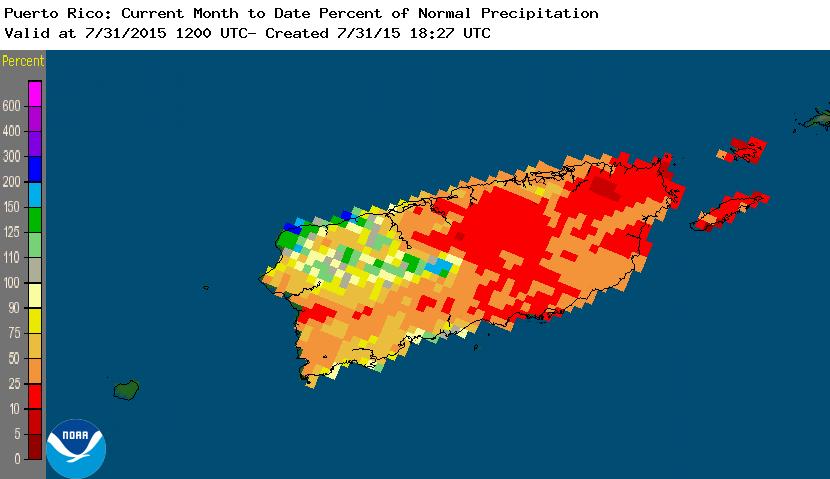
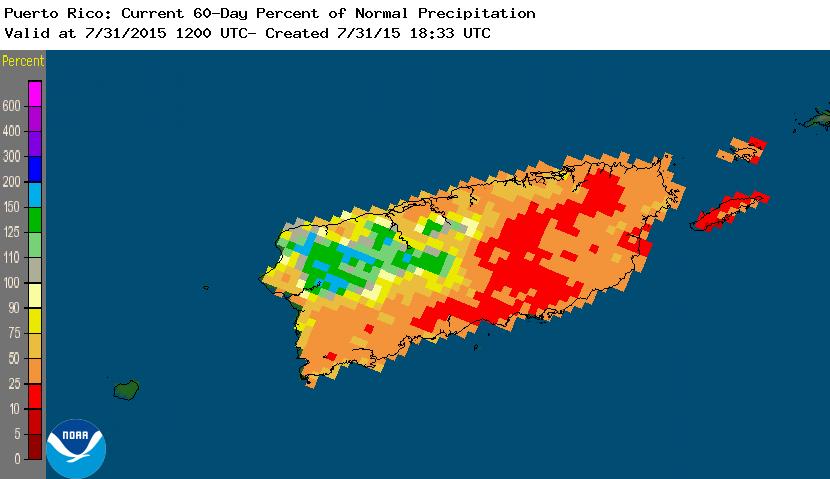
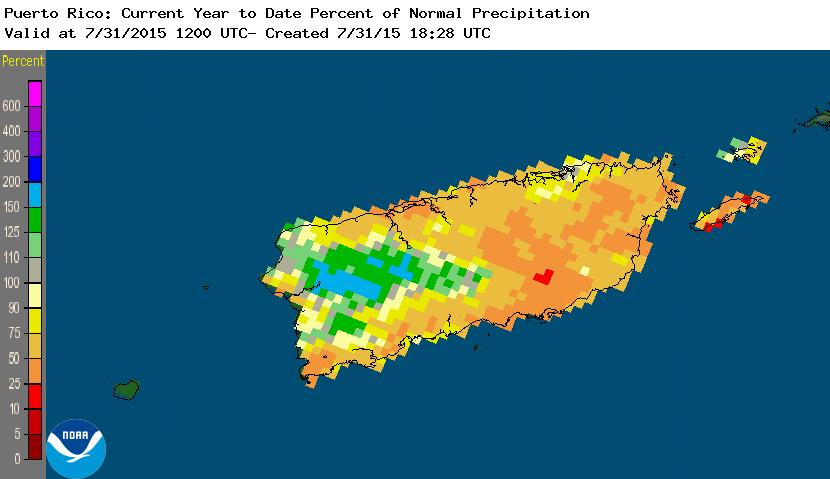
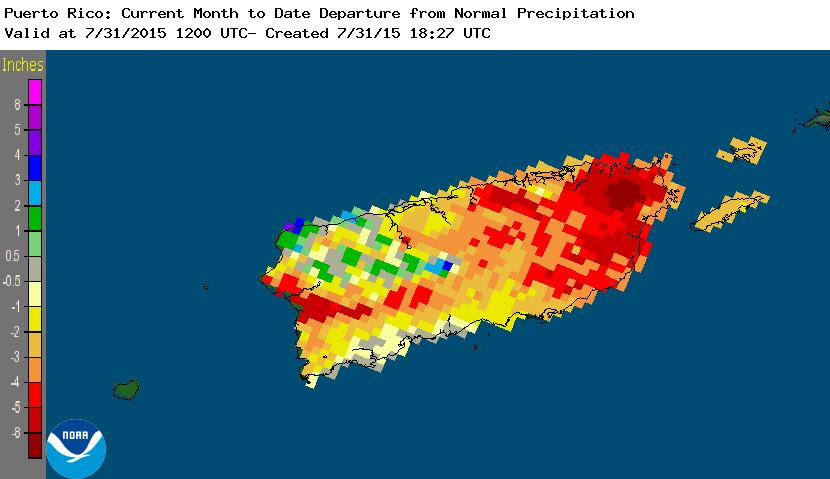
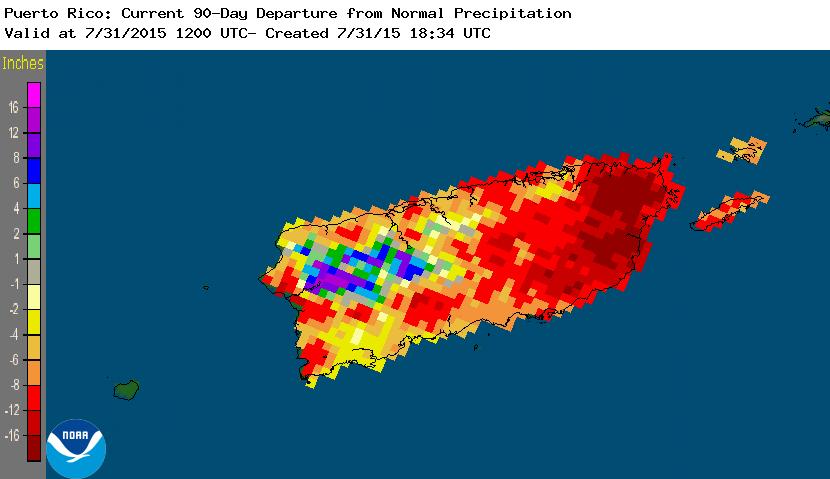
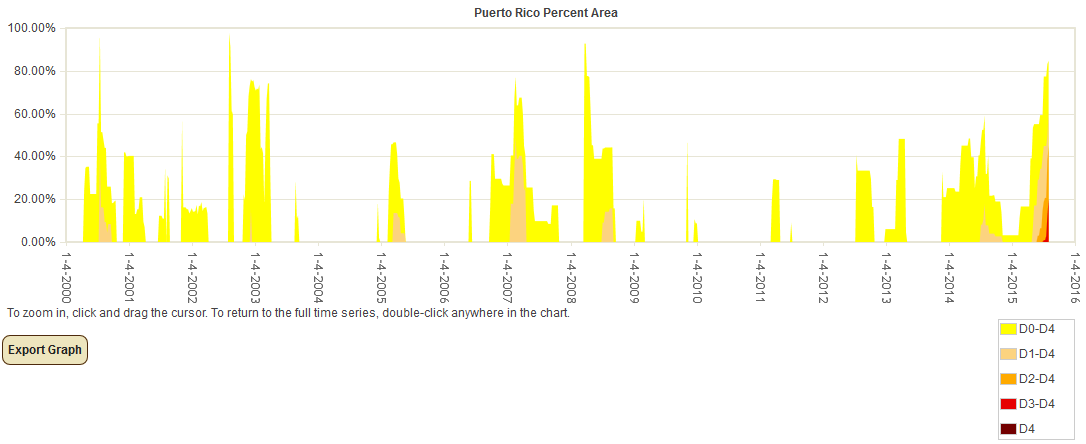
Puerto Rico: El Niño-enhanced dryness continued across the Caribbean during July 2015, with the eastern and southern portions of Puerto Rico experiencing very dry conditions. This pattern has dominated much of the last year (last 2, 3, 6, 7, 10 months). Only a few areas, mainly in the west, were wetter than normal. The dryness was reflected in low to record low streamflow in the streams on the eastern half of the island, as well as decreasing groundwater and reservoir levels and water rationing. Precipitation departures in parts of eastern Puerto Rico exceeded 4 inches in July, 12 inches in May-July, and 20 inches in places over the last six months. April-July 2015 was the driest such four-month period at the San Juan International Airport (based on data from 1956-2015) and Alex Hamilton Field weather station in St. Croix, Virgin Islands (out of 54 years of data), but the 20th driest April-July at the Truman Field weather station in St. Thomas, Virgin Islands (out of 48 years of data). On the August 4th USDM map, abnormal dryness and drought covered over four-fifths (84.7 percent) of Puerto Rico, with moderate to extreme drought expanding to nearly two-thirds (61.1 percent) of the island. This included 20.3 percent in the extreme drought category. This month marks the greatest extent of drought, and the first occurrence of extreme drought, in Puerto Rico in the 2000-2015 USDM historical record.
CONUS State Precipitation Ranks:
 |

|
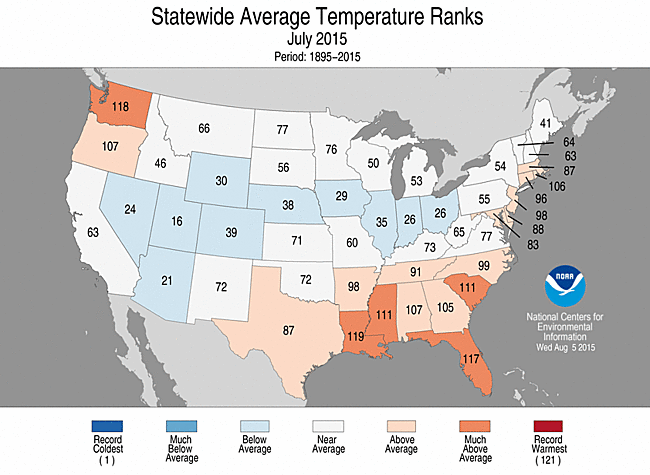
The July precipitation anomaly pattern of dryness in the Northwest, Southern Plains, Southeast, western Great Lakes, and New England was reflected in the state ranks, with seven states ranking in the driest third of the historical record. Spotty above-normal precipitation fell over parts of many states, which tempered their ranks. Louisiana was the only state to fall in the top ten driest category, with the ninth driest July in the 1895-2015 record.
 |

|
The last three months had dry conditions at two opposite corners of the country. In the Pacific Northwest, Washington had the fifth driest May-July on record, while in the Southeast, South Carolina ranked ninth driest. Four other states ranked in the driest third of the historical record.
 |

|
The precipitation patterns for the last six months (February-July 2015) and the year-to-date (January-July 2015) were similar, with dryness in the West, Southeast, and New England. The year-to-date was also dry in the Great Lakes region. Fourteen states ranked in the driest third of the historical record for February-July, including Connecticut which ranked sixth driest. Sixteen states ranked in the driest third of the historical record for January-July, including California at fifth driest, Connecticut at seventh driest, and Oregon at ninth driest.
Precipitation was more widespread over the 12-month period. Only four states ranked in the driest third of the historical record for August 2014-July 2015, with none in the top ten driest category.
|

|
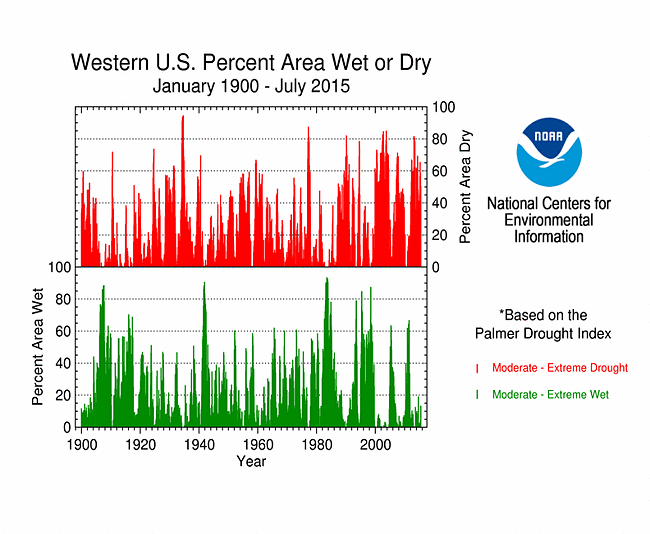
Percent area of the Western U.S. in moderate to extreme drought, January 1900 to present, based on the Palmer Drought Index.
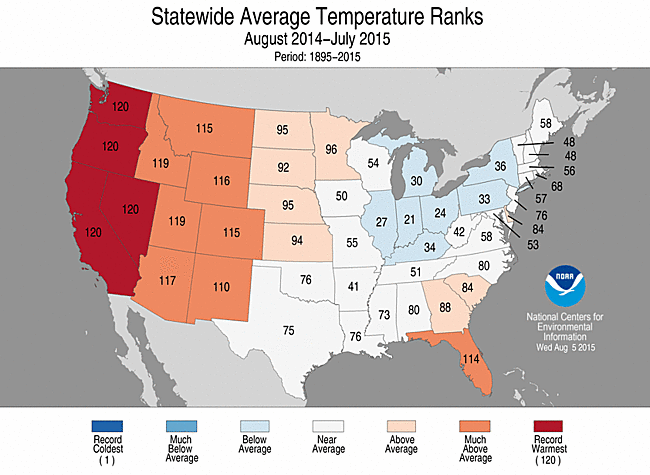
As noted above, dry weather has dominated the West for much of the last three to four years, resulting in significant hydrological (low lake, reservoir, and stream levels) and agricultural impacts. Recent precipitation has helped alleviate some of the short-term impacts, especially in the Southwest, but long-term drought impacts remain. According to the USDM, 60.1 percent of the West was experiencing moderate to exceptional drought at the end of July, which is about the same as the previous month. The Palmer Drought Index percent area statistic for the West was 50.3 percent, a decrease of about 7.9 percent compared to the previous month.
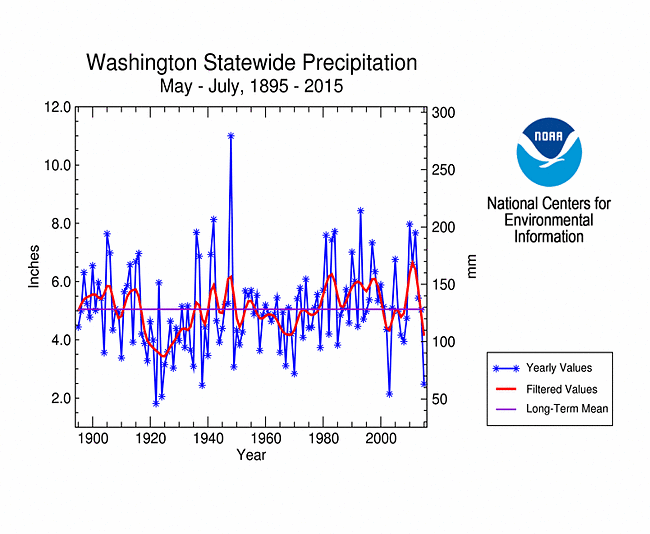
Except for an occasional interruption, the dryness has been accompanied by unusually and persistently hotter-than-normal weather. El Niño-enhanced tropical moisture and cloudiness from the eastern equatorial Pacific helped reduce temperatures over much of the West during July, but a persistent upper-level ridge maintained warmer-than-normal temperatures in the Northwest, with Washington having the fourth warmest July in the 1895-2015 record. Washington, as well as Oregon, had the warmest May-July. For the year-to-date, most of the western states ranked in the top ten warmest category, with Oregon and Washington again having the warmest January-July. For the last twelve months, Oregon and Washington, as well as California and Nevada, had the warmest August-July on record, and most of the rest of the western states ranked in the top ten warmest category.
 |
 |
March serves as the beginning of the growing season for the Primary Corn and Soybean agricultural belt. The region was generally wetter than normal this month, with July 2015 ranking as the seventh wettest and 45th coolest July in the 1895-2015 record, regionwide. The growing season to date ranked as the fourth wettest and 35th warmest March-July on record, regionwide.
NOAA Regional Climate Centers:
A more detailed drought discussion, provided by the NOAA Regional Climate Centers and others, can be found below.
West
As described by the High Plains Regional Climate Center, precipitation varied widely across the region with wetter weather occurring in western Wyoming, western Colorado, and pockets of Kansas, Nebraska, and South Dakota. Dryness occurred in eastern Colorado, southwestern and central Nebraska, eastern Wyoming, and pockets of Kansas and the Dakotas. Although average temperatures were near normal this month, there were plenty of hot and humid days. These conditions tended to facilitate crop development, but stress livestock. Corn development was generally ahead in the Dakotas, but behind in Nebraska and Kansas. Meanwhile, winter wheat and other small grain harvest was completed in southern areas and underway in northern areas.
Although not a major issue at this time, improvements in drought conditions continued this month for the High Plains region. According to the USDM, the total area in drought (D1-D4) in the region decreased from just over 1 percent to a little over a half a percent. Moderate drought (D1) was removed in northeastern Nebraska and eastern South Dakota, and only abnormally dry conditions remain. At this time, only northwestern Kansas and southwestern Wyoming have any D1 left. While most of the region had improvements, there are a couple of areas to monitor as abnormally dry conditions (D0) expanded in southern and central Nebraska as well as central Kansas. An area of D0 in the panhandle of Nebraska also developed. These areas have experienced a mix in both short and long term impacts with a combination of precipitation deficits and low streamflows. Although not in the High Plains region, it is important to monitor the drought conditions in Montana as the Missouri River is an important resource for the region and beyond. Areas of western Montana had degradations over the past month as extreme drought conditions (D3) developed there. At the end of July, over 35 percent of the state was in drought (D1-D4), with about 14 percent in the D3 category. With a strong El Niño likely this fall and winter, dry conditions may be in store for the headwaters of the Missouri River. These conditions should be monitored as the snow season progresses this upcoming winter and spring.
As explained by the Southern Regional Climate Center, July was a warmer than normal month across the entire Southern region. July precipitation varied spatially from north to south, with northern counties experiencing a very wet month and southern counties experiencing a much drier than normal month. Counties extending from western Texas and Oklahoma through northern Arkansas averaged between one and a half to two times of normal precipitation. Conditions were quite the opposite in Louisiana and eastern/southern Texas, where a majority of stations averaged between five and fifty percent of normal, with many stations not seeing a drop of rain all month.
Drier-than-expected conditions across eastern Texas and Louisiana led to the introduction of moderate drought. Much of this drought is located in the southern counties of Louisiana, and in northeastern Texas. In Texas, agricultural effects were incredibly varied. Wineries were negatively impacted from the previous month's excessive rainfall as the grapes began growing fungi. The increase in rain early on in the month caused grasshoppers to migrate to the Panhandle area where there was less rain, reducing pesticide use in other regions. Chigger populations meanwhile benefited from the excess rainfall. The beginning of the month brought hardships to the shellfish industry. The dry spell towards the end of the month meant the farmers were also able to better use their equipment without having to worry about them sticking in the mud. Cattle and most crops thrived during July. (Information provided by the Texas Office of State Climatology)
As summarized by the Midwest Regional Climate Center, temperatures were slightly above normal in the northern and southern edges of the Midwest and slightly below normal across the center of the region. Precipitation in July was heaviest across the southern half of the region along with parts of Minnesota and western Wisconsin; a few small areas in the northern states had totals less than 50 percent of normal. With plentiful rainfall in June and July, ponding water in fields led to crop conditions deteriorating in large swaths of the Midwest. Crop damages with projected monetary losses of over $740 million were estimated for Indiana alone. Canadian wildfires in late June and into early July resulted in smoke lingering in the Midwest sky early in the month. More red and orange-colored sunsets were noted where smoke was present in the Midwest.
As noted by the Southeast Regional Climate Center, mean temperatures in July were slightly above average across much of the Southeast region, while precipitation was highly variable. The driest locations were found across portions of central Georgia, far southern Florida, and the Carolinas, where monthly precipitation totals were between 10 and 50 percent of normal. Hickory, NC (1949-2015) observed its second driest July on record with only 0.92 inch (23 mm) of precipitation. As the driest reporting station in the Southeast for the month, Key West, FL (1871-2015) observed its seventh driest July on record with only 0.67 inch (17 mm) of precipitation. Precipitation was also well below normal for much of Puerto Rico and the U.S. Virgin Islands during July. Christiansted, VI (1951-2015) observed its second driest July on record with only 0.77 inch (20 mm) of precipitation, and San Juan, PR (1898-2015) observed its fourth driest July on record with only 1.61 inches (41 mm) of precipitation. The wettest locations were found across northwestern Alabama and the Gulf Coast of Florida.
Drought conditions continued to worsen across portions of the Southeast during July. The percentage of the region under drought-free conditions (less than D1) decreased slightly from approximately 85 percent on June 30th to 82 percent on July 28th. In Florida, a localized area of extreme (D3) drought developed over the coastal portions of Broward and Miami-Dade Counties for the first time since August 2011. A small area of severe (D2) drought emerged to the west of the Charlotte metropolitan area in western North Carolina. Moderate (D1) drought conditions expanded across central Georgia and South Carolina, covering nearly 25 and 50 percent of each state, respectively, by the end of the month. Unusual wetness delayed hay production and caused mildew to form in some pastures across areas of northeast Florida and Georgia. Minor armyworm infestations of hay fields were reported in portions of northern Alabama and west-central Florida due to heavy rainfall during the month. Persistent hot and dry conditions were particularly adverse for crop growth across the Carolinas, including soybeans, cotton, corn, and tobacco.
As explained by the Northeast Regional Climate Center, July wrapped up just on the cool side of normal in the Northeast, with precipitation just 89 percent of normal. At the beginning of July, parts of New York, New England, and southern West Virginia (totaling 21 percent of the Northeast) were experiencing abnormally dry or moderate drought conditions. Dryness eased in many areas during the month; however, areas of abnormal dryness and moderate drought lingered in New York and New England (totaling 9 percent of the region) through the end of July.
As summarized by the Western Regional Climate Center, July was much wetter than normal in much of California and the Great Basin. Scattered areas of the Southwest and Intermountain West also experienced above normal precipitation. Temperatures along the coast and in the Pacific Northwest were well above normal for July, while inland areas were slightly cooler than normal. Washington and western Oregon were particularly warm and dry, exacerbating drought conditions.
July is typically one of the driest months of the year in southern California. This time, however, over the period of July 18-20, the remnants of Hurricane Dolores combined with a low-pressure system to produce record rainfall in the region. July precipitation in the Great Basin and scattered areas of the Southwest was above normal as well, tied to a slow moving low-pressure system that helped to initiate thunderstorms across the region July 7-9th. A large area of western Colorado and Wyoming saw drought improvement this month along with small areas of Arizona, western New Mexico, northern Nevada, eastern California, and north-central Montana. The rains received in California, especially in the south, though beneficial and significant for the season, were relatively small in quantity and did little to alleviate severe and persistent drought conditions for the state as a whole.
July marks the third consecutive month of widespread above-normal temperatures in the Pacific Northwest. Drier than normal conditions accompanied the warm temperatures in the Pacific Northwest. Walla Walla, in southeast Washington and North Bend in western Oregon recorded 0.04 in (1 mm) and 0 in. rainfall this month. These locations typically receive around 0.5 in (13 mm) in July. The warm and dry conditions this month aided in expansion and intensification of drought conditions throughout Washington and in western Oregon.
Precipitation was variable across Alaska, with below normal values observed across the northern tier of the state and above normal values in the southeast. Juneau recorded 10.4 in (264 mm) for the month, 226% of normal and narrowly eclipsing the 1997 record wettest July in a 80 year record. Anchorage had its 3rd wettest July on record with 3.31 in (84 mm), including its wettest July day on record of 1.13 in (29 mm) on the 25th. Precipitation was generally below normal across Hawaii and temperatures above normal. Honolulu experienced its warmest July on record at an average 83.3 F (28.5 C), 2.1 F (1.2 C) above normal. Records for Honolulu began in 1940.
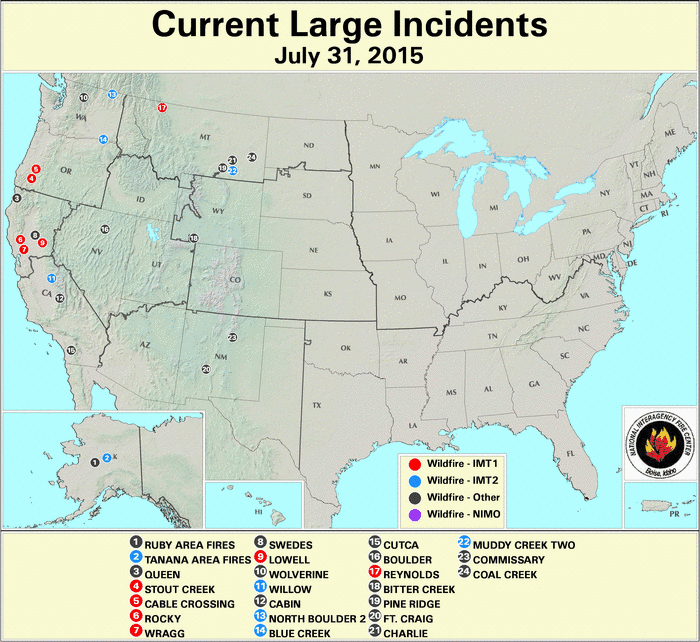
Significant wildfires burned in parts of the West. Over 700 wildfires in Alaska have burned nearly 5 million acres (2 million hectares) this summer. Approximately 300 of these fires have been human-caused, the rest by lightning. Late July rains helped to slow fire progress, though this season still has the potential to exceed the record set in 2004 of 6.59 million acres (2.6 million hectares) burned. More than a dozen large wildfires were burning in California at month's end. One of the largest is the Rocky Fire in Lake County, northern California. Washington has also had many large wildfires this month.
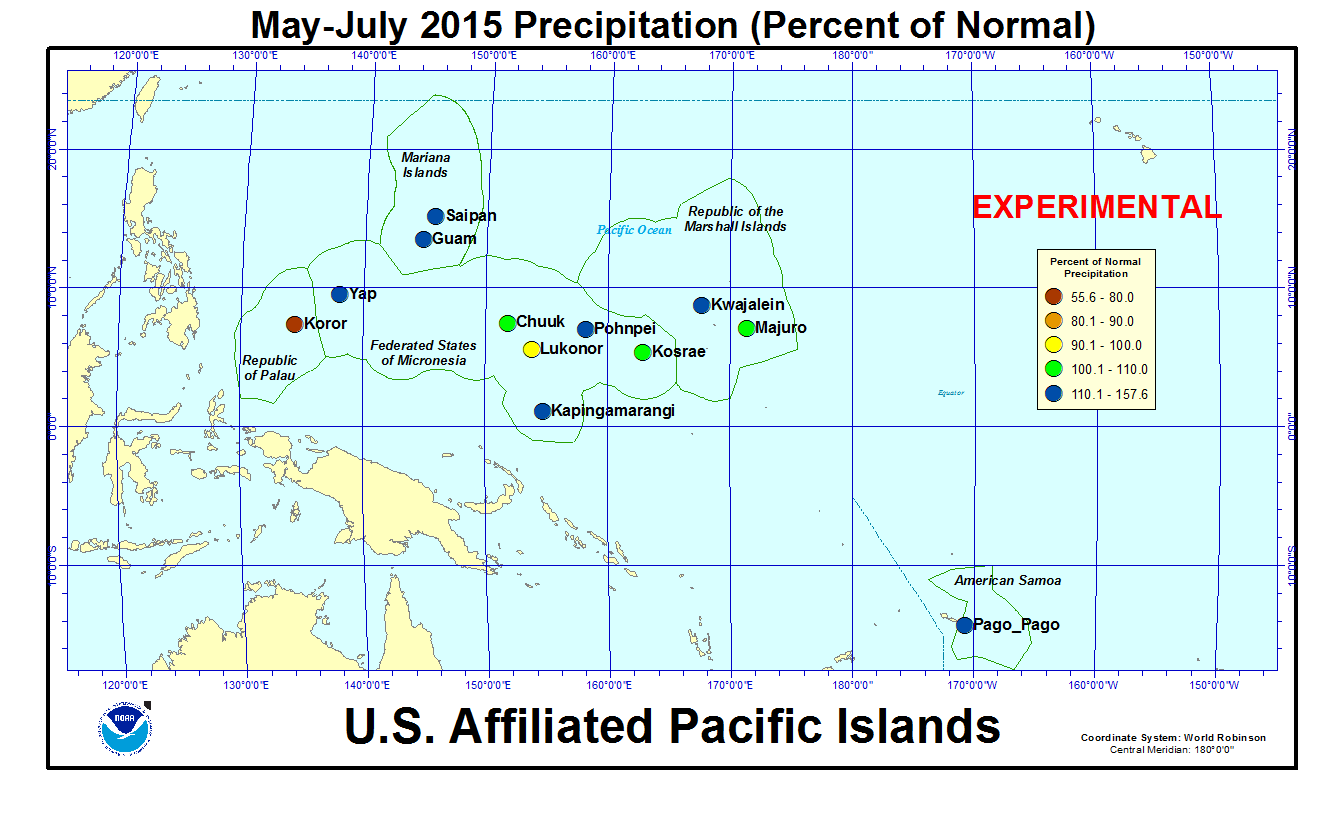
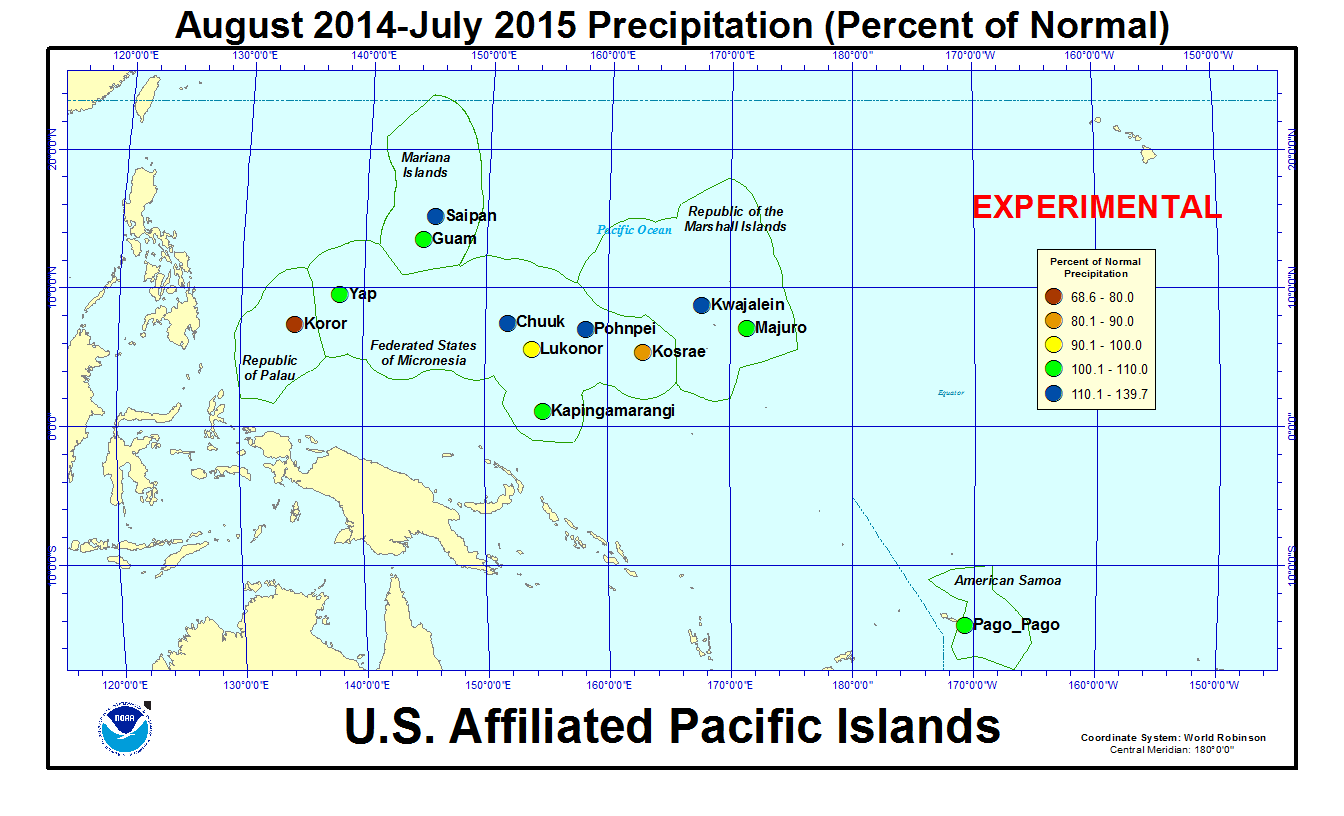
Pacific Islands: According to reports from National Weather Service offices, the Pacific ENSO Applications Climate Center (PEAC), and partners, conditions varied across the Pacific Islands.
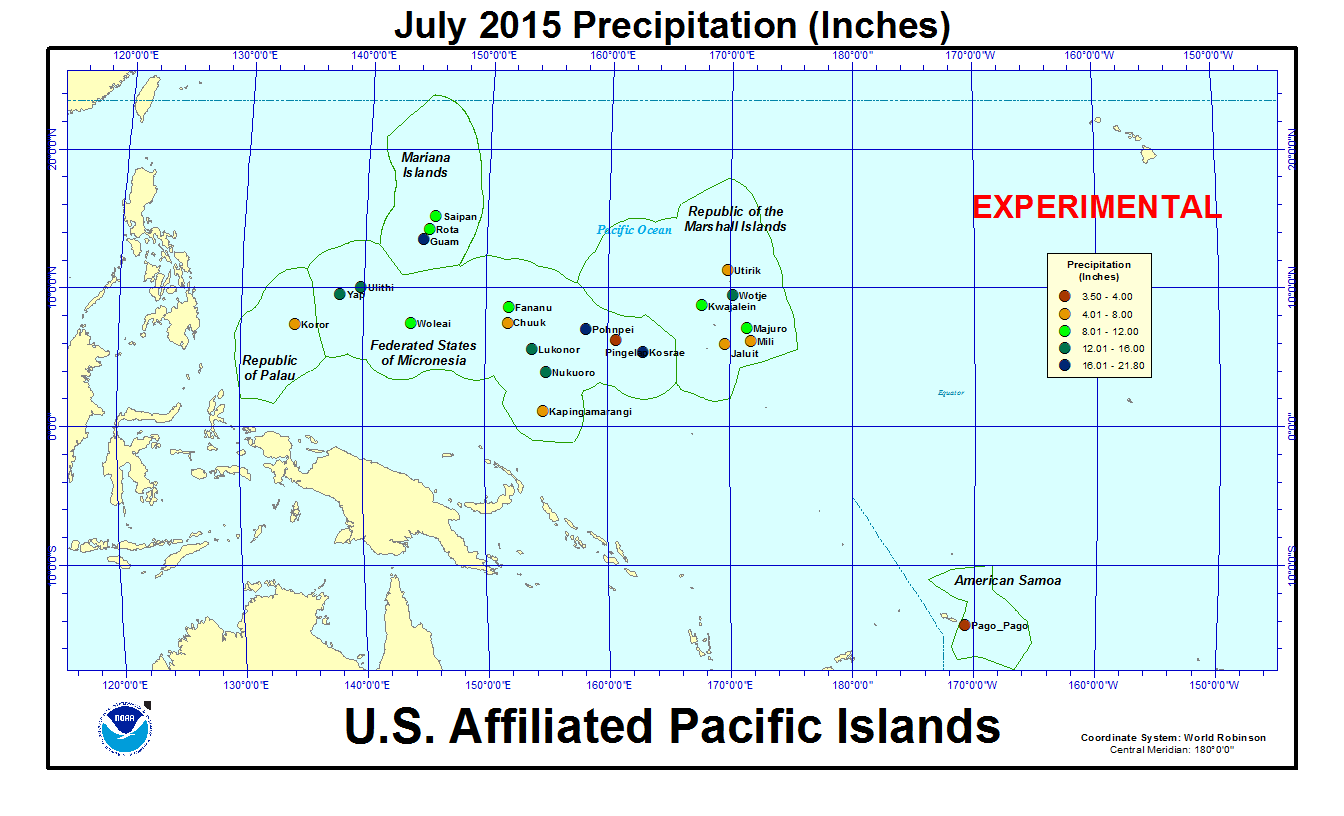
In the U.S. Affiliated Pacific Islands (maps — Micronesia, Marshall Islands, basinwide), July 2015 was drier than normal at Chuuk, Kapingamarangi, Koror, Lukonor, Majuro, Pago Pago, and Yap, and wetter than normal at the rest of the primary stations.
Rainfall amounts were below the minimum thresholds (4 or 8 inches) required to meet most monthly water needs at stations in Palau, the Marshall Islands, American Samoa, and central to eastern Micronesia. These included Koror, Chuuk, Pingelap, Jaluit, Mili, Utirik, and Pago Pago. Utirik received 5.17 inches of rain in July, marking the ninth out of the last ten months (since October) that have been drier than 8 inches. Koror received only 4.98 inches, marking the eighth out of the last ten months that have been drier than 8 inches. The 4- and 8-inch thresholds are important because, if monthly precipitation falls below the threshold, then drought becomes a concern.
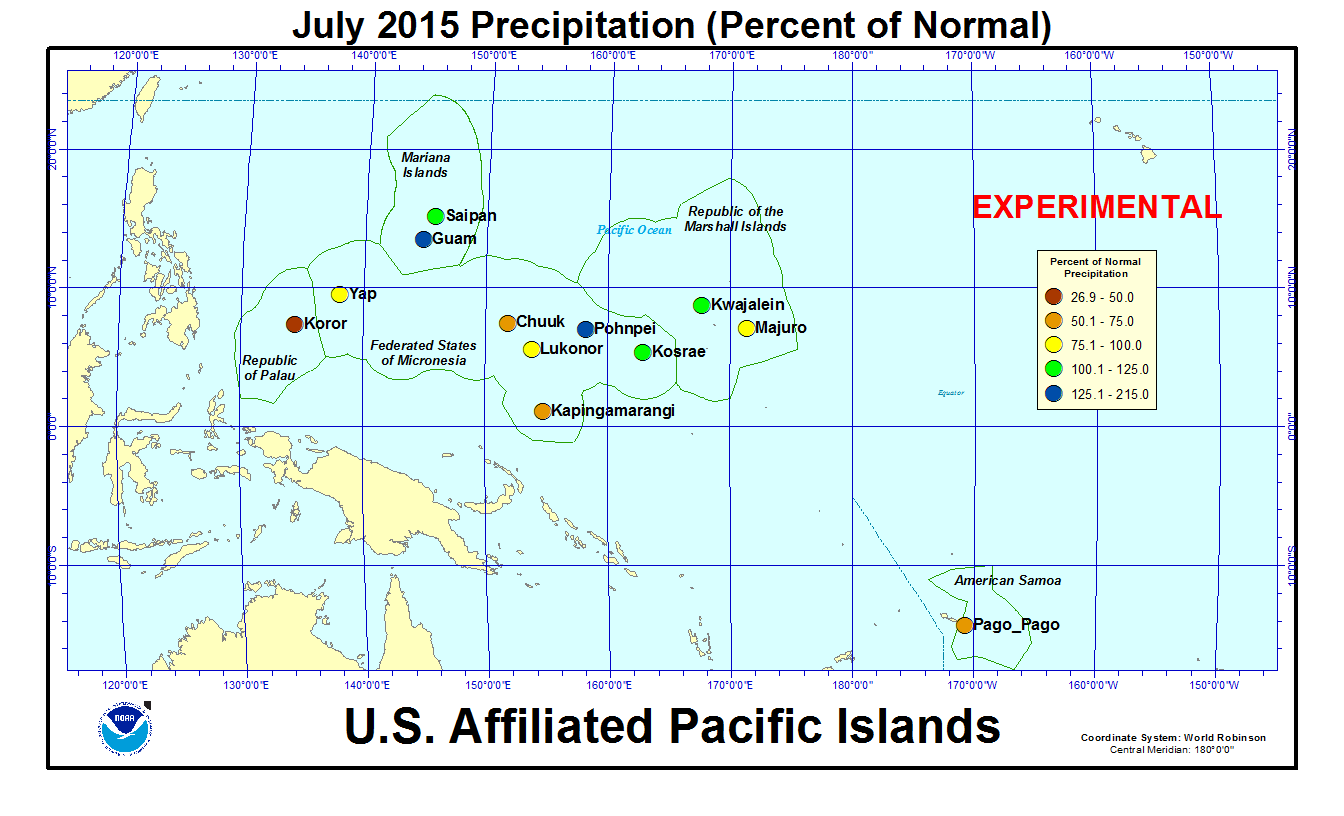
As measured by percent of normal precipitation, Guam, Kwajalein, Pohnpei, and Saipan were wetter than normal in both the short term (July and the last 3 months [May-July 2015]), the year to date [January-July 2015]), and the long term (12-month time scale, August 2014-July 2015). Chuuk, Kapingamarangi, Majuro, and Pago Pago were drier than normal for July but wetter than normal at the other time scales. Yap was drier than normal for July and the year-to-date, but wetter than normal at the other time scales. Kosrae was wetter than normal in the short term but drier than normal for the year-to-date and last 12 months. Lukonor was wetter than normal for the year-to-date but drier than normal for the other time scales. Koror was drier than normal at all of the time scales.
| Station Name | Aug 2014 | Sep 2014 | Oct 2014 | Nov 2014 | Dec 2014 | Jan 2015 | Feb 2015 | Mar 2015 | Apr 2015 | May 2015 | Jun 2015 | Jul 2015 | Aug- Jul |
|---|---|---|---|---|---|---|---|---|---|---|---|---|---|
| Chuuk | 121% | 166% | 120% | 66% | 57% | 142% | 134% | 209% | 104% | 89% | 172% | 54% | 112% |
| Guam NAS | 62% | 108% | 164% | 75% | 76% | 213% | 6% | 198% | 263% | 291% | 86% | 215% | 108% |
| Kapingamarangi | 96% | 109% | 130% | 140% | 116% | 229% | 131% | 62% | 87% | 173% | 161% | 54% | 107% |
| Koror | 77% | 137% | 63% | 54% | 118% | 64% | 83% | 69% | 74% | 33% | 107% | 27% | 69% |
| Kosrae | 59% | 77% | 114% | 68% | 86% | 116% | 114% | 91% | 92% | 84% | 143% | 108% | 80% |
| Kwajalein | 58% | 88% | 154% | 96% | 68% | 74% | 149% | 994% | 322% | 204% | 117% | 104% | 140% |
| Lukonor | 77% | 146% | 138% | 70% | 86% | 228% | 97% | 99% | 83% | 89% | 136% | 77% | 94% |
| Majuro | 82% | 134% | 88% | 66% | 67% | 106% | 63% | 329% | 162% | 171% | 57% | 87% | 108% |
| Pago Pago | 60% | 40% | 29% | 136% | 141% | 201% | 102% | 64% | 153% | 172% | 170% | 72% | 104% |
| Pohnpei | 74% | 128% | 100% | 108% | 104% | 78% | 100% | 138% | 119% | 219% | 108% | 138% | 118% |
| Saipan | 71% | 191% | 105% | 265% | 47% | 184% | 14% | 315% | 203% | 341% | 115% | 112% | 135% |
| Yap | 65% | 125% | 77% | 84% | 197% | 92% | 89% | 93% | 139% | 235% | 92% | 82% | 103% |
| Station Name | Aug 2014 | Sep 2014 | Oct 2014 | Nov 2014 | Dec 2014 | Jan 2015 | Feb 2015 | Mar 2015 | Apr 2015 | May 2015 | Jun 2015 | Jul 2015 | Aug- Jul |
|---|---|---|---|---|---|---|---|---|---|---|---|---|---|
| Chuuk | 15.55" | 19.44" | 13.78" | 6.99" | 6.46" | 14.32" | 9.68" | 17.37" | 13.03" | 10.08" | 20.03" | 6.45" | 153.18" |
| Guam NAS | 9.08" | 13.66" | 18.77" | 5.51" | 3.87" | 8.56" | 0.18" | 4.09" | 6.65" | 9.91" | 5.32" | 21.80" | 107.4" |
| Kapingamarangi | 7.84" | 10.86" | 10.64" | 13.02" | 11.37" | 20.91" | 12.19" | 7.05" | 11.82" | 20.84" | 22.14" | 7.71" | 156.39" |
| Koror | 10.40" | 16.10" | 7.45" | 6.12" | 13.14" | 6.48" | 7.07" | 5.11" | 5.42" | 3.96" | 18.66" | 4.98" | 104.89" |
| Kosrae | 8.32" | 11.00" | 12.51" | 9.38" | 13.80" | 19.28" | 14.73" | 14.57" | 16.12" | 14.89" | 20.90" | 16.17" | 171.67" |
| Kwajalein | 5.61" | 9.49" | 17.17" | 10.80" | 4.54" | 2.33" | 3.94" | 23.37" | 16.94" | 13.69" | 8.12" | 10.28" | 126.28" |
| Lukonor | 10.80" | 14.79" | 15.57" | 6.37" | 9.65" | 19.16" | 8.70" | 9.16" | 9.36" | 10.36" | 15.83" | 12.22" | 141.97" |
| Majuro | 9.64" | 14.93" | 11.14" | 8.85" | 7.68" | 8.24" | 4.32" | 21.65" | 15.23" | 17.27" | 6.31" | 9.72" | 134.98" |
| Pago Pago | 3.22" | 2.60" | 2.68" | 13.76" | 18.13" | 26.87" | 12.22" | 6.88" | 14.35" | 16.59" | 9.07" | 3.99" | 130.36" |
| Pohnpei | 10.52" | 16.06" | 15.32" | 15.97" | 16.67" | 10.24" | 9.58" | 18.14" | 21.94" | 43.68" | 16.03" | 21.31" | 215.46" |
| Saipan | 9.33" | 19.31" | 11.15" | 14.87" | 1.80" | 4.66" | 0.35" | 5.95" | 5.34" | 8.11" | 4.15" | 10.00" | 95.02" |
| Yap | 9.58" | 16.89" | 9.34" | 7.40" | 16.77" | 5.86" | 4.60" | 4.22" | 7.80" | 18.41" | 11.07" | 12.39" | 124.33" |
| Station Name | Aug 2014 | Sep 2014 | Oct 2014 | Nov 2014 | Dec 2014 | Jan 2015 | Feb 2015 | Mar 2015 | Apr 2015 | May 2015 | Jun 2015 | Jul 2015 | Aug- Jul |
|---|---|---|---|---|---|---|---|---|---|---|---|---|---|
| Chuuk | 12.86" | 11.71" | 11.51" | 10.61" | 11.25" | 10.10" | 7.25" | 8.32" | 12.47" | 11.30" | 11.66" | 11.98" | 136.77" |
| Guam NAS | 14.74" | 12.66" | 11.44" | 7.38" | 5.11" | 4.01" | 3.03" | 2.07" | 2.53" | 3.40" | 6.18" | 10.14" | 99.09" |
| Kapingamarangi | 8.13" | 9.93" | 8.19" | 9.27" | 9.84" | 9.15" | 9.27" | 11.43" | 13.64" | 12.08" | 13.78" | 14.15" | 145.85" |
| Koror | 13.50" | 11.77" | 11.84" | 11.39" | 11.16" | 10.18" | 8.56" | 7.44" | 7.32" | 11.83" | 17.48" | 18.53" | 152.90" |
| Kosrae | 14.22" | 14.22" | 10.94" | 13.83" | 16.11" | 16.67" | 12.93" | 16.06" | 17.51" | 17.75" | 14.64" | 14.91" | 213.87" |
| Kwajalein | 9.74" | 10.74" | 11.18" | 11.28" | 6.66" | 3.16" | 2.64" | 2.35" | 5.26" | 6.72" | 6.93" | 9.87" | 90.41" |
| Lukonor | 14.04" | 10.15" | 11.32" | 9.08" | 11.27" | 8.41" | 8.93" | 9.26" | 11.31" | 11.69" | 11.65" | 15.93" | 151.36" |
| Majuro | 11.69" | 11.17" | 12.73" | 13.44" | 11.39" | 7.74" | 6.88" | 6.58" | 9.42" | 10.11" | 11.01" | 11.17" | 125.25" |
| Pago Pago | 5.38" | 6.53" | 9.26" | 10.14" | 12.84" | 13.34" | 12.00" | 10.68" | 9.39" | 9.66" | 5.33" | 5.55" | 125.57" |
| Pohnpei | 14.26" | 12.55" | 15.27" | 14.83" | 16.08" | 13.18" | 9.55" | 13.17" | 18.41" | 19.96" | 14.81" | 15.43" | 182.36" |
| Saipan | 13.13" | 10.09" | 10.62" | 5.61" | 3.85" | 2.53" | 2.59" | 1.89" | 2.63" | 2.38" | 3.62" | 8.91" | 70.25" |
| Yap | 14.82" | 13.50" | 12.18" | 8.83" | 8.51" | 6.39" | 5.19" | 4.56" | 5.63" | 7.85" | 12.04" | 15.08" | 120.31" |

[top]
State/Regional/National Moisture Status
A detailed review of drought and moisture conditions is available for all contiguous U.S. states, the nine standard regions, and the nation (contiguous U.S.):
| northeast u. s. | east north central u. s. | central u. s. |
| southeast u. s. | west north central u. s. | south u. s. |
| southwest u. s. | northwest u. s. | west u. s. |
| Contiguous United States |
[top]
Contacts & Questions