|
Contents Of This Report: |

|
National Drought Overview
|
|
[top]
Detailed Drought Discussion
Overview
April 2012 was another warmer-than-average, but drier-than-average, month (3rd warmest on record and 41st driest, based on data back to 1895) when weather conditions are averaged across the country. Warm anomalies dominated at the monthly level, but migratory cold fronts brought regional cool anomalies at the weekly level (weeks 1, 2, 3, 4). The pattern for precipitation was variable, both on a monthly basis as well as a weekly basis (weeks 1, 2, 3, 4), although persistent dryness did occur over parts of the Midwest. Beneficial rainfall shrank drought in parts of the Upper Mississippi Valley, but continued dryness expanded the drought area in the Northeast, Southeast, and Hawaii. Nationally, the moderate-to-exceptional (D1-D4) drought footprint increased to about 32 percent of the country while the percentage in the abnormally dry category stayed roughly the same at about 50 percent.
The U.S. Drought Monitor drought map valid May 1, 2012.
By the end of the month, the core drought areas in the U.S. included:
- a large area of moderate (D1) to exceptional (D4) drought in the Southern Plains (mostly western Texas) spreading into the Southwest (mostly New Mexico);
- moderate to extreme (D3) drought stretching from the Southwest to the West Coast and into the Pacific Northwest;
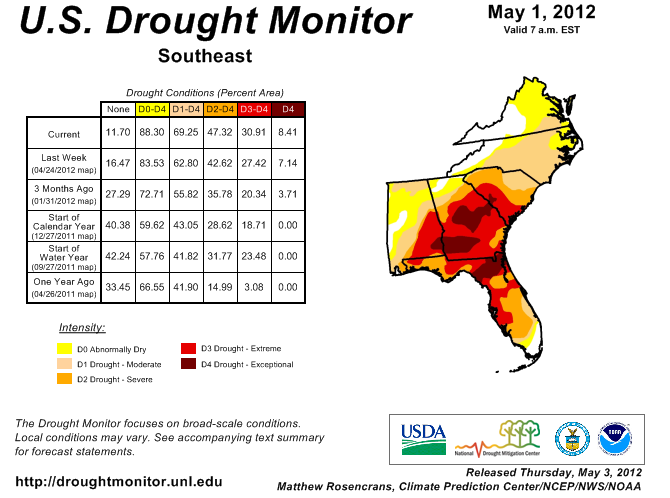
- moderate to exceptional drought in the Southeast, extending into the Mid-Atlantic states;
- expanding moderate to severe (D2) drought stretching from the Mid-Atlantic states into the Northeast, but limited to mainly along the coast;
- areas of moderate to severe drought in the Upper Midwest to Northern Plains; and
- parts of Hawaii, where moderate to extreme drought persisted.
Palmer Drought Index
The Palmer drought indices measure the balance between moisture demand (evapotranspiration driven by temperature) and moisture supply (precipitation). The Palmer Z Index depicts moisture conditions for the current month, while the Palmer Hydrological Drought Index (PHDI) and Palmer Drought Severity Index (PDSI) depict the current month's cumulative moisture conditions integrated over the last several months.
|
 |
As seen on the April 2012 Palmer Z Index map, low precipitation and warm temperatures (with the accompanying increased evapotranspiration) led to short-term drought across much of the Southwest and Intermountain Basin to Central Rockies, the Southern Plains and Southeast to Mid-Mississippi Valley, and Midwest to Northeast this month. Wet conditions are evident on the Z Index map across much of the Northwest and parts of the Central to Northern Plains. Compared with the March 2012 PHDI map, the April 2012 PHDI map indicates that drought conditions improved in the Northwest but intensified in the Southwest, Southeast, Upper Midwest, and Central Rockies, and expanded along the Northeast Coast and in parts of the Ohio Valley. The April 2012 PHDI map also reflects the long-term nature of the drought conditions. The Z Index and PHDI maps in combination show that precipitation brought relief to parts of the Northwest drought areas, and moisture conditions further declined across the Northeast and Ohio Valley; but for much of the Southeast, Southwest, Central Rockies, and Intermountain Basin — it was drier than normal over the existing drought areas.
Standardized Precipitation Index
The Standardized Precipitation Index (SPI) measures moisture supply. The SPI maps here show the spatial extent of anomalously wet and dry areas at time scales ranging from 1 month to 24 months.
 |
 |
 |
Recent precipitation (March-April) has countered dryness earlier in the season (November-December), resulting in the Pacific Northwest having wet SPI values at 1, 2, 3, and 24 months, but essentially neutral at the 6 to 12 month time scales. The Four Corners states to Central Rockies are dry at 1 to 3 months, with the rest of the West (California and Nevada) generally wet at 1 to 2 months. The California-Nevada area transitions to dry at 3 to 12 months, while the Central Rockies dryness continues out to 12 months. In the western Great Lakes, a core of dryness is evident at 1 to 3 months, but is larger at 6 to 12 months, extending into the Northern Plains at 9 months. Dryness is evident from the Lower Great Lakes to Mid-Mississippi Valley at 1 to 3 months, but disappears at longer time scales. Dryness can be seen in the Southern Plains and adjoining Southwest at 1 month and 12-24 months, with wetness dominating in the Southern Plains at the intervening time scales. The Northeast is dry at 2-6 months but wet from 9 to 24 months, while the Southeast is generally dry at all time scales.
 |
 |
 |
Agricultural and Hydrological Indices and Impacts
 |
 |
Drought conditions were reflected in numerous agricultural, hydrological, and other meteorological indicators, both observed and modeled:
hydrological:

USDA western U.S. mountain snowpack map.
- USGS (U.S. Geological Service) observed streamflow;
- NOAA Climate Prediction Center (CPC) modeled runoff anomalies and percentiles;
- VIC (University of Washington Variable Infiltration Capacity macroscale hydrologic model) 1-, 2-, 3-, and 6-month runoff percentiles;
- NLDAS (North American Land Data Assimilation System) modeled streamflow anomalies and percentiles;
- NLDAS model runoff anomalies and percentiles;
- USGS groundwater observations (real-time network, climate response network, total active network);
- USDA snow pack and snow water content observations for the West (SNOTEL station percentiles, SNOTEL station percent of normal, SNOTEL basin percent of normal and percent of average) and Alaska (SNOTEL station percent of normal, SNOTEL basin percent of normal);
- USDA reservoir storage as percent of capacity (with average depicted);
agricultural:

Map showing VegDRI (Vegetation Drought Response Index).
- USDA (U.S. Department of Agriculture) observed soil moisture conditions, departures and percentiles, and comparison to 5-year average and 10-year average;
- the Palmer Crop Moisture Index (CMI), which worsened and expanded during the month in the Southwest (weeks 1, 2, 3, 4);
- CPC modeled soil moisture anomalies and percentiles for end of April, soil moisture anomaly change compared to previous month;
- CPC's Leaky Bucket model soil moisture percentiles;
- NLDAS modeled soil moisture percentiles for the top soil layer and total soil layer;
- VIC modeled soil moisture percentiles, soil moisture percentile change compared to previous month;
- USDA observed pasture and rangeland conditions;
- Vegetation Drought Response Index (VegDRI);
- the NOAA/NESDIS satellite-based Vegetation Health Index (VHI);
- the USGS agro-hydrologic model (Soil Water Index, Water Requirement Satisfaction Index);
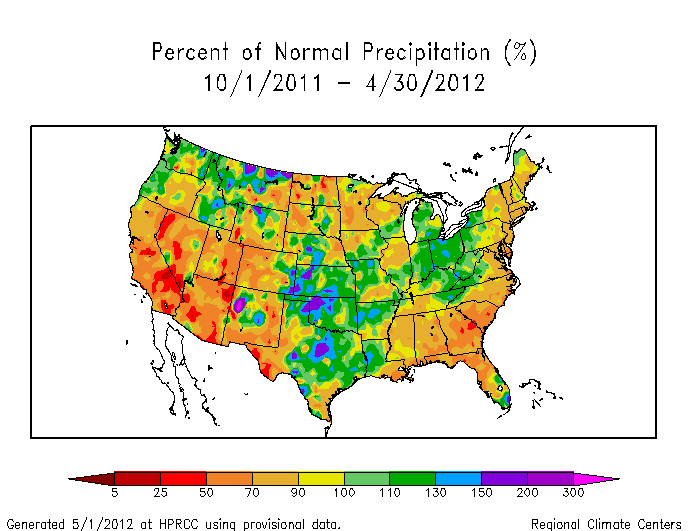
meteorological:

Map showing percent of normal precipitation.
- total precipitation (plotted by the USGS, NOAA National Weather Service [NWS], and NOAA High Plains Regional Climate Center [HPRCC]);
- percent of normal precipitation and precipitation percentiles (NWS, HPRCC station observations, Leaky Bucket model);
- NCDC statewide precipitation ranks;
- USGS number of days with precipitation and maximum number of consecutive dry days;
- temperature departures from normal (HPRCC) and percentiles (Leaky Bucket);
- NCDC statewide temperature ranks;
- number of record warm daily low temperatures, record daily high temperatures, record daily low temperatures, and record cool daily high temperatures set in April 2012 (from NCDC's daily records analysis).
![NOAA National Weather Service [NWS]](/img/climate/research/2012/apr/noaa-nws-ahps-pcp-amt-0430-us-mtd.jpg)
![NOAA High Plains Regional Climate Center [HPRCC]](/img/climate/research/2012/apr/hprcc-pcp-amt-0430-us-1m.png)
Regional Discussion
April 2012 was drier than normal for most of the stations in the Hawaiian Islands, resulting in an expansion of D1 (moderate drought) and D0 (abnormally dry conditions) as D2 contracted this month compared to last month. Longer-term conditions continued drier than normal (last 2, 3, 6, 12, 24, 36 months, year to date [January-present], and water year to date [October-present]), especially for the southern islands where streamflow levels were below normal. As noted by the NWS, drought impacts continued in many areas.
![year to date [January-present]](/img/climate/research/2012/apr/hprcc-pcp-pct-0430-hi-ytd.png)
![water year to date [October-present]](/img/climate/research/2012/apr/hprcc-pcp-pct-0430-hi-wytd.png)
The precipitation pattern over Alaska during April 2012 was predominantly drier than normal. Precipitation deficits are evident at longer time scales at some interior and southern stations (2, 3, 6, 12, 24, 36 months, year to date, and water year to date). However, snowpack and snow water content (for most stations and basins) were generally near to above normal (except for a few interior locations), and there was no drought or abnormal dryness indicated on the May 1st USDM.
The rainfall pattern across Puerto Rico during April was generally mixed. Drier-than-normal conditions become evident in a small southeastern area at longer time scales (2, 3, 6 months, year to date, and water year to date). With streamflow above average, the May 1st USDM map had no drought or abnormally dry areas on the island.
 |
 |
On a statewide basis, April 2012 ranked in the top ten driest Aprils for two states in the Southeast (Tennessee at sixth driest and Alabama at eighth driest), with Arkansas having the eleventh driest April in the 1895-2012 record. Eight other states from the Southern Plains to Great Lakes, and two in the West, ranked in the driest third of the historical record. Dryness in the Northeast stands out at the three month time scale, with 13 states from Tennessee to New England, plus Wyoming in the West, having the tenth driest, or drier, February-April. Connecticut ranked driest on record and New Jersey second driest. Four states in the West, and all but four east of the Mississippi River, ranked in the driest third of the historical record.
 |
 |

If the time period is extended another month back to include January, we still see dryness in the Northeast but drought in the West becomes more striking. January-April 2012 ranks in the top ten driest such four-month periods for seven states in the Northeast, one (Georgia) in the Southeast, and two (Colorado and Wyoming) in the West. Maryland and Delaware had the driest January-April, with New Jersey and Connecticut ranking second driest. Going back two more months (November 2011-April 2012) reveals pronounced dryness further west, with Nevada having the eighth driest such 6-month period, Utah tenth driest, and California twelfth driest. Three other states in the West, five in the Southeast, and ten in the Northeast ranked in the driest third of the historical record. At the 12-month time scale, dryness dominates in the southern states while the Northeast is wet. May 2011-April 2012 ranked in the top ten driest category for Texas, New Mexico, Florida, and South Carolina, with Georgia having the second driest such 12-month period.
 |

The latest drought episode in the contiguous U.S., which gained steam in early 2011, has waned on a national scale in recent months. But while the percent area of the country in extreme to exceptional drought has dropped from a peak of about 19 percent during the summer of 2011 to about 7 percent at the end of April 2012, the percent area in moderate to exceptional drought continued to climb during this period, hovering near 40 percent at the end of April. This trend is reflected in the national Palmer Z Index, which integrates drier-than-normal (water supply) and warmer-than-normal (water demand) conditions across the nation on a month-by-month basis. The national monthly Palmer Z Index for January 1998-April 2012 indicates that, from June 2011 through April 2012, dry and warm conditions have combined to cause overall drought conditions to persist when integrated across the country. On a regional basis, the South has shown a dramatic improvement in all categories in recent months, while drought continued to linger in the Southeast. Similar trends can be seen on a statewide basis in Texas, New Mexico, and Georgia.

Percent area of the Western U.S. in moderate to extreme drought, based on the Palmer Drought Index.
Pacific weather systems moving across the West brought above-normal precipitation to the coastal states during April 2012. But drier-than-normal conditions dominated from the Southwest and intermountain basin to the Central Rockies. Dry weather has been the rule for the water year to date (October-present), as reflected in low elevation as well as high elevation (SNOTEL) precipitation, especially for the southern half of West. Mountain snow pack and snow water equivalent (basin averages as well as station percent of normal and percentiles) were near to above normal in parts of the Northwest, but to the south conditions were much drier with many stations having near-record low snow water content. Low precipitation as well as above-normal temperatures, which accelerated melting, contributed to the low snowpack. Mountain snowpack is a crucial water supply during the following melt season. Fortunately, the reservoirs in most states were near to above normal, with just Arizona and New Mexico averaging below normal statewide. According to the USDM, 46 percent of the West was experiencing moderate to exceptional drought at the end of April, a 3 percent decrease compared to March. The Palmer Drought Index statistic was about 44 percent, reflecting a remarkable rise over the last four months.
A more detailed drought discussion, provided by the NOAA Regional Climate Centers and others, can be found below.
West — Upper Colorado River Basin — Pacific Islands
As noted by the Southeast Regional Climate Center, monthly precipitation was below average across most of the Southeast in April, while mean temperatures were generally above average. In particular, the southern tier of the region (except for South Florida), as well as eastern portions of North Carolina and northern Virginia, recorded less than 50 percent of normal precipitation for the month. The driest locations were found across central portions of Alabama and Georgia, where monthly precipitation totals were less than 25 percent of normal. Columbus, GA recorded 0.49 inch (12.5 mm) of precipitation for the month, making it the second driest April in a record extending back to 1948. Monthly precipitation was 50 to 100 percent of normal across the interior of Puerto Rico, but as much as 200 percent of normal along the southern and eastern slopes.
Drought conditions continued to worsen across the Southeast in April. One notable exception was South Florida, which saw an elimination of drought conditions due to the heavy rains there. The area of exceptional drought (D4) expanded across southeast Alabama, southern Georgia, and into the northeast Panhandle of Florida, while the area of extreme drought (D3) expanded into South Carolina and central Florida. Areas of severe drought (D2) expanded into southeast Virginia, while moderate drought (D1) conditions re-emerged across northern sections of Alabama and Georgia. The warm, dry weather contributed to several large wildfires, including one that burned over 35,000 acres near the Florida-Georgia border and impacted air quality from the northeast Florida Panhandle all the way to the Tampa Bay area. Warm temperatures and lack of precipitation over the past six months continued to reduce stream flow and groundwater levels across parts of the Southeast, particularly southern Georgia where most gauge stations were in the bottom 10 percent or at their record low level by the end of April. Conversely, the warm weather resulted in Florida watermelons shipping as much as 2 weeks early with larger volumes than last year. The cold weather at the beginning and end of the month caused damage to the apple, blueberry, and blackberry crops in western North Carolina, with projected losses exceeding 40 percent. The cold weather also caused damage to the Bermuda grass that had begun to emerge across northern Georgia.
As explained by the Southern Regional Climate Center, with only a few exceptions, April was a very dry month for the Southern region. Most stations received less than half the expected precipitation for the month. The driest area of the region included much of central Texas, where many stations reported only five percent of normal precipitation or less. Similar but less extreme dryness was also observed in northeastern Arkansas and throughout much of western and central Tennessee. Tennessee experienced its sixth driest April on record (1895-2012), with a state average precipitation total of only 2.17 inches (55.12 mm). Arkansas reported a state average precipitation total of 2.53 inches (64.26 mm), making it their eleventh driest April on record (1895-2012). For the state of Texas, it was their 21st driest April (1895-2012), with a state average precipitation total of 1.39 inches (35.31 mm). Like March, April was generally a warmer-than-normal month for the region.
Drought conditions in the Southern region improved for the third consecutive month. Although the total area of the region in drought increased by approximately one percent, the amount of extreme drought decreased by approximately six percent. Much of this improvement occurred in western and southern Texas, which has been under the grip of drought for over a year. Some new drought popped up in southern Tennessee, where it has been much drier than normal for two consecutive months.
As summarized by the Midwest Regional Climate Center, April temperatures were near normal in the eastern part of the Midwest and above normal in the western parts of the region. April precipitation varied with above-normal precipitation in most of the western half of the Midwest and below-normal precipitation in the southeastern half of the region. Totals exceeded 150 percent of normal in parts of Minnesota, Missouri, and Illinois while totals failed to reach 50 percent of normal further to the south and east, including parts of Missouri, Illinois, Kentucky, Indiana, Ohio, and Michigan. April snows were recorded in the northern parts of Minnesota, Wisconsin, Michigan, and Ohio with only north central Minnesota topping normal for the month. Though the total Midwest area in drought shrank slightly in April, the locations affected spread into parts of Illinois and Kentucky.
As noted by the Northeast Regional Climate Center, precipitation totals averaged below normal for the third consecutive month. April's regional total of 2.95 inches (74.9 cm) was 81 percent of normal. Maine was the sole state to average wetter than normal and had a departure of 121 percent. Departures among the drier-than-normal states ranged from 91 percent in Vermont to 55 percent in Pennsylvania, where it was the 16th driest April in 118 years. It was the driest January through April since 1895 in Delaware and Maryland, the second driest in Connecticut and New Jersey, and the fifth driest in New Hampshire and the Northeast. The Northeast's average temperature was 46.8 degrees F (8.2 degrees C) in April. This was only 0.6 degrees F (0.3 degrees C) warmer than normal — the average this month was the closest to normal since August 2011 when the departure was +0.5 degrees F (0.3 degrees C). It was the first month since October 2011 that all the states in the region did not average warmer than normal.
Four consecutive dry and warm months worsened the drought conditions in parts of the Northeast. As of April 24, 2012, the USDM had much of the eastern third of the region in moderate (D1) to severe (D2) drought. A few locations in Massachusetts had implemented mandatory or voluntary outdoor water use restrictions during the month. The agricultural community in Delaware and eastern Maryland was also impacted by the dry weather — some farmers have waited to plant crops due to low soil moisture while others have been irrigating — a practice not typically needed during the spring. An increase in brush fires throughout the region prompted bans on outdoor burning. One fire in southeastern New York destroyed 30 buildings and spread over 50 acres at a former Catskill resort. A late season Nor'easter brought up to 3 inches (76.2 mm) of much needed rain to eastern New England on the 23rd, easing drought concerns there.
As explained by the High Plains Regional Climate Center, the region was warm again this month — similar to March, based on preliminary data, every station in the region had above-normal temperatures. Precipitation varied across the region. Much of the eastern half of the region had precipitation totals which were higher than normal, while lower than normal precipitation areas included most of Wyoming, the western half of Colorado, central and northeastern Kansas, and isolated pockets in Nebraska and the Dakotas. Snowfall was sparse this month and due to the continued warmth, snow pack has declined in the mountainous portions of the region. According to the Natural Resources Conservation Service, by the end of the month, the statewide snowpack was 19 percent of average in Colorado and 45 percent of average in Wyoming. The low snowpack has raised concerns about irrigation water availability for the growing season. In addition, according to the Denver Post, Independence Pass was scheduled to open two weeks ahead of schedule because of the lack of snow in the mountains. The pass usually opens the Thursday before Memorial Day weekend.
There were many changes again to the USDM this month. The drought conditions in the areas near the Colorado-Kansas border continued to improve as all extreme drought conditions (D3) were erased and only a couple of small areas of severe drought conditions (D2) remained. In eastern South Dakota, D2 was downgraded to moderate drought conditions (D1) and some drought conditions were completely eliminated in the northwest portion of the state. Although recent rains have led to improvements in these areas, others have seen degradation. The small area of D2 in western Colorado expanded to include much of the west-central portion of the state. A patch of D1 that was in western South Dakota was extended north into North Dakota and south into the panhandle of Nebraska. Abnormally dry conditions (D0) also expanded to include eastern Wyoming and small areas of D1 crept into southern portions of the state.
As summarized by the Western Regional Climate Center, the snow season typically declines significantly in the West as April ushers in a transition to warmer temperatures. A few precipitation events brought much needed moisture to California and added to the near-normal water year totals in the Pacific Northwest, while the Desert Southwest remained mostly dry. Periods of anomalously low and high temperatures averaged to near normal for the month as a whole for the coastal states, while more inland locations saw higher than average temperatures. After a cold and snowy winter, temperatures in Alaska were mild and near normal for April. Several daily record highs were set at various locations throughout the state during the latter half of the month.
The Great Basin and Desert Southwest saw dry conditions and persistence or development of drought in April, with most locations well below normal precipitation values. Due to low snowpack and rapid melt of existing snowpack, spring and summer stream flow forecasts for these areas were at 50 percent of normal or less for these regions. Fire conditions in the Great Basin in April were already comparable to those normally experienced during the peak of summer. Due to the dry winter and warm April, the Western Great Basin has experienced over 60 fires so far this year, four times the usual number of fires for this region. Vegetative dryness this low is usually not seen for another 3 to 4 months. After a rainy March, Hawaii returned to dry conditions with Hilo, Big Island, only receiving 6.67 in (169.4 mm) for the month, 57 percent of normal. To the northwest, Lihue, Kauai received 0.37 in (9.4 mm) 19 percent of normal, though the location's year-to-date total of 31.75 in (806.5 mm) remained well above average thanks to high March totals.
Upper Colorado River Basin: As reported by the Colorado Climate Center, the May 1st NIDIS (National Integrated Drought Information System) assessment for the Upper Colorado River Basin (UCRB) indicated that, snowpack conditions around the UCRB were all well below average and many sites have completely melted out. This is a combined result of less than average seasonal snowpack accumulations and much earlier melting (seasonal peaks one month earlier than normal). Nearly all of the sub-basins were near or below 30 percent of average. The lowest averages were in eastern Utah. Water-year-to-date (WYTD) SNOTEL precipitation percentiles were lowest for the Yampa and Gunnison basins in Colorado, with many sites reporting in the lowest fifth percentile or below. The Wasatch range in Utah and the northern mountains of Colorado were also dry, with most precipitation percentiles in the teens. The VIC model showed dry soil moisture conditions in eastern Colorado, in Utah around the Colorado River and Green River valleys, and in southern Wyoming. The VIC showed very wet soils around the Colorado headwaters region (likely due to early melting of snowpack infiltrating the soils). When VIC snow water equivalent (SWE) and soil moisture are combined, the UCRB showed a moisture storage deficit. All of the reservoirs above Lake Powell were above their April storage averages. Lake Dillon and Flaming Gorge saw storage volume decreases since the beginning of the month. The rest of the major reservoirs increased in volume since the beginning of the month. Lake Powell was at 84 percent of average and 64 percent of capacity (compared to 52 percent one year ago). Compared to 2002 (the UCRB's most severe drought in recent history), water supply was in better condition with all of the major reservoirs above Lake Powell at higher levels than in April of 2002.
Pacific Islands: According to reports from National Weather Service offices, the Pacific ENSO Applications Climate Center (PEAC), and partners, conditions varied across the Pacific Islands.
As noted by the National Weather Service office in Honolulu, below-normal rainfall in April kept drought firmly in place over leeward areas of Maui County and the Big Island. In Maui County, extreme drought conditions, or the D3 category in the USDM map, continued over western Molokai and southwest Maui from Kihei to Makena. Severe drought, or D2 category conditions, covered the island of Lanai, the lower leeward slopes of the west Maui mountains and leeward Haleakala from Kula to Kaupo. On the Big Island, extreme drought continued to cover portions of the south Kohala district and the Pohakuloa region of the Hamakua district. Severe drought maintained its presence over the lower elevations of the north and south Kona districts and the western portion of the Kau district. Kauai, Oahu and windward sections of the Big Island and Maui were drought-free. The end of April marked the fourth consecutive year with drought persistence through the wet season within the state of Hawaii.
Some drought impacts in Hawaii include the following:
- On Kauai, there were no drought impacts to report.
- On Oahu, the water supply in the Waimanalo reservoir has increased to pre-drought levels. On April 23, the state Department of Agriculture rescinded the mandatory 10 percent water use restriction for the Waimanalo reservoir. A voluntary 10 percent reduction in water use has taken its place as a precaution heading into the dry season.
- On Molokai, the water level in the Kualapuu reservoir remains very low. Thus, the State of Hawaii Department of Agriculture has continued a mandatory 30 percent reduction in irrigation water consumption.
- On Lanai, pastures and general vegetation conditions have been very poor. An earlier report indicated that axis deer have been encroaching populated areas of the island for forage due to poor supplies elsewhere.
- On Maui, late February and early March rainfall helped bring some improvements to pastures and vegetation. However, a lack of follow-up rain during the remainder of March and most of April resulted in a resumption of deterioration over the leeward sections of Maui. Some ranchers have destocked pastures in these areas due to poor forage conditions. One upcountry rancher indicated that over the past four years, poor pasture conditions have resulted in reduced cattle weights, poor breeding rates due to a significant reduction in the number of breeding cows and losses in the hundreds of thousands of dollars. The Maui County Department of Water Supply has continued to call for a 5 percent reduction in water use for upcountry residents. The request for a 10 percent reduction in water use by central and south Maui also remained in effect.
- On the Big Island, pastures and general vegetation over most of the south Kohala district were in very poor condition. Reports indicated that there was little or no edible forage for livestock. Ranchers in these areas have already destocked cattle and water hauling operations have been ongoing for many months.

On other Pacific Islands (maps — Micronesia, Marshall Islands, basinwide), April was drier than normal for Chuuk, Kosrae, Kwajalein, Pohnpei, and Saipan, but near to above normal for the rest of the stations. The last two months have been drier than normal for Kosrae, Kwajalein, and Saipan. According to the May issue of the Pacific ENSO Update, vegetation on the islands of the Commonwealth of the Northern Mariana Islands (CNMI) has become wilted and brown, several wildfires were observed on Guam, and recent dry spells have affected some of the northern islands of Chuuk State, Pohnpei Island and the eastern islands of Pohnpei State, Kosrae, and some of the northern atolls of the Republic of the Marshall Islands (RMI). Total rainfall for the last 12 months (May 2011-April 2012) was near to above normal for all stations except Pago Pago.
| Station Name** | May 2011 | Jun 2011 | Jul 2011 | Aug 2011 | Sep 2011 | Oct 2011 | Nov 2011 | Dec 2011 | Jan 2012 | Feb 2011 | Mar 2012 | Apr 2012 | May 2011-Apr 2012 |
| Chuuk | 77% | 218% | 125% | 144% | 118% | 97% | 136% | 125% | 57% | 181% | 107% | 40% | 117% |
| Guam IAP | 170% | 96% | 203% | 102% | 129% | 135% | 83% | 103% | 162% | 94% | 215% | 121% | 130% |
| Kapingamarangi | 86% | 130% | 147% | 162% | 107% | 57% | 81% | 124% | 109% | 71% | 121% | 102% | 110% |
| Koror | 171% | 129% | 152% | 155% | 266% | 122% | 62% | 97% | 36% | 126% | 121% | 120% | 133% |
| Kosrae | 160% | 114% | 87% | 122% | 104% | 154% | 95% | 174% | 65% | 185% | 60% | 84% | 115% |
| Kwajalein | 117% | 121% | 104% | 144% | 111% | 125% | 130% | 84% | 134% | 114% | 84% | 68% | 115% |
| Majuro | 125% | 97% | 131% | 108% | 115% | 115% | 119% | 91% | 107% | 65% | 194% | 97% | 113% |
| Pago Pago | 38% | 132% | 42% | 72% | 29% | 137% | 157% | 75% | 61% | 98% | 131% | 90% | 90% |
| Pohnpei | 92% | 128% | 92% | 138% | 115% | 77% | 123% | 110% | 82% | 138% | 98% | 45% | 100% |
| Saipan | 187% | 174% | 96% | 93% | 68% | 140% | 57% | 110% | 77% | 183% | 35% | 33% | 102% |
| Yap | 176% | 113% | 138% | 129% | 156% | 101% | 112% | 116% | 33% | 117% | 185% | 89% | 124% |
** Clicking on the station name will reveal a climatology graph of the normal monthly rainfall.

[top]
State/Regional/National Moisture Status
A detailed review of drought and moisture conditions is available for all contiguous U.S. states, the nine standard regions, and the nation (contiguous U.S.):
| northeast u. s. | east north central u. s. | central u. s. |
| southeast u. s. | west north central u. s. | south u. s. |
| southwest u. s. | northwest u. s. | west u. s. |
| Contiguous United States |
[top]
Drought Indicators
- Palmer Drought Indices
- Standardized Precipitation Index
- long-term (36 to 60 month) percent of normal precipitation maps
- airport station percent of normal precipitation maps
- statewide precipitation rank maps
- Cooperative station percent of normal precipitation maps
- percent of average maps for the SNOTEL stations in the western mountains provided by the Western Regional Climate Center
- hydrologic year precipitation
- snow water equivalent of snowpack
- satellite-based observations of vegetative health
- National Weather Service model calculations of soil moisture, runoff, and evaporation
- National Weather Service model calculations of soil moisture using the Leaky Bucket Model
- Midwest Regional Climate Center model calculations of soil moisture
- topsoil moisture conditions observed by the USDA and mapped by the Climate Prediction Center
- pasture and range land conditions observed by the USDA and mapped by the Climate Prediction Center
- streamflow maps maintained by the USGS
[top]
Contacts & Questions