SOUTHEAST DROUGHT
According to the Southeast
Regional Climate Center, there was much variability in the
monthly precipitation totals across the region. Florida, with the
exception of its western panhandle, recorded much below normal
precipitation totals. In fact, portions of southern Florida
received less than 25% of the normal precipitation for the month.
Precipitation totals for the month were below normal across much of
Alabama, western Virginia as well as drought stricken portions of
northern Georgia, northwest South Carolina, and western North
Carolina. Most of Puerto Rico recorded precipitation totals that
were below normal for the month of November. In contrast, a region
of above normal precipitation stretched from portions of southern
Georgia northeastward across central South Carolina, eastern North
Carolina, and southeast Virginia. Several locations within this
region recorded monthly totals that exceeded 200% of normal.
There was very little change in the drought lingering across
portions of the region. Exceptional drought (D4) continued to
plague northwestern South Carolina and expanded into extreme
northeast Georgia and extreme western North Carolina. Moderate
drought conditions continued to affect central Georgia and extreme
northeast Alabama as well as southwestern Virginia and northeastern
North Carolina.
SOUTH REGION DROUGHT
As noted by the Southern
Regional Climate Center, precipitation
was quite scarce during the month of November for most of the
Southern Region. Only small pockets of above normal monthly
precipitation values were observed, specifically in north central
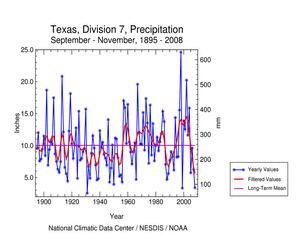
Louisiana, eastern Texas, and southeastern Mississippi. Western and
central Texas observed the largest precipitation deficits for the
month, with many stations reporting 5% or less of normal. Similar
deficit values were also observed in western and southern Oklahoma.
In Arkansas, most stations in the southernmost counties did receive
as much as 50-70% of normal. However, elsewhere the bulk of the
stations received only 25-50% of normal precipitation for the
month. Similar values were also observed in southeastern Louisiana,
western Tennessee, and northern Mississippi.
Drought
conditions in the Southern Region changed slightly over the
past month. Due to extremely dry conditions in central and southern
Texas, the USDM recognized a small area of exceptional drought (D4)
in the Austin, TX area. This is the highest level of drought that
is recognized by the USDM. The area of D4 drought extended from
just north of Austin, to just south of New Braunfels. It also
extended east to an area just west of Bastrop, and west to an area
just west of Johnson City and Blanco. Areas in Texas of lesser
drought that surround the bullet of D4 changed little over the past
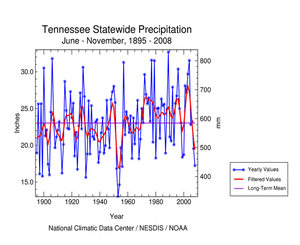
month, indicating persistently dry conditions. Similarly, drought
also continued to persist in eastern Tennessee. In Tennessee, there
was a slight westward migration of extreme and moderate drought.
Conditions in the western half of the state also deteriorated
slightly from near-normal to abnormally dry.
According to media reports (Knoxville News Sentinel, 11/07), in
early November, the USDA designated 39 counties in Tennessee as
primary natural disaster areas for agriculture. Governor Phil
Bredesen said: "Farmers in these areas have suffered crop losses
for corn and soybeans ranging from 30 to 65%. Livestock producers
are reporting low hay stocks going into the winter months due to
parched pastures and significantly reduced hay yields this summer
and fall."
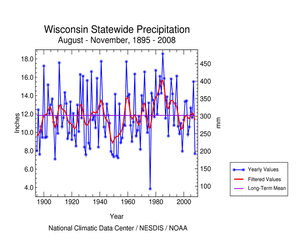
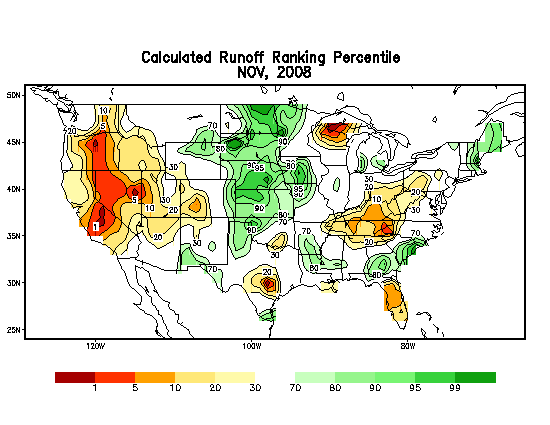
MIDWEST DROUGHT
As explained by the Midwest
Regional Climate Center, a persistent band of northwesterly
winds aloft over the Midwest kept much of the region dry during
November. The heaviest precipitation was in the western portions of
the region on the southern edge of the northwesterlies, and in the
lake-effect snow areas. Cold frontal passages, followed by westerly
and northwesterly surface winds bringing cold air over the
relatively warm lake waters, produced frequent days with
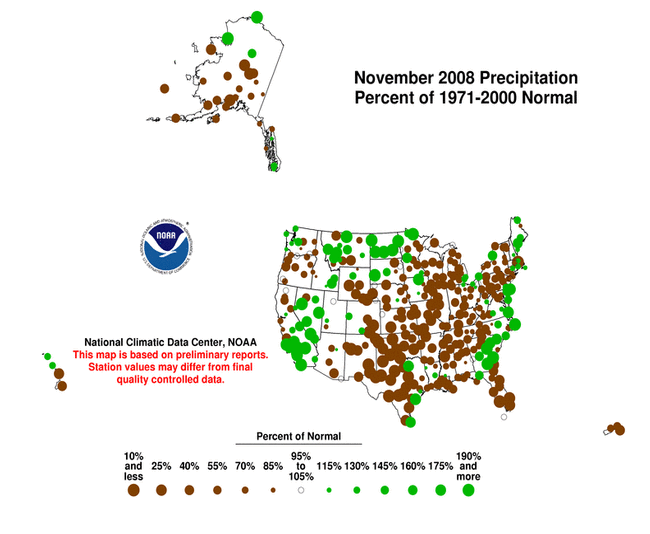
lake-effect snow. Precipitation for the month of November was above
normal in northwestern Minnesota, central Iowa, and downwind of the
Great Lakes in Michigan and northeastern Ohio. Elsewhere,
precipitation was only 50 to 75% of normal, with an area from
southern Missouri through central Illinois with less than 50% of
normal precipitation.
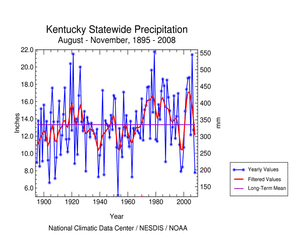
Areas of drought in the upper Midwest and in Kentucky expanded
during November. This marks the fourth consecutive month that most
of Kentucky has been dry, although some parts of northern Kentucky
have had below-normal rainfall since the spring. Extreme drought
conditions continued over eastern Kentucky where November
precipitation was 70% of normal. Eastern Kentucky communities such
as Jackson and London were short roughly a foot of rain for the
year-to-date, which makes 2008 potentially one of the driest years
on record for this region. Drought conditions eased somewhat
towards western Kentucky but many areas remained in moderate to
severe drought.
HIGH PLAINS REGION DROUGHT
As noted by the High Plains
Regional Climate Center, areas that received above normal
precipitation during November include North Dakota, the western
half of South Dakota, and northwest Nebraska. Many locations in the
drought area of western North Dakota received over 200% of normal
precipitation. Dry locations included Wyoming, Colorado, Nebraska,
Kansas and north central South Dakota, with less than 50% of normal
precipitation. The Perry Stokes Airport in Trinidad, CO did not
record any measurable precipitation and tied the record for its
driest November (last set in 1965).
In general, thanks to abundant precipitation, drought conditions
improved in western North Dakota as severe drought (D2) was
downgraded to moderate drought (D1) and conditions were forecast to
continue to improve. Moderate drought conditions persisted in
southwest Wyoming and southeast Colorado. While conditions were
expected to improve in southeast Colorado, a new area of abnormally
dry conditions (D0) developed in southwest Colorado.
North Dakota: By the end of the month,
drought conditions improved significantly, alleviating severe
drought that had lingered around southwestern portions of the state
since the spring of 2008. Based on the USDM
assessment, 17% of the state was under at least moderate
drought. Counties mostly affected by the moderate drought were
McKenzie, Golden Valley, Billings, Dunn, Stark, Morton, Grant,
Hettinger, Slope, Bowman and Adams counties. Some of the impacts of
the long-term drought since last fall are yield loss in lentil and
pea production.
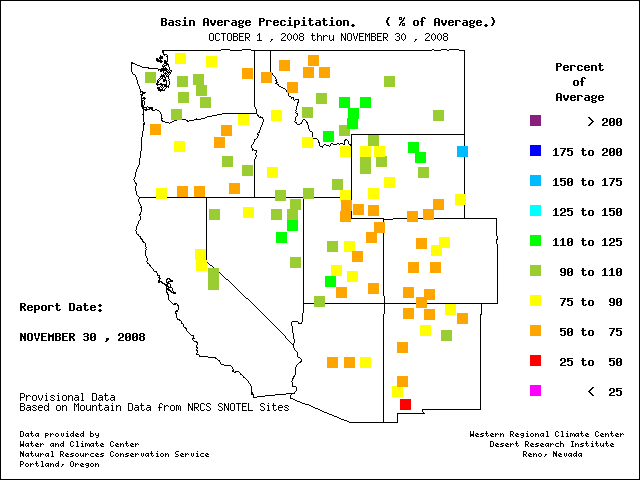
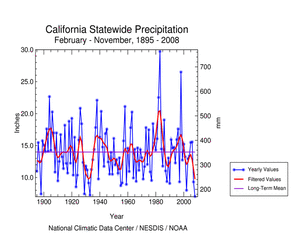
WESTERN DROUGHT
As summarized by the Western
Regional Climate Center, precipitation
was a mixed bag, with extreme northwest Washington, southern
California and portions of the northern Rockies recording wetter
than normal conditions. With the warm conditions, however, mountain
snowpack remained well below the December 1st average. The Lake
Tahoe drainage was at 3% of normal snowpack on December 1st and
fell to just 2 inches (5 cm) above its natural rim. An unusually
wet system crossed southern California on the 26th, producing
locally heavy rain and flooding in some areas. It was the wettest
November on record in Yuma, AZ, with 2.22 inches, all of it falling
on the 26th, and precipitation percentages of 500-1100% of monthly
average noted in many places.
Alaska: According to National Weather
Service reports (from information compiled and provided by Audrey
Rubel at NOAA NWS Alaska Region Headquarters), temperature and
precipitation anomalies varied across the state. Snowpack over
south central Alaska was slightly above normal while Anchorage
received 21.7 inches of snowfall (190% of normal). Snow totals for
reporting stations in southeast Alaska were well below normal.
However, total precipitation was a mixed bag. Northern and central
outer coast locations recorded below normal precipitation for the
month while central inner channel and southern locations posted
above normal total precipitation. The biggest departures from
normal, were northern locations (below normal) and southern
locations (above normal). Precipitation was fairly uniformly spread
throughout the month with the exception of the central inner
channels which experienced two 4-day stretches or dry or nearly dry
days during the second and third weeks of the month. These two
4-day periods coincided with the coldest daily highs and lows
during the month.
In Fairbanks, snow during the month was frequent but very light.
The total snowfall of 6.5 inches was less than half of normal. The
snow melted down to just 0.28 inch of precipitation, which is
barely a third of normal. Snowfall for the season through the end
of November (July-November) totaled 20.5 inches, which is more than
8 inches below normal.
November preciptiation (0.53 inch) and snowfall (7.3 inches) were
both below average for Kotzebue. In Nome, precipitation for the
month was all snow with 9.1 inches of snowfall recorded. This was
equivalent to 0.35 inch of liquid precipitation, which is 0.93 inch
below normal for November. The total amount of precipitation for
the year (January-November) is 9.92 inches, making 2008 the eighth
driest year on record so far.
November was warm and wet in Barrow. The average temperature of 4.0
degrees F was 4.9 degrees above normal. Total precipitation was
0.32 inch which is twice the November normal. Total snowfall was
12.3 inches, which is almost four times the average amount of 3.2
inches. November 2008 ranks as the fifth snowiest November on
record. The top five snowiest Novembers are: 1925 (19.0 inches),
2001 (17.5 inches), 2007 (14.4 inches), 1965 (12.8 inches), and
2008 (12.3 inches). For the period October 1-November 30, the
snowfall total was 35.5 inches, which ranks as the second snowiest
October-November on record, with only 1925 having more snow (40.2
inches).
Lake and river ice thickness across Alaska was 81-93% of normal for
the first of December.
NORTHEAST DROUGHT
As noted by the Northeast
Regional Climate Center, above normal precipitation totals were
confined to Maine, eastern New Hampshire, coastal Massachusetts,
Rhode Island, southern New Jersey, Delaware, the Eastern Shore of
Maryland and a few areas downwind of Lakes Erie and Ontario. State
precipitation departures ranged from 70% of normal in Pennsylvania
to 155% of normal in Maine. The Northeast, as a whole, averaged 99%
of the long-term mean.
According to the December
2, 2008 USDM, most of western Pennsylvania was abnormally dry,
as was the northern half of West Virginia, the western panhandle of
Maryland and southwestern Maryland. The southern half of West
Virginia was in moderate drought and the extreme southern tip of
the state was still in severe drought. The Pennsylvania Department
of Environmental Protection issued a drought watch for 29 counties
in western and central portions of the state. The state requested
that water users in the affected areas reduce their non-essential
water use by 5%.
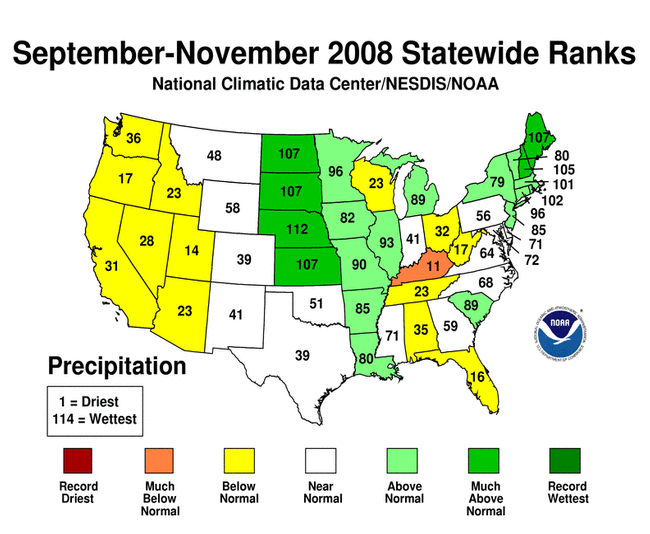
For autumn (September-November), precipitation totals averaged
close to normal, 103%, but there was a wider range throughout the
Northeast. The New England states of Maine, New Hampshire,
Massachusetts, Rhode Island and Connecticut had totals ranging from
122% (CT) to 139% (ME) of normal. West Virginia and Pennsylvania's
seasonal totals were 66% and 87% of normal, respectively. The
remaining states had totals that were near normal.
|


 weather pattern
during November generally consisted of a
high
pressure ridge in the upper levels of the atmosphere over the
western U.S. and a low pressure trough over the East. This
upper-air pattern was associated with warmer-than-normal
weather in the West and cooler-than-normal temperatures in the
East and provided the guiding currents for numerous Pacific
weather fronts. Cold, dry air was pulled in behind the fronts as
they moved across the central and eastern U.S. With this pattern,
Gulf of Mexico moisture was cut off from most of the country,
resulting in dry
conditions from the southern Plains to the interior Northeast.
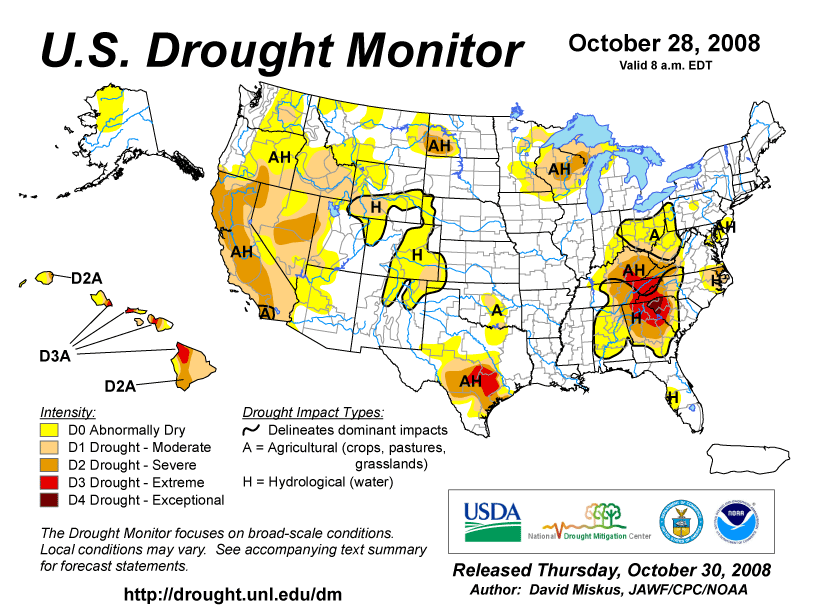
As a result, there was little change in the drought pattern across
the contiguous U.S., with the exception of some intensification in
the core drought areas of south central Texas and the Southeast
(December 2
USDM versus October 28
USDM).
weather pattern
during November generally consisted of a
high
pressure ridge in the upper levels of the atmosphere over the
western U.S. and a low pressure trough over the East. This
upper-air pattern was associated with warmer-than-normal
weather in the West and cooler-than-normal temperatures in the
East and provided the guiding currents for numerous Pacific
weather fronts. Cold, dry air was pulled in behind the fronts as
they moved across the central and eastern U.S. With this pattern,
Gulf of Mexico moisture was cut off from most of the country,
resulting in dry
conditions from the southern Plains to the interior Northeast.
As a result, there was little change in the drought pattern across
the contiguous U.S., with the exception of some intensification in
the core drought areas of south central Texas and the Southeast
(December 2
USDM versus October 28
USDM).


