| Contents Of This Report: |
 |

|

|
|
|
By the end of July, the
area of drought covered the Plains from the Rockies eastward to the
Midwest and the South from Arizona to the Atlantic Ocean (August 1 Drought
Monitor). In the drought areas, soil
moisture was low, streamflow
was especially low in the northern and central Plains and the
Southeast, and vegetative
health was poor.
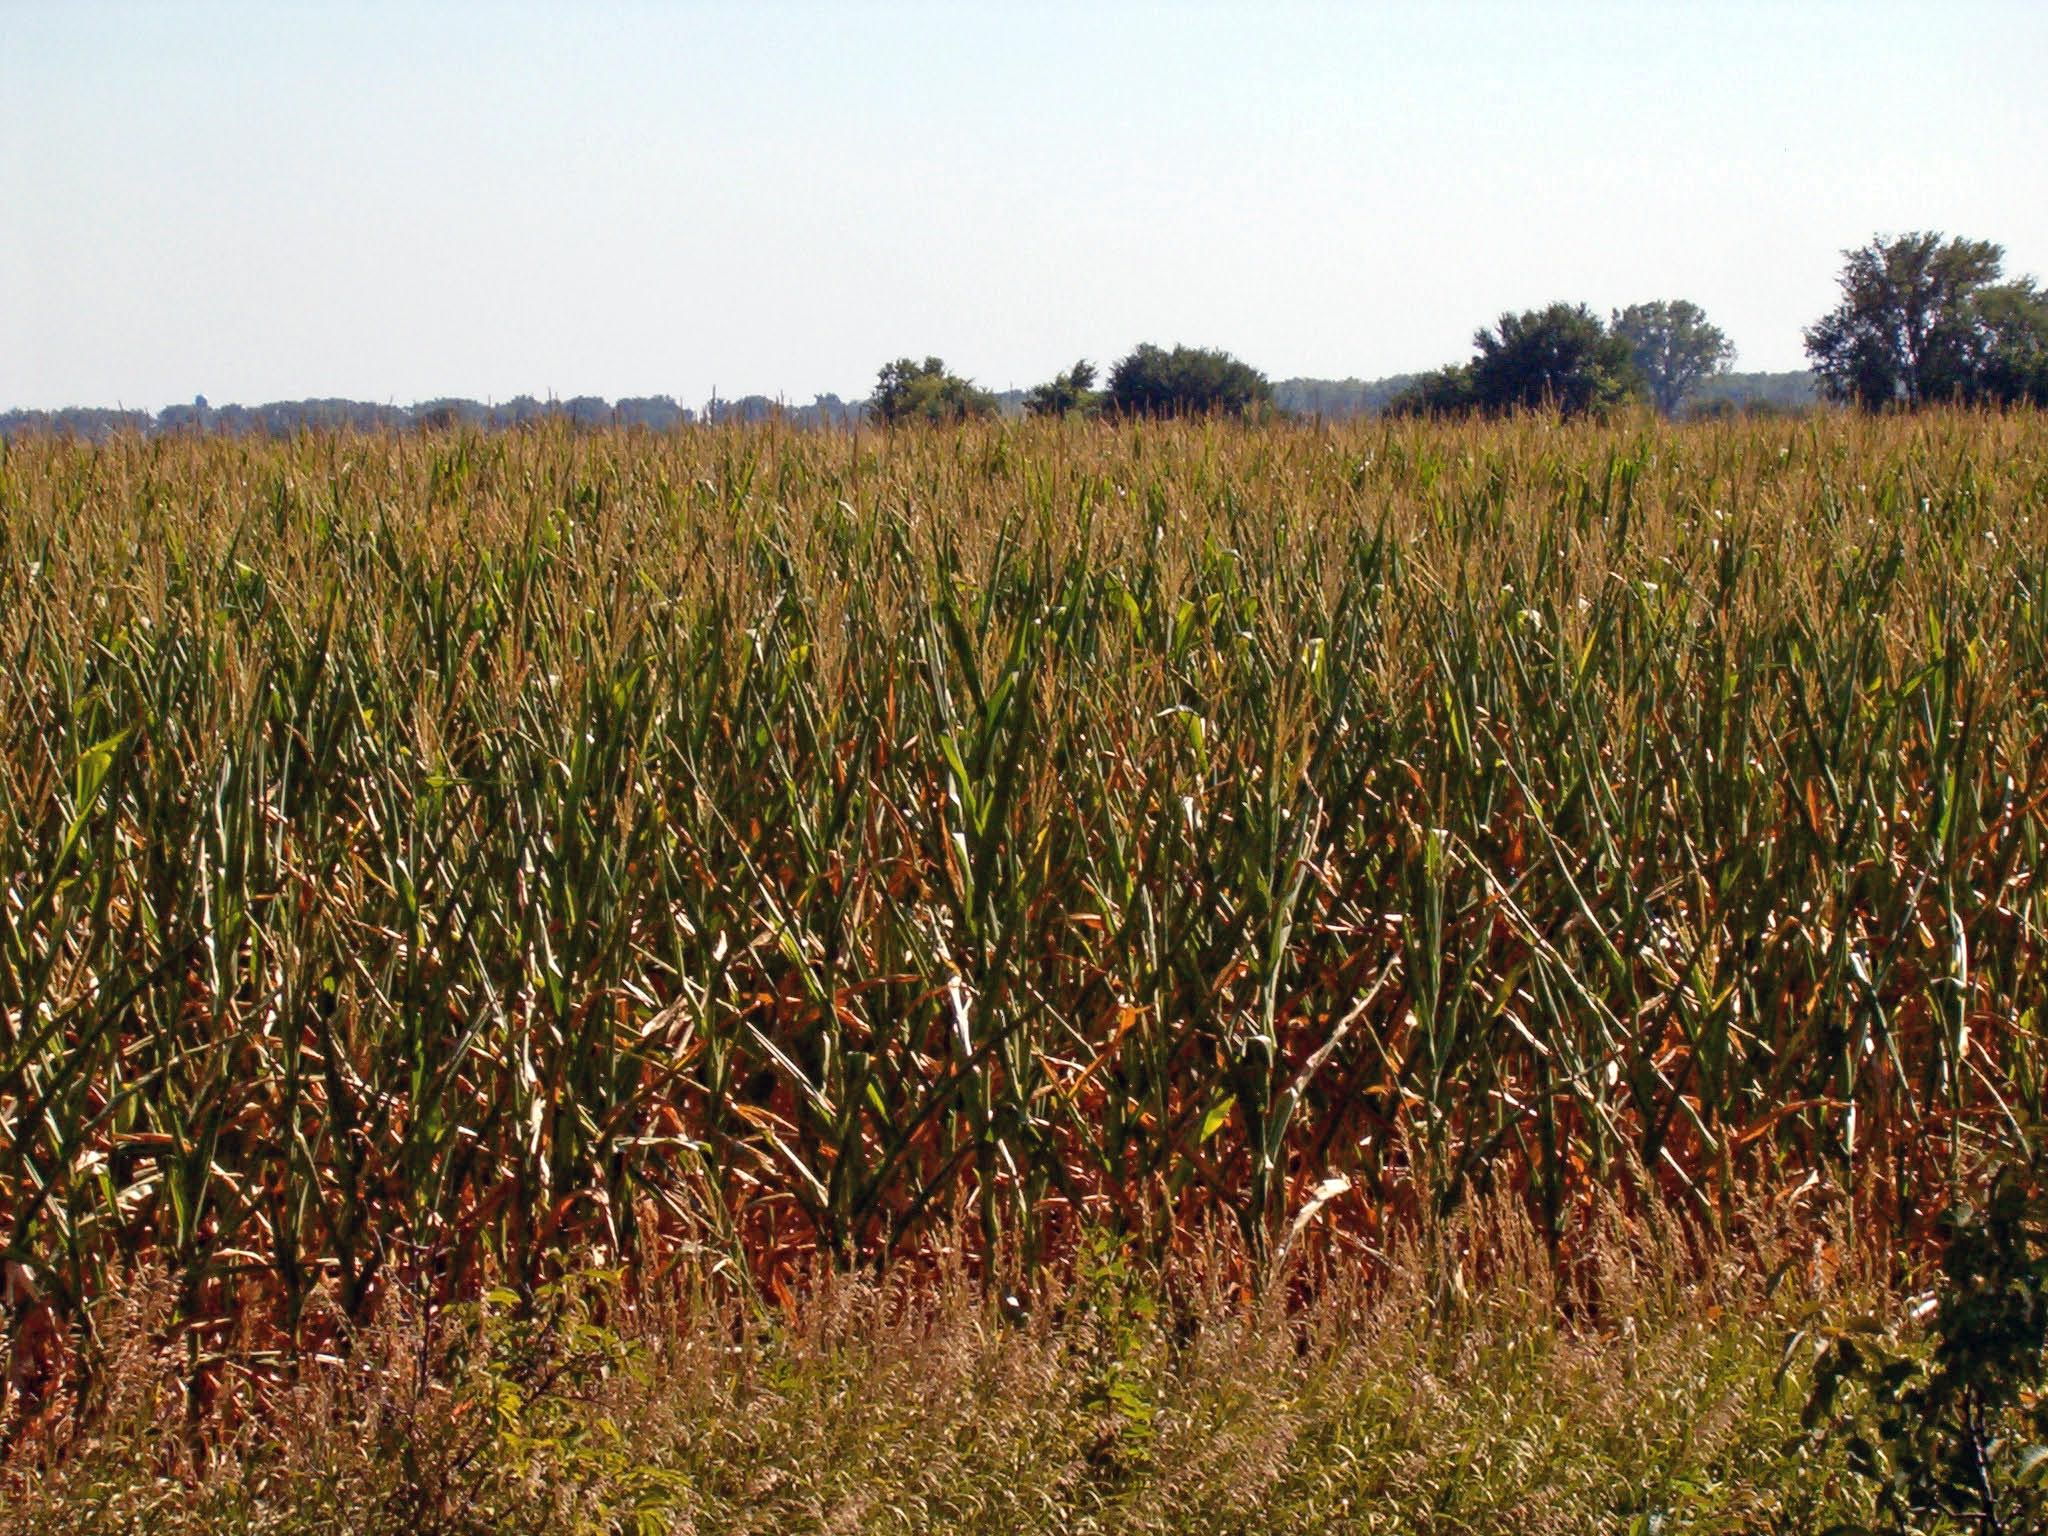
Coupled with very dry conditions were high temperatures and evaporation in the drought stricken areas. Drought and high temperatures impacted many sectors of the economy. Crops were highly stressed or dying, livestock was dying or prematurely sold because of a lack of feed and water, water restrictions were common in many areas, and wildlife in search of food and water was reported in urban areas. Disaster conditions have been declared by the governors of several states. Dry conditions also led to dozens of fires in the western half of the country. Drought impacts have been collected and summarized by county at the National Drought Mitigation Center's Drought Impact Reporter.
The July precipitation pattern at the primary stations in Alaska was below normal in most of the southern part of the state. In Hawaii, the precipitation pattern was dry throughout the State. In Puerto Rico, the month was predominantly dry in the central and western interior areas, based on National Weather Service radar estimates of precipitation. |
Some regional highlights:
|

|
| A detailed review of
drought and moisture conditions is available for all contiguous U.S.
states, the nine standard regions, and
the nation (contiguous U.S.): STATES: REGIONS:
|
|
|
|
| The long-term drought that has persisted in Wyoming since late 1999 has hit the northeastern corner of the state particularly hard. In Wyoming Division 6 (Belle Fourche Drainage), precipitation since August 2001 has been only 80% of the 60-month normal, and the NWS/NCEP objective drought indicator blends for late July 2006 showed Division 6 to be in the worst drought category. This year began with near-normal precipitation from January-April 2006, but then June and July brought only 35% of normal rainfall. |
 large image |
|
 large image  large image |
| The graph below (annual values in light blue, 5-year weighted average in dark blue) shows the annual (August-July) precipitation, 1896-2006, for Wyoming Division 6. The value for 2006 (13.22") is only the 20th lowest since 1896, but it marks the seventh year in a row with below-normal precipitation. The most persistent drought, however, was the Dust Bowl, with 12 years of below-normal precipitation (1929-1940), including the lowest 60-month total precipitation (1934-1938; indicated with yellow arrow) on record. The second-lowest 60-month total is the current drought, 2002-2006 (orange arrow). |
 large image (50 KB) |
The graph to the left also shows a 388-year tree-ring record (1603-1990; annual values in light red; 5-year smoothed values in dark red) that corresponds well to the variability in August-July precipitation. This record is the average of three tree-ring chronologies (Douglas-fir and ponderosa pine) from Wyoming, South Dakota, and North Dakota. The correlation between the annual values of the tree-ring record and August-July precipitation is 0.671, indicating a high degree of shared variance. The tree-ring record captures the multi-year variability of the observed precipitation record particularly well. |
| The tree-ring record, as a proxy for precipitation, can put the persistent droughts of the last century in northeastern Wyoming into a much longer perspective. There are four 5-year periods in the tree-ring record (red arrows) with average ring-width anomalies similar to that for 1934-1938, suggesting that those periods were droughts of similar severity to the worst part of the Dust Bowl, and by extension, similar to the current drought. The most severe of these paleodroughts, judging from the ring-width anomalies, was from 1756-1760. But no paleodrought appears to match the overall persistence of the Dust Bowl years. The current drought, like the Dust Bowl, appears to be among the worst multi-year droughts of the past 400 years. |
Resources:
Reference:
|