U.S. Drought Highlights:

- On the national scale, severe to extreme drought affected about 8 percent of the contiguous United States as of the end of August 2005.
- Moderate to extreme drought affected about 16 percent of the contiguous U.S.
- The month was drier than normal across much of the Pacific Northwest into the northern Rockies and High Plains, much of the upper Midwest to Great Lakes, and parts of the mid-Atlantic to southern New England states, southern Texas, and central Florida.
- Many of these dry areas, plus parts of New Mexico, have been drier than normal for the last 3 to 6 to 9 months.
- Long-term moisture deficits (last 24 to 36 to 60 months) persisted across parts of the West into the northern High Plains and central Plains.
Please Note: The data presented in this drought report are preliminary. Ranks, anomalies, and percent areas may change as more complete data are received and processed.
National Overview
On the national scale,
- severe to extreme drought affected about 8 percent of the contiguous United States as of the end of August 2005, an increase of about 2 percent compared to last month
- about 16 percent of the contiguous U.S. fell in the moderate to extreme drought categories (based on the Palmer Drought Index) at the end of August
- on a broad scale, the previous two decades (1980s and 1990s) were characterized by unusual wetness with short periods of extensive droughts, whereas the 1930s and 1950s were characterized by prolonged periods of extensive droughts with little wetness (see graph below right)
- about 26 percent of the contiguous U.S. fell in the severely to extremely wet categories at the end of August
- a file containing the national monthly percent area severely dry and wet from 1900 to present is available
- historical temperature, precipitation, and Palmer drought data from 1895 to present for climate divisions, states, and regions in the contiguous U.S. are available at the Climate Division: Temperature-Precipitation-Drought Data page in files having names that start with "drd964x" and ending with "txt" (without the quotes).
Regional Overview
August 2005 was drier than normal across much of the Pacific Northwest into the northern Rockies and High Plains, much of the upper Midwest to Great Lakes, and parts of the mid-Atlantic to southern New England states, southern Texas, and central Florida.
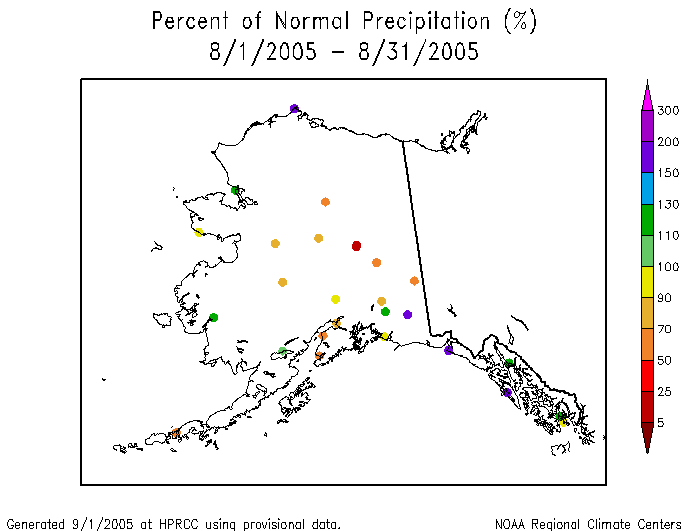
The August precipitation pattern at the primary stations in Alaska was mixed but generally drier than average in the interior and south central coastal stations, and wetter than average in the southeast panhandle. Across Hawaii, most of the stations were drier than average on the northern islands, while a mixed pattern was evident on the southern islands. In Puerto Rico, the precipitation signal was mostly wetter than normal in the west with areas of subnormal rainfall in the east, based on National Weather Service radar estimates of precipitation. August streamflow averaged near normal for the Hawaiian Islands and wetter than normal for Puerto Rico.

Many of the August dry areas, plus parts of New Mexico, have been drier than normal for the last 3 to 6 to 9 months, including parts of Alaska and Hawaii. Long-term moisture deficits (last 24 to 36 to 60 months) persisted across parts of the West into the northern High Plains and central Plains.
Some regional highlights:
- One state had the tenth driest, or drier, August in the 111-year record:
- Oregon: 6th driest
- Two states had the tenth driest, or drier, July-August:
- Illinois ranked tenth driest, or drier, for several seasons:
- May-Aug: 8th driest
- Apr-Aug: 8th driest
- Mar-Aug: 6th driest
- Feb-Aug: 7th driest
- Arkansas ranked tenth driest, or drier, for several seasons:
- Apr-Aug: 10th driest
- Mar-Aug: 7th driest
- Feb-Aug: 7th driest
- As noted in media reports (The New York Times, 8/15; WKYT27 Lexington, KY, 8/12), the Midwest drought has lowered water levels along parts of the Mississippi and Ohio Rivers, curtailing barge traffic which affected several economic activities. The drought has also dried up wells, caused insect infestations and wreaked havoc on corn and soybean fields.
- During the last two months, drought declarations or emergencies have been declared in four states: Wisconsin (Wisconsin Ag Connection, 7/18), Illinois (Brownfield Network, 7/27), Missouri (Kansas City Star, 8/25), and Arkansas (AP, 8/23).
- By the end of the month, 60% or more of the pasture and range land was in poor to very poor condition in Missouri (61%), Arkansas (68%), Pennsylvania (66%), Connecticut (72%), and Rhode Island (95%).
- End-of-month and month-averaged soil moisture conditions were drier than normal across a broad swath from the southern Plains to the western Great Lakes, and parts of the Pacific Northwest, northern and central Rockies, Ohio Valley, and Northeast, based on model computations (CPC-1, CPC-2, MRCC). The models also indicated dry soil moisture conditions in parts of Alaska and Hawaii, and near the surface and at depth from Iowa to the Great Lakes.
- According to end-of-August USDA observations, more than 50 percent of the topsoil moisture was rated short to very short (dry to very dry) across the Pacific Northwest and northern Rocky Mountain states, and in a swath from the southern Great Plains to the Great Lakes and Northeast states. This is drier than the 5-year and 10-year averages across much of the area.
- Streamflow levels were below seasonal norms across parts of the Pacific Northwest, northern and central Rockies, central Plains, Great Lakes, Mississippi valley, and Northeast to mid-Atlantic states, as computed by models and based on USGS observations.
- Several large wildfires burned across the West during the month. By the end of August, most of the fires were concentrated in the northern Rockies, although during the month numerous large fires had burned parts of Alaska and the Columbia Plateau regions.
- Reservoir levels in the West reflected the long-term precipitation deficits in many states. The percent area of the western U.S. (Rockies westward) experiencing moderate to extreme drought (as defined by the Palmer Drought Index) increased to about 20% in August, reflecting continued dryness in the Pacific Northwest (June, July, August).
Paleoclimatic Perspective
Summer (June-August) 2005 Drought, Pre-Instrumental Perspective, West North Central-Northwest Illinois

Since March 2005, drought conditions have gripped portions of the upper Midwest, particularly northern Illinois. For northwest Illinois (Division 1), persistently dry conditions for the last six months resulted in a rapid decrease in the Palmer Drought Severity Index (PDSI) (see graph to left). By the end of August, the PDSI for Illinois Division 1 had reached -3.64, which is classified as severe drought.
How unusual is the current drought? The instrumental record can provide a century-long context to answer this question. On this time scale, the current summer (June-August) ranked as the fifth driest summer in the 1895-2005 record (see graph below left), while 2005 had the second driest March-August on record (graph below right). When long-term moisture conditions are factored in, the PDSI is not as extreme due to wetter conditions during the previous couple years, with the droughts of the 1930s, 1960s, 1970s, and 1980s reaching more severe magnitudes (see graph above). A longer window into past droughts requires proxy data such as tree rings.

The graph to the right shows a 329-year tree-ring reconstruction (1650-1978) of summer (June-August average) PDSI (annual values in light red; 5-year weighted mean in dark red) for an area centered on the northern border of Illinois, including most of Division 1. The reconstruction is one developed by Cook et al. (1999, 2004) in a gridded network covering much of North America. The reconstruction is based on tree-ring data from 28 sites in the Midwest. The correlation between the reconstructed and instrumental PDSI record over their common period (1900-1978) is very high (0.832). This particular instrumental record (annual values shown in light blue; 5-year weighted mean in dark blue) was calculated through only 2003, so the very similar Division 1 summer PDSI record is used to represent 2005 (blue dot).
Both the instrumental and reconstructed mean summer PDSI records for the 20th century show six years in the severe drought range (between -3.00 and -3.99) and a single year, 1934, that qualifies as extreme drought (below -4.00). For the period 1650-1900, the reconstruction indicates another four years of severe drought and seven years of extreme drought, with only one of those years (1736) comparable to 1934. Overall, drought conditions similar to or worse than those of 2005 occurred, on average, five years per century. The 20th century was notable for having a higher proportion of severe/extreme drought years than in the preceding 250 years, including the Dust Bowl years of 1930-1934, during which the average instrumental summer PDSI was -2.48. The tree-ring record shows only one period longer than 5 years, 1816-1821, with a lower average PDSI.
The current drought was very unusual in the speed of its onset, with PDSI dropping from slightly wet to severe drought in just five months. In the Illinois Division 1 instrumental record, this has occurred only once before, in 1936. But the drought's current severity has been matched or exceeded on numerous occasions in the past, according to both the instrumental and tree-ring records.
Resources:
- Divisional climate data, including PDSI for Illinois Division 1, can be obtained from NCDC.
- The PDSI reconstructions are available online from the NOAA Paleoclimatology Branch.
References:
- Cook, E. R., D. M. Meko, D. W. Stahle, and M. K. Cleaveland, 1999. "Drought reconstructions for the continental United States." Journal of Climate, 12:1145-1162.
- Cook, E. R., C. A. Woodhouse, C. M. Eakin, D. M. Meko, and D. W. Stahle, 2004. "Long-Term Aridity Changes in the Western United States." Science, 306(5698):1015-1018.