National Overview

On the national scale,
  • severe drought affected about 29 percent of the contiguous United States as of the end of May 2002, which is a jump of almost 7 percent when compared to the end of April;
  • the coverage of the current (November 1999-present) drought peaked in August 2000 at about 36% of the contiguous U.S., which was as extensive as the major droughts of the last 40 years, but not as large as the "dust bowl" droughts of the 1930's and 1950's;
  • the total drought area decreased to about 10 percent by November 2000, but has shown a general increasing trend for much of the period since then (see graph below left);
  • on a broad scale, the last two decades were characterized by unusual wetness with short periods of extensive droughts, whereas the 1930's and 1950's were characterized by prolonged periods of extensive droughts with little wetness (see graph below right);
  • although various parts of the U.S. have experienced unusually wet conditions during the last 31 months, little change occurred in the aggregate national wetness picture during much of this period;
  • the percentage of the nation severely wet has held steady at about three to eleven percent during this period, only recently falling below one percent (see graph below left);
  • a file containing the national monthly percent area severely dry and wet from 1900 to present is available;
  • historical temperature, precipitation, and Palmer drought data from 1895 to present for climate divisions, states, and regions in the contiguous U.S. are available at the Climate Division: Temperature-Precipitation-Drought Data page in files having names that start with "drd964x" and ending with "txt" (without the quotes).
Click here for graphic showing U.S. Drought and Wet Spell Area, 1996-present
larger image
Click here for graphic showing U.S. Drought and Wet Spell Area, 1900-present
larger image

Although some areas of the U.S. had above normal precipitation, many areas were very dry. Integrated across the nation, May 2002 precipitation averaged below normal. Twelve of the last 33 months have averaged well below the normal, while only three averaged well above normal (see graph top right). National 2001-2002 precipitation ranks:

Precipitation Ranks for the
Contiguous U.S., 2001-2002
Period Rank
May 30th driest
Apr-May 27th driest
Mar-May 47th driest
Feb-May 16th driest
Jan-May 10th driest
Dec-May 17th driest
Nov-May 29th driest
Oct-May 25th driest
Sep-May 28th driest
Aug-May 28th driest
Jul-May 28th driest
Jun-May 33rd driest
Click here for graphic showing U.S. Precipitation Departure and Normals, January 1998-present
larger image
Click here for graphic showing U.S. Precipitation, May, 1895-2002
larger image

Regional Overview

May was very dry across much of the western U.S. and adjoining Great Plains, the Gulf Coast, and parts of the mid-Atlantic states. Near-normal precipitation fell across part of the Pacific Northwest, mainly Washington and the extreme northern Rockies. Beneficial rains continued for a third month bringing drought relief to a good part of the Northeast. May was wet at the primary stations in Hawaii, dry at many stations in Puerto Rico, and showed a mixed pattern across Alaska.

These overall conditions are evident in the following indicators:

Two other drought-related monitoring tools are the Vegetation Health Index and the Keetch-Byram Drought Index:

  • NOAA satellite observations of vegetation health from early June revealed stress on vegetation across much of the southwestern U.S. and in parts of the Plains and northern and central Rockies.
  • The USDA Forest Service uses a satellite-based vegetation health index tool to monitor the risk of wildfires. This Greenness Index for mid-May revealed above-average stress on vegetation across much of the West and Great Plains, extending into the Great Lakes region.
  • The Keetch-Byram Drought Index (KBDI) is used by the Wildland Fire Assessment System to monitor the risk of wildfires. The early June KBDI showed dry conditions in the Desert Southwest, parts of the central and northern Rockies, and from the southern Plains to the mid-Atlantic coast. The Forest Service fire danger analysis indicated a high risk of wildfires in the Southwest, across much of the Great Plains, and in parts of the southern Great Lakes and New England. The fire threat conditions can change rapidly from week to week.


Western U.S. Drought

While beneficial rain and snow fell across part of the Pacific Northwest, mainly Washington and the extreme northern Rockies, short-term drought characterized the conditions across much of the western U.S. during May. Water year (October 2001-present) precipitation totals were above average in the northwest, but totals dropped precipitously toward the Rockies and the Southwest. Snowpacks were essentially melted for this water year except for the higher elevations of the northern Rockies, northern Cascades, and Canada.

A detailed discussion of drought conditions in the western U.S. can be found for the following regions:

Dry conditions in the western U.S. stretched from the Canadian border to the Mexican border. As illustrated in the North America vegetation health index map to the right below, the drought did not stop at the borders. According to news reports (Reuters),

  • several stations in the Canadian prairie provinces of Saskatchewan and Alberta had a record or near-record dry May this year
  • forest and grass fires, dust storms, and drying water holes have accompanied the dry weather
  • with dryness throughout the central and southern areas of the plains provinces of Manitoba, Saskatchewan and Alberta, some experts now believe between one half to two thirds of Canada's western grainbelt is suffering from a moisture deficit
  • five counties in eastern Alberta, along the border with Saskatchewan, have already declared an agricultural disaster
  • for many farmers, this is the third, or even fourth year of drought.
Click here for map showing June 2, 2002, North America Vegetation Health Index
larger image

The drought in the western U.S. extended into the adjoining portions of the Great Plains. The precipitation deficits across this entire region, stretching from the High Plains to the West Coast, have ranked in the top ten driest category (out of 107-108 years) for all seasons from May back to June-May (see table below). The deficits have persisted, in some cases, for three years (see table, and top graph below right). This region experienced a rapid intensification of the Palmer Hydrological Drought Index (PHDI) in 2000 (see bottom graph below right), which was compounded by numerous wildfires that summer. The regional PHDI has reached levels this May comparable to those of summer 2000.
Precipitation Ranks for the
High Plains to West Coast Region, 2001-2002
Period Rank
May 3rd driest
Apr-May 5th driest
Mar-May 5th driest
Feb-May 3rd driest
Jan-May 4th driest
Dec-May 6th driest
Nov-May 9th driest
Oct-May 6th driest
Sep-May 3rd driest
Aug-May 2nd driest
Jul-May 3rd driest
Jun-May 3rd driest
Click here for graphic showing High Plains to West Coast Region Precipitation Anomalies, January 1998 - present
larger image

Click here for graphic showing High Plains to West Coast Region Palmer Hydrological Drought Index, 1895-2002
larger image


Central U.S. Drought

May 2002 was unusually dry across much of the central U.S., from the High Plains of Montana and the Dakotas to southern Texas. This month was a continuation of dryness which extended back for a year or longer for some of these areas.

The West North Central region, which consists of the western states Montana and Wyoming and the Great Plains states North and South Dakota and Nebraska, has had six consecutive months of near to below-normal precipitation (see top graph below). Dryness during most of the last ten months has given the region a rank of second driest August-May (see bottom graph below).

Precipitation Ranks for the
West North Central Region, 2001-2002
Period Rank
May 9th driest
Apr-May 10th driest
Mar-May 10th driest
Feb-May 6th driest
Jan-May 6th driest
Dec-May 3rd driest
Nov-May 5th driest
Oct-May 3rd driest
Sep-May 3rd driest
Aug-May 2nd driest
Jul-May 9th driest
Jun-May 10th driest
Click here for graphic showing West North Central region precipitation departures, January 1998 - present
larger image

Click here for graphic showing West North Central region precipitation, August-May, 1895-2002
larger image

Some Montana drought impacts:
  • Up to 400,000 acres of winter wheat, which relies on snow and rain, rather than irrigation, that were seeded last autumn were written off. National winter wheat levels are at their lowest point since 1978 (The Arizona Republic).
  • As noted by the USDA, Montana farmers were forced to abandon more than 20 percent of the state's winter wheat for the second consecutive year in 2002, which is the first such occurrence since 1935-36 and 1936-37.
  • The USDA will provide the state's agricultural producers with payments for cover crops and no-till farming in an effort to control wind erosion and prevent dust storms (Reuters 5/29).
  • By the first week of June, conditions for at least 40 percent of the range and pastures in the state were rated poor to very poor according to the U.S. Department of Agriculture.

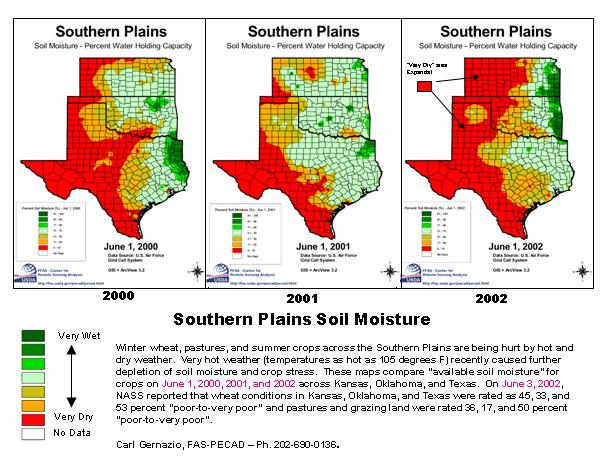
May marked the second consecutive dry month, regionwide, for the South region. There has been considerable variability within this region, with the western and southern portions of the South region being hardest hit by drought (see map to right for short-term soil moisture conditions). Some drought impacts:
  • According to the USDA, winter wheat, pastures, and summer crops across the Southern Plains are being hurt by hot and dry weather.
  • In early June, the USDA NASS reported that wheat conditions in Kansas, Oklahoma, and Texas were rated as 45, 33, and 53 percent poor to very poor.
  • In Kansas, agricultural extension agents are saying a million acres of agricultural land may have to be abandoned this year because of the drought (The Arizona Republic).
Click here for graphic showing Southern Plains soil moisture, April 1, 2002
larger image

Precipitation Ranks for the
South Region, 2001-2002
Period Rank
May 28th driest
Apr-May 20th driest
Mar-May 38th driest
Feb-May 27th driest
Jan-May 27th driest
Dec-May 42nd driest
Nov-May 53rd wettest
( 55th driest)
Oct-May 52nd driest
Sep-May 51st wettest
( 57th driest)
Aug-May 46th wettest
( 62nd driest)
Jul-May 52nd driest
Jun-May 53rd wettest
( 55th driest)
Click here for graphic showing South region precipitation departures, January 1998 - present
larger image

Click here for graphic showing South region precipitation, April-May, 1895-2002
larger image


Eastern U.S. Drought
May marked the third consecutive wet month across much of the Northeast region, bringing drought relief to much of the area. However, long-term deficits remain, with June 2001-May 2002 ranking as the 21st driest June-May on record. In the Southeast, this was the second consecutive month with dry conditions averaged across the region. May dryness was especially acute across the Gulf coast and in North Carolina.

Precipitation Ranks for the
Southeast Region, 2001-2002
Period Rank
May 30th driest
Apr-May 12th driest
Mar-May 28th driest
Feb-May 18th driest
Jan-May 22nd driest
Dec-May 15th driest
Nov-May 12th driest
Oct-May 7th driest
Sep-May 11th driest
Aug-May 10th driest
Jul-May 10th driest
Jun-May 21st driest
Click here for graphic showing Southeast region precipitation departures, January 1998 - present
larger image

Click here for graphic showing Southeast region precipitation, October-May, 1895-2002
larger image

Pacific Northwest

The southern parts of the Pacific Northwest (mainly Oregon and southern Idaho) were dry during May, giving the region a rank of 28th driest May (see table and graphic below).
  • By the end of May, the Idaho Department of Water Resources had issued drought emergency declaration orders for 7 counties during 2002.
  • According to media reports (The Idaho Statesman), hundreds of mostly domestic wells in eastern Idaho have dried up from the ongoing drought.

On balance, however, the 2001-2002 wet season ranked near the middle of the historical distribution for the region as a whole (see table below).

Precipitation Ranks for the
Northwest Region, 2001-2002
Period Rank
May 28th driest
Apr-May 54th wettest
( 55th driest)
Mar-May 51st wettest
( 58th driest)
Feb-May 35th driest
Jan-May 41st driest
Dec-May 54th driest
Nov-May 43rd wettest
( 65th driest)
Oct-May 43rd wettest
( 65th driest)
Sep-May 48th wettest
( 60th driest)
Aug-May 52nd wettest
( 56th driest)
Jul-May 49th wettest
( 57th driest)
Jun-May 49th wettest
( 59th driest)
Click here for graphic showing Northwest region precipitation departures, January 1998 - present
larger image

Click here for graphic showing Northwest region precipitation, May 1895-2002
larger image

West Region (CA-NV)

The 2001-2002 wet season started out wet for the West region. The weather turned drier than normal in January, with May 2002 marking the fifth consecutive month with below-normal precipitation regionwide (see top graphic below right). January-May 2002 ranked as the seventh driest January-May in the 108-year record (see bottom graphic below right).

The Southwest and southern California are ripe for the riskiest fire season ever, said Edy Williams-Rhodes, fire management director for the Forest Service's southwestern region (NBC News).

Precipitation Ranks for the
West Region, 2001-2002
Period Rank
May 27th driest
Apr-May 18th driest
Mar-May 13th driest
Feb-May 8th driest
Jan-May 7th driest
Dec-May 15th driest
Nov-May 28th driest
Oct-May 24th driest
Sep-May 23rd driest
Aug-May 21st driest
Jul-May 24th driest
Jun-May 20th driest
Click here for graphic showing West region precipitation departures, January 1998 - present
larger image

Click here for graphic showing West region precipitation, January-May 1895-2002
larger image

Southwest Region

May 2002 marked the twelfth consecutive month with near to much below normal precipitation for the Southwest region (see top graph below right). This has resulted in the driest or second driest month or season for each of the twelve periods from May back to June-May (see table below) and caused the regional Palmer Hydrological Drought Index to plummet, reaching levels comparable to the worst drought episodes of the last 100 years (see bottom graph below right).

Precipitation Ranks for the
Southwest Region, 2001-2002
Period Rank
May 2nd driest
Apr-May 2nd driest
Mar-May 1st driest
Feb-May 2nd driest
Jan-May 2nd driest
Dec-May 1st driest
Nov-May 1st driest
Oct-May 1st driest
Sep-May 1st driest
Aug-May 1st driest
Jul-May 2nd driest
Jun-May 1st driest
Click here for graphic showing Southwest region precipitation departures, January 1998 - present
larger image

Click here for graphic showing Southwest region Palmer Hydrological Drought Index, January 1900-May 2002
larger image

The drought has had significant impacts across the region:
  • By the first week of June, conditions for at least 80 percent of the range and pastures in Arizona, New Mexico, and Colorado were rated poor to very poor according to the U.S. Department of Agriculture.
  • According to media reports (NBC News):
    • In Utah, reservoirs were about half full and streams were running below 50 percent of normal. Officials warned of irrigation cutbacks from 20 percent to 100 percent.
    • In Arizona, some ranchers were liquidating herds.
    • Nevada's Lake Mead was at its lowest level in 30 years as water was redirected from Hoover Dam to other watersheds. Deer hunting quotas have been cut because the herd is decimated.
    • In New Mexico, water was flowing at less than 10 percent of average on the Rio Grande, the lowest level in 102 years.

Click here to go to Top of Page Wildfires

Numerous wildfires occurred during May, with the possibility of a very active wildfire season for summer 2002. Some highlights:
  • The current drought covers much of the same region as it did in 2000 when wildfires burned approximately 8.4 million acres (3.4 million hectares) in the U.S.
  • By early June 2002, wildfires had burned more than 1.3 million acres (526,000 hectares) in the U.S., approximately 100,000 more acres (40,000 hectares) than for the same period in 2000, which was one of the worst wildfire seasons in 50 years.
  • Unlike 2000, when only 22% of the contiguous U.S. was in severe to extreme drought at the end of May (based on the Palmer Hydrological Drought Index), the same level of drought severity now affects more than 29% of the U.S. with the potential for worsening conditions as the country enters the summer season.
  • By the end of May 2002, the Palmer Hydrological Drought Index, integrated across the summer 2000 wildfire region, had reached levels comparable to the severity experienced during the peak (July-September) of the summer 2000 fire season.
  • From MSNBC News:
    • The fires have been fueled by some of the driest conditions on record, ravaging ranches and wildlife, and taxing firefighting resources brought on months ahead of schedule. Every one knows the hottest and driest months are still ahead. "This is by far the most aggressive fire season I've ever seen," said Bill Wilcox, a fire management officer for Arizona's Coronado National Forest.
    • The Southwest and Southern California are ripe for the riskiest fire season ever, said Edy Williams-Rhodes, fire management director for the Forest Service's southwestern region.

Click here for graphic showing satellite picture of Colorado wildfires
larger image
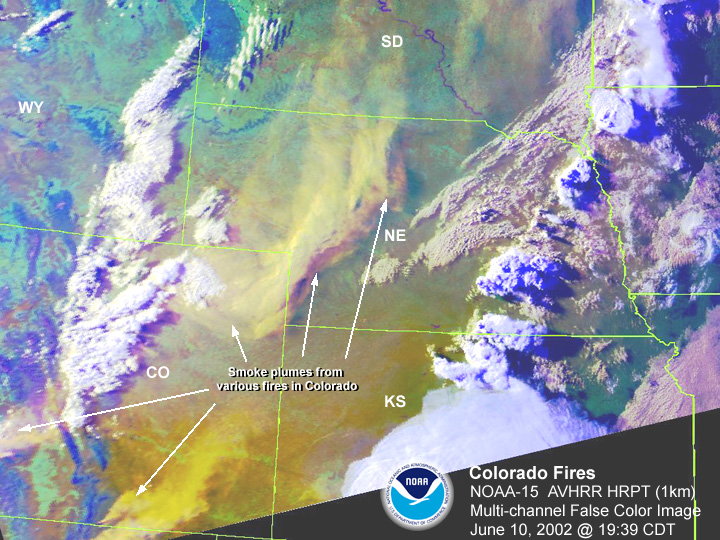
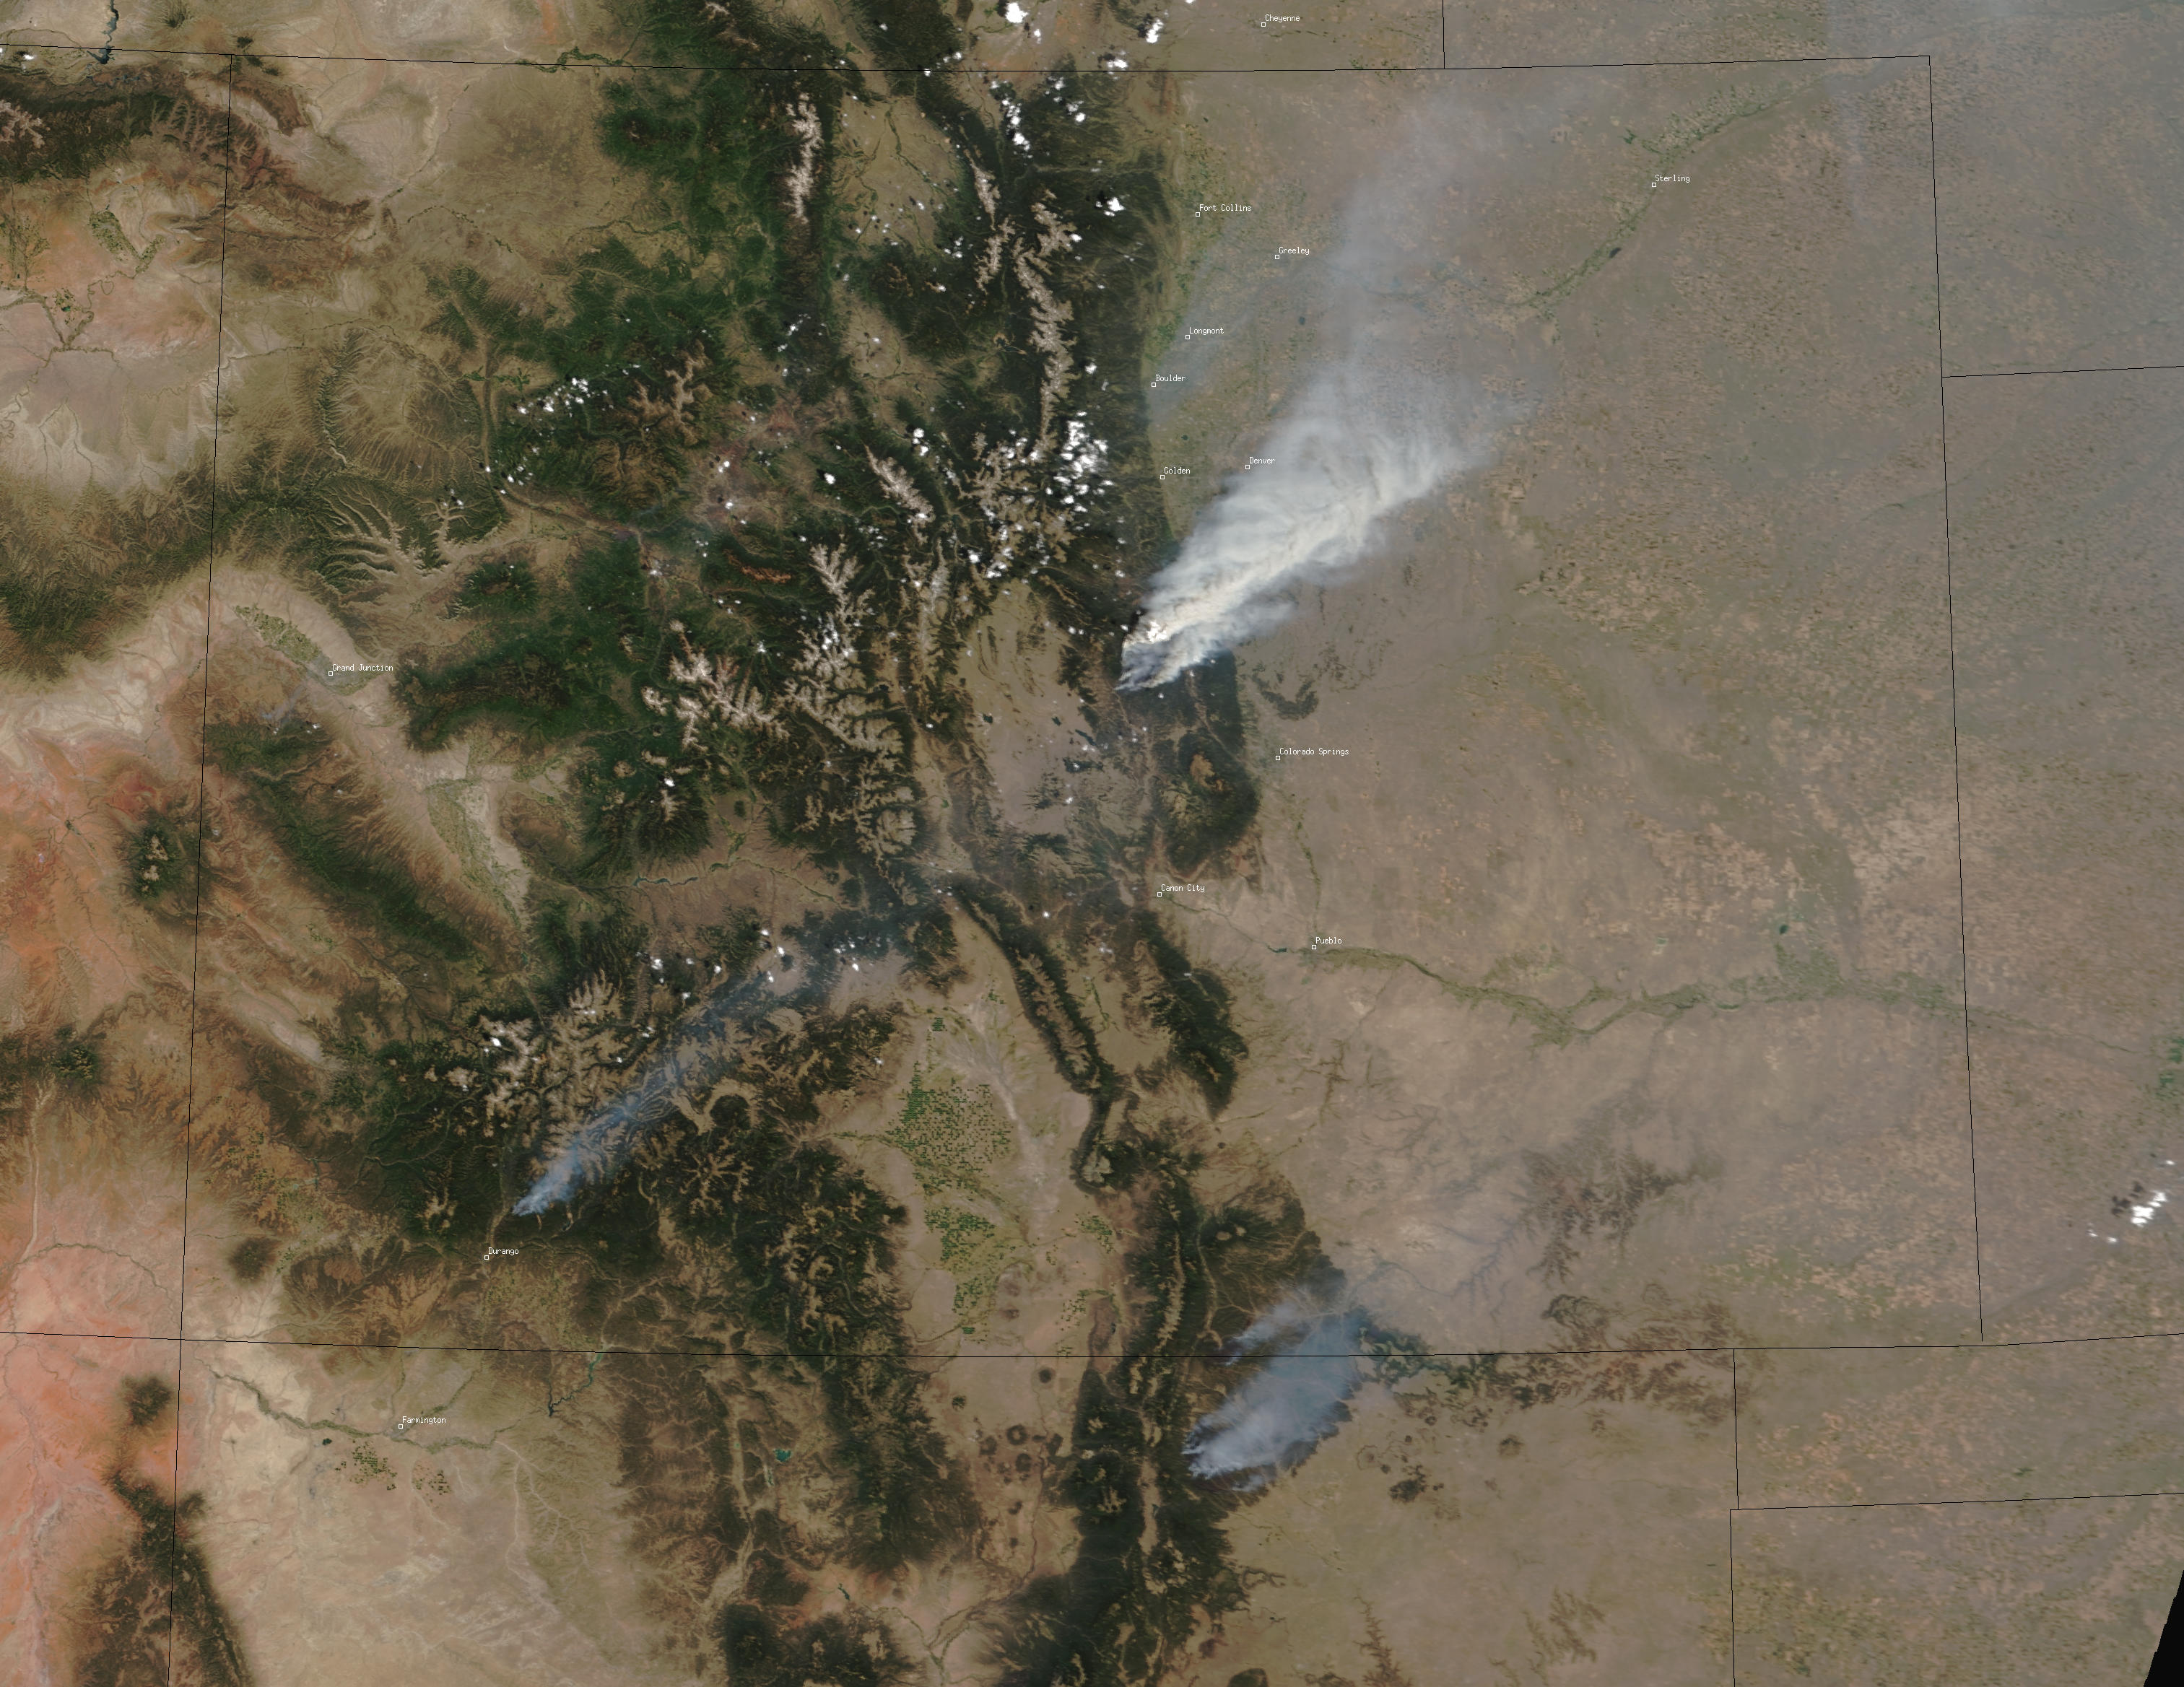
The picture to the left was prepared by the National Climatic Data Center from visible satellite imagery and shows smoke plumes from the fires in Colorado on June 10. Additional satellite pictures of the Colorado fires are available from the Space Science and Engineering Center at the University of Wisconsin-Madison.

Wildfires result from a combination of weather factors including low precipitation which parches the vegetation and soil, low humidity, and a trigger mechanism such as dry lightning storms or campfires. Hot, windy weather helps to fan the flames.

The Standardized Precipitation Index (SPI) and Palmer Z Index are used as measures of short-term drought. Research by Tom Karl (1986) suggests that the Z Index may be a useful indicator of fire potential. The SPI (see maps to right) illustrate the magnitude of the dryness over the Southwest during May and spring. The Z Index map (below) shows the combination of hot and dry weather during May.

Click here for map showing Palmer Z Index, May 2002

larger image
Click here for map showing Standardized Precipitation Index, May 2002
larger image

Click here for map showing Standardized Precipitation Index, March-May 2002
larger image

Reference:

Karl, T.R., 1986. "The sensitivity of the Palmer Drought Severity Index and Palmer's Z-Index to their calibration coefficients including potential evapotranspiration." Journal of Climate and Applied Meteorology, 25:77-86.


Click here to go to Top of Page Paleoclimatic Record

NOAA's Paleoclimatology Program utilizes data from sources other than instrumental weather records (what are called proxy data which include, for example, tree rings, ice cores, and pollen analysis) to understand and model interannual to century-scale environmental variability. Proxy data have been used to reconstruct drought indices going back several hundred years to provide a long-term perspective on drought variability, particularly when it comes to multi-decadal droughts that have occurred prior to comprehensive instrumented records. Such an expanded view provides insight into what a "normal" climatic range is for a region.

Click here for graphic showing Southwest region tree ring drought index, 1700-present
larger image
The graph to the left is a 300-year record of the June-August Palmer Drought Severity Index reconstructed using tree ring data for the Southwest region (the methodology is discussed in an article by Cook et al., 1999; details are also available at the NOAA Paleoclimate web site). The tree ring data successfully reproduce the droughts of the early 1900's, 1930's, and 1950's, although due to its nature it is a conservative index of severity. The reconstructed index shows that droughts as severe as the worst during the 20th century have occurred many times during the past 300 years. In fact, the most severe drought in the tree ring-based index occurred during the first half of the 1700's.

The graph to the right shows the April 1 snow water equivalent (SWE) for the Gunnison River Basin in Colorado, reconstructed from tree rings, for the 1569-1999 period (an article by Woodhouse discusses details; similar research is described at the NOAA Paleoclimate web site). The values are expressed as a percentage of the 1971-1999 average. The SWE for April 1, 2002, was about 50% (not shown on graph). In the instrumental record for this basin (1938-2002), 1977 was the only year besides 2002 at 50% or less than the average. In the 431-year reconstruction, only four years (1598, 1654, 1851, and 1977) were at 50% or less than the 1971-1999 average. Click here for graphic showing April 1 snow water equivalent for Gunnison River Basin, Colorado, 1569-1999
larger image

References:

Cook, E.R., Meko, D.M., Stahle, D.W. and Cleaveland, M.K. 1999. "Drought reconstructions for the continental United States." Journal of Climate, 12:1145-1162.

Woodhouse, C.A. In review. "A 431-year reconstruction of western Colorado snowpack." Journal of Climate.


Click here to go to Top of Page Colorado Drought

Click here for graphic showing Colorado statewide precipitation, December-May, 1895-2002
larger image
In Colorado, May marked the sixth consecutive month with below to much below normal precipitation statewide (see top graph below right). The deficits have been so severe that previous dry records have not been just broken, they have been shattered (see December-May graph to left). The persistent extreme short-term dryness, month after month, has resulted in the statewide long-term Palmer Hydrological Drought Index reaching levels more severe than the droughts of the 1950's and 1960's (see bottom graph below right). It should be noted that previous severe droughts have lasted much longer than the current drought.

Statewide Precipitation Ranks
for Colorado, 2001-2002
Period Rank
May 3rd driest
Apr-May 2nd driest
Mar-May 1st driest
Feb-May 1st driest
Jan-May 1st driest
Dec-May 1st driest
Nov-May 1st driest
Oct-May 1st driest
Sep-May 1st driest
Aug-May 2nd driest
Jul-May 2nd driest
Jun-May 1st driest
Click here for graphic showing Colorado statewide precipitation departures, January 1998 - present
larger image

Click here for graphic showing Colorado statewide Palmer Hydrological Drought Index, January 1900-May 2002
larger image

The drought in Colorado brought an early start to the fire season and has severely impacted agriculture (Boulder Daily Camera). According to media reports:
  • Several fires in Colorado, started by carelessly lit campfires and other human activities, have destroyed hundreds of homes and businesses and forced the evacuation of thousands of residents and park visitors. Federal lands in five Colorado counties have been closed to all uses and the state has banned all public use of fire on all federal lands throughout Colorado's borders. "This is a potential tragedy of epic proportions, and the fire season isn't even upon us," Governor Bill Owens said (Environment News Service).
  • All of Colorado's 64 counties have been designated federal disaster areas by the USDA because of the ongoing drought, in what farmers are calling the worst dryness in a half-century (AP 5/30).
  • Snowpack levels are at all-time lows. Denver will shut off 14 public fountains this summer (NBC).

Click here to go to Top of Page Arizona Drought

In Arizona, May marked the 13th consecutive month with near to much below normal precipitation statewide (see top graph below right). The persistent extreme short-term dryness, month after month, has resulted in the statewide long-term Palmer Hydrological Drought Index reaching levels as severe as the droughts of the last 90 years (see bottom graph below right). As with Colorado, some previous severe droughts in Arizona have lasted much longer than the current drought.

Statewide Precipitation Ranks
for Arizona, 2001-2002
Period Rank
May 3rd driest
Apr-May 9th driest
Mar-May 2nd driest
Feb-May 2nd driest
Jan-May 2nd driest
Dec-May 2nd driest
Nov-May 2nd driest
Oct-May 2nd driest
Sep-May 1st driest
Aug-May 2nd driest
Jul-May 3rd driest
Jun-May 1st driest
Click here for graphic showing Arizona statewide precipitation departures, January 1998 - present
larger image

Click here for graphic showing Arizona statewide Palmer Hydrological Drought Index, January 1900-May 2002
larger image

The drought has had significant impacts on parts of Arizona. Some highlights:
  • According to The Arizona Republic, wildlife has been devastated and reservoir, lake, and streamflow levels have dropped to record or near-record lows. The fire danger is high across the state, and the city of Flagstaff implemented mandatory outdoor watering restrictions during May. Rangers have noted the impact of the drought on forests: "Douglas fir trees are beginning to die of a lack of water, and even drought-resistant trees such as junipers and piņon pines are starting to show stress."
  • On May 17, Agriculture Secretary Ann M. Veneman designated the entire state of Arizona as a drought disaster area.
  • Governor Jane Hull activated a state emergency drought response plan and formed a drought task force coordinated through the state Agriculture Department and the Division of Emergency Management.
  • Cattlemen have been severely impacted. According to The Arizona Republic, while most of the state's farmers have enough water this year, some already are hurting, and all fret about next year's cattle and crops if the drought continues.
  • The drought has seriously impacted the Navajo Nation. According to news reports (The Arizona Republic):
    • More than 7,000 stock ponds are dry across 17 million acres of the reservation in Arizona, New Mexico and Utah. Many of the tribe's 900 windmills, most of them pumping groundwater from shallow, subsurface pools, are expected to stop producing within the next month.
    • Thousands of head of livestock, as well as the tribe's world-famous rural traditions, are threatened.
    • People have described the drought with words like: "desperate situation", "never seen a drought like this before", "it looks like another planet".
  • The Tohono O'odham Nation declared a state of emergency by month's end as dwindling water supplies threatened livestock (The Arizona Republic).
  • According to an early June drought situation report by the Arizona Division of Emergency Management:
    • Marginal snowpack conditions and well below normal winter rainfall resulted in very low streamflow and reservoir levels in the state. Winter precipitation amounts have been well below normal for six of the last seven years, leading to a serious drought outlook for the next several months.
    • Water supply problems are expected in many parts of the state, although no critical shortages had developed by the beginning of June. Eight counties, and the Navajo and Tohono O'odham Nations, have declared drought emergencies.
    • The wildland fire season has been exceptionally active so far, due to the very dry condition of the grasses in the rangelands, and because of the warm, dry, and windy conditions.
  • As noted by The Arizona Republic, "the current drought is the state's worst drought since the 1950s, and although it doesn't rival the 1890s, when it was so dry and windy that a good 6 inches of the state's topsoil blew away, the state is parched. We have the genesis of the worst fire season and the worst drought in history, according to the Arizona Farm Bureau."

Alaska Dryness

May 2002 continued a pattern of below-normal precipitation for much of coastal southern Alaska and the Alaska panhandle. As noted by the National Weather Service office in Juneau, dry conditions this spring in Alaska have begun to produce adverse effects:
  • several stations in the panhandle had the driest spring on record
  • low water levels in area lakes caused power generation shortfalls in some hydroelectric plants
  • the wildfire danger increased across the panhandle and some burn bans were issued
According to Chris Maier, Warning Coordination Meteorologist at the National Weather Service Forecast Office in Juneau: "An unusually persistent high pressure ridge has been over our region since March. This has kept the main storm track away from southeast Alaska. The result so far has been a record breaking dry spell for most of the Panhandle. Another impact of this blocking weather pattern is that our temperatures at night have been colder than normal due to the lack of clouds. If our precipitation stays below normal into June, we will actually be talking about drought conditions in southeast Alaska."

As noted by media reports, hot, dry, windy weather near the end of May fanned numerous forest fires across parts of the state. By early June, the year-to-date (January 1-June 4) acreage burned exceeded 400,000 acres, which is 26 times the average and three and a half times the total acres for the same time of year for the previous 7 years combined (BLM - Alaska Fire Service). The drought code used by the Alaska Fire Service had moderately dry conditions extending from the southern coast into east central Alaska, with a high risk of wildfires in early June extending across the interior portions of the state.

Click here for map showing May 2002 percent of normal precipitation
larger image
Click here for map showing spring (March-May) 2002 percent of normal precipitation
larger image

The May and spring dryness in southern coastal Alaska and the panhandle are evident in the percent of normal precipitation maps (above) and in the departure from normal number of days with measurable precipitation (map below left), and to a lesser degree in the maximum number of consecutive days with no measurable precipitation map (below right).

Click here for map showing spring (March-May) 2002 departure from normal number of days with measurable precipitation
larger image
Click here for map showing spring (March-May) maximum number of consecutive days with no measurable precipitation
larger image

Damage due to the drought has been summarized by NOAA and the Office of Global Programs in the Climatological Impacts section of the Climate Information Project. Crop impact information can be found at the USDA NASS (National Agricultural Statistics Service) and Weekly Weather and Crop Bulletin pages. Drought statements by local National Weather Service Offices can be found at the NWS Hydrologic Information Center. Drought threat assessments and other information can be found at NOAA's Drought Information Center. Additional drought information can be found at the National Drought Mitigation Center, the USDA's National Agricultural Library, the interim National Drought Council, and the NOAA Paleoclimatology Program. The following states have set up web pages detailing current drought conditions and/or their plans to handle drought emergencies:
Colorado - Delaware - Delaware River Basin (DE-NJ-NY-PA) - Florida Panhandle - Georgia - Hawaii - Idaho - Kentucky - Maine - Maryland - Missouri - Montana-1 - Montana-2 - Nebraska - New Jersey-1 - New Jersey-2 - New Jersey-3 - New Mexico - North Carolina - Oklahoma-1 - Oklahoma-2 - Oklahoma-3 - Oregon-1 - Oregon-2 - Pennsylvania-1 - Pennsylvania-2 - Pennsylvania-3 - South Carolina - Texas - Vermont - Virginia - Washington - Wyoming

For additional information on current and past wildfire seasons please see the National Interagency Fire Center web site or the U.S. Forest Service Fire and Aviation web site.

NCDC's Drought Recovery Page shows the precipitation required to end or ameliorate droughts and the probability of receiving the required precipitation.

Additional climate monitoring graphics can be found at the Climate Prediction Center's monitoring pages:

Drought conditions on the Canadian prairies can be found at the Agriculture and Agri-Food Canada Drought Watch page.


Citing This Report

NOAA National Centers for Environmental Information, Monthly Drought Report for May 2002, published online June 2002, retrieved on April 24, 2024 from https://www.ncei.noaa.gov/access/monitoring/monthly-report/drought/200205.