Index
- Alaska Climate Divisions FAQs
- Anomalies vs. Temperature
- Arctic Sea Ice Measurements
- Billion-Dollar Disasters: Calculating the Costs
- Binomial Filter
- Climate Division Dataset Transition
- Climate Extremes Index
- CLIMAT Messages
- Climatological Rankings
- Coral Reef Bleaching
- Dead Fuel Moisture
- Definition of Drought
- Drought Indicators
- Drought in the Colorado River Basin
- Drought vs. Aridity
- El Niño: A Historical Perspective
- Explanation of the 500 mb Flow
- Future Drought
- Global Precipitation Percentile Maps
- Global Regions Definitions
- Global Temperature Anomaly Percentile Maps
- Global Temperature Uncertainty
- Groundwater Drought Indicators
- Hawaiʻi Climate Divisions FAQs
- LOESS
- Measuring Drought
- Monthly Releases
- Monthly Report RSS Feed
- National Data Flow
- nClimDiv Maximum and Minimum Temperatures
- Palmer Drought Index
- Potential Evapotranspiration
- Reforestation of Bastrop Lost Pines
- Regional Climate Centers
- Regional Snowfall Index (RSI)
- Satellite-Based Drought Indicators
- Soil Moisture Water Balance Models
- Southern Hemisphere Snow Cover Extent
- Standardized Precipitation Index
- Streamflow Drought Indicators
- Subtropical Highs
- Tornado Count
- U.S. Climate Divisions
- U.S. Climate Normals
- U.S. Drought Monitor Scale
- USHCN Version 2.5 Transition
- Water Supply vs. Water Demand
Arctic Sea Ice Measurements
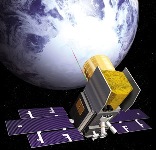
Measuring Arctic sea ice extent accurately from the ground is nearly impossible. The ice edge is constantly shifting, and the area it covers is vast—on average, more than twice the size of Canada. Because of this, scientists rely on satellites to track sea ice. Since the 1970s, polar-orbiting satellites have been collecting data over both the Arctic and Antarctic. These satellites use a combination of visible imagery and microwave radiometry to estimate how much of the ocean is covered by ice. Each method has its strengths and limitations, but together they give scientists a reliable picture of sea ice conditions. Today, a network of satellites operated by NASA, NOAA, and the Department of Defense provides daily, monthly, and annual measurements of sea ice extent. More information about these measurements and data sources can be found through the National Snow and Ice Data Center.
Determining the sea ice boundary is more complex than it appears. The transition from solid ice to open water often occurs gradually over a broad area. To define the extent of sea ice in satellite data, scientists use a threshold based on ice concentration—the percentage of a given area covered by ice. NOAA uses a 15% threshold, meaning any area with at least 15% ice cover is counted as part of the ice extent. This approach provides the best agreement between satellite observations and conditions on the ground. At this level of concentration, ocean waters are generally navigable by ships, which was one of the original motivations for closely monitoring changes in Arctic sea ice.