
Gridded Satellite (GridSat) GOES/CONUS (Geostationary Operational Environmental Satellites/Continental United States) data were created to make it easier to use GOES data. GridSat-GOES and CONUS are the same formats and files, however, they provide data for two separate domains - the CONUS and the entire GOES domain.

Access Methods
Bulk Download
Subsets by Timeframe and Location
The THREDDS data server can be used to download specific portions (subsets) of the data based on specific time-frames or geographic coordinates. Subsets are available in netCDF format.
Data Browser
Use the NOAA Weather and Climate Toolkit to easily view and browse data. This tool can create maps based on time and location selection, produce images in multiple formats (PNG, GIF, JPEG, text or GIS Shapefiles), and even save movie loops.
You can help the project receive continued updates by completing our voluntary User Registration Form.
Citation
Please cite the following article when using GridSat-GOES/CONUS data in any publication:
Knapp, K. R. and S. Wilkins, 2017: Gridded Satellite (GridSat) GOES and CONUS data; Earth Systems Science Data, 10(3). doi:10.5194/essd-10-1417-2018.
Please note that there is a separate citation when using GridSat-B1 CDR data.
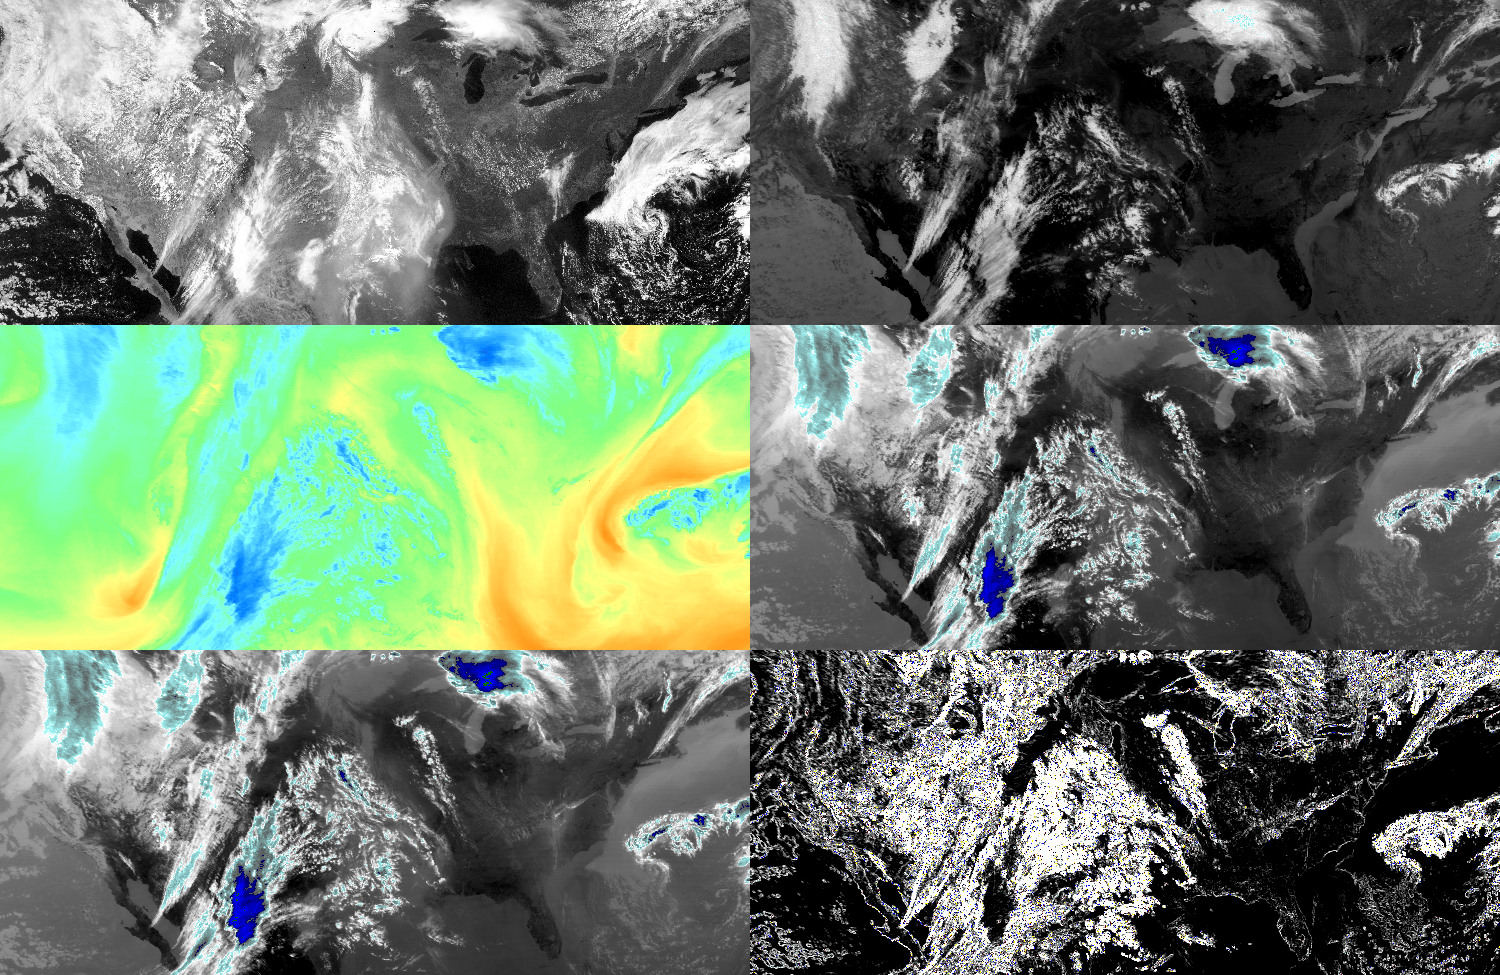
The following tables summarize dataset variables and attributes. This overview is supplemented by the dataset attributes available in the file, which can be viewed using various tools (like ncdump). Ncdump samples of the file headers are available for Nov-13-1999 for GOES and CONUS files. Information not provided below is available in the netCDF attributes (e.g., units of the variables).
Spatial Variables
The following table summarizes the variables with the following spatial dimensions:
- GOES: Lon x Lat = 5375 x 3750
- CONUS: Lon x Lat = 1500 x 650
| Name | Dimensions | Purpose |
|---|---|---|
| ch1 | (lat,lon) | Channel 1 scaled radiance (visible channel, ~0.63 micons) |
| ch2 | (lat,lon) | Channel 2 brightness temperature (Near IR channel, ~3.9 microns) |
| ch3 | (lat,lon) | Channel 3 brightness temperature (IR water vapor, ~6.7 microns) |
| ch4 | (lat,lon) | Channel 4 brightness temperature (IR window, ~11 microns) |
| ch5 | (lat,lon) | Channel 5 brightness temperature (IR split window, ~12 microns) - Not available after GOES-11 |
| ch6 | (lat,lon) | Channel 6 brightness temperature (IR CO2 channel, ~13 microns) - Not available before GOES-12 |
| ch1v | (lat,lon) | Spatial standard deviation of the 3x3 visible pixels centered on the grid cell center (calculation performed at the original visible ~1km resolution) |
| ch4v | (lat,lon) | Spatial standard deviation of the 3x3 IR pixels centered on the grid cell center (calculation performed at the original IR resolution) |
| delta_time | (lat,lon) | Difference in time between the optimal image time and the actual scan time |
Other Variables
| Name | Purpose |
|---|---|
| satlat | Latitude at sub-satellite point |
| satlon | Longitude at sub-satellite point |
| satrad | Distance (radius) of the satellite from the center of Earth |
| filename | List of filenames used in constructing this grid |
Calculating Brightness Temperatures
NetCDF values are stored as integers and can be converted to floats following the Climate and Forecasting (CF) convention and the variables attributes:
Value = Integer * scale_factor + add_offset
Many of the available netCDF access tools perform this adjustment automatically. More information on data storage is provided in documentation of the netCDF CF convention.
Calculate Actual Observation Time
The GridSat observations have optimal observation times at fixed intervals: 15-min for CONUS and 60-min for GOES. Some calculations require accurate observation times, for example, when calculating solar geometry. The actual observation time is calculated using the netCDF variable: delta_time, which is provided in minutes from the optimal grid time. The following equation can be used:
Actual_Time = Optimal_Time + delta_time
Registration
You can help the project receive continued updates and improvements by completing our optional User Registration Form.
Features
Mapped
The data are provided in an equal-angle grid with 0.04 degree latitude resolution.
Calibrated
The IR channel data are provided in brightness temperatures (calibrated using operational coefficients) and the visible channel has been calibrated following a peer-reviewed paper.
Reformatted
The data are provided in netCDF following the CF (Climate and Forecasting) Convention
Fixed Times
GOES data has a complex schedule with upwards of 100 scans per day providing different regions at different times. GridSat provides information at fixed intervals, by selecting the closest scan (in time) for any given pixel.
Status
- Version: v01
- Last updated: Sept 2019
- Period of record: Oct 1994 - Dec 2017
- Update frequency: Yearly
- Known Issues:
- It is unlikely we will be able to process similar data for GOES-R series
- Items reported to NCEI regarding data quality will be reported here.
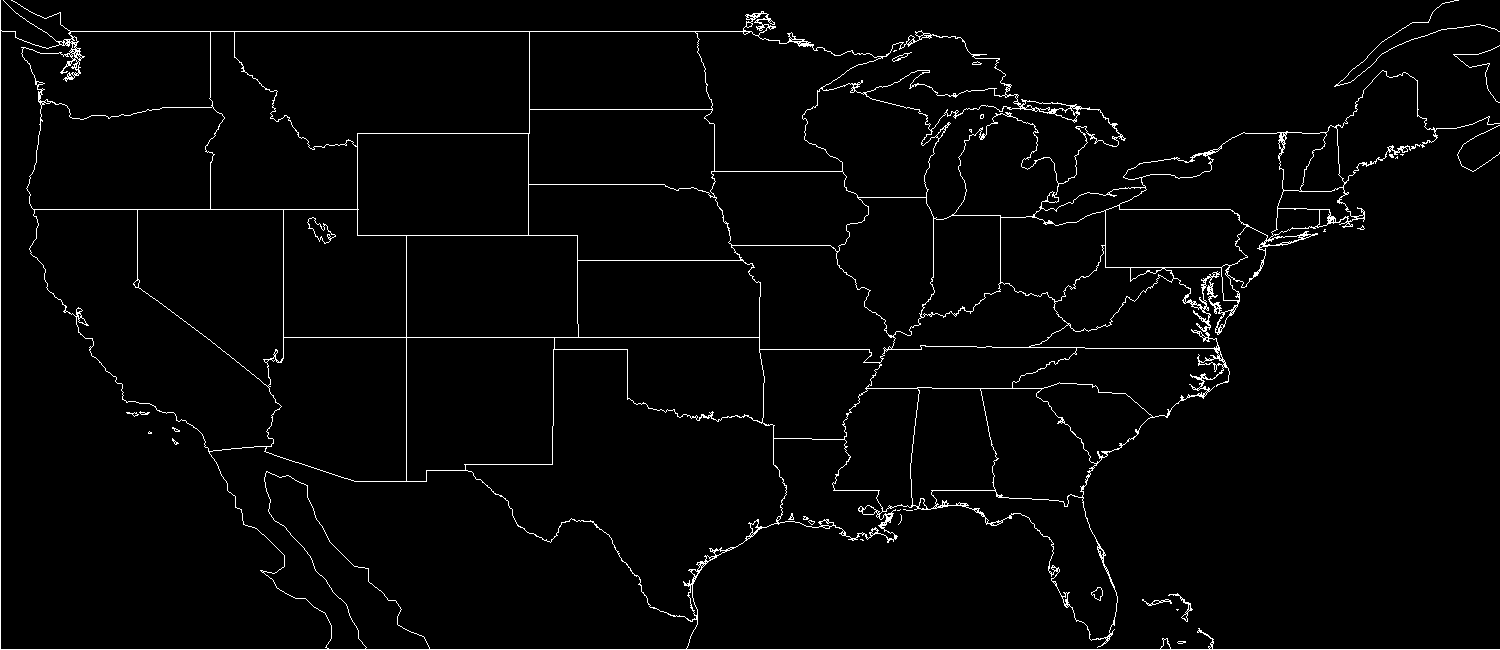
Coverage Details
- Spatial Extent: 75N to 75S and 150E to 5W
- Temporal Extent: October 1994 to December 2017
- Spatial Resolution: Approximately 4 km (0.04 deg)
- Temporal Resolution: Hourly
File Details and Sizes
- Format: netCDF version 4
- Convention: CF (Climate and Forecasting) Metadata convention
- Approximate file sizes:
- One file: ~50 MB
- One satellite-day (24 files): ~1200 MB
- One satellite-year (8760 files): ~450 GB
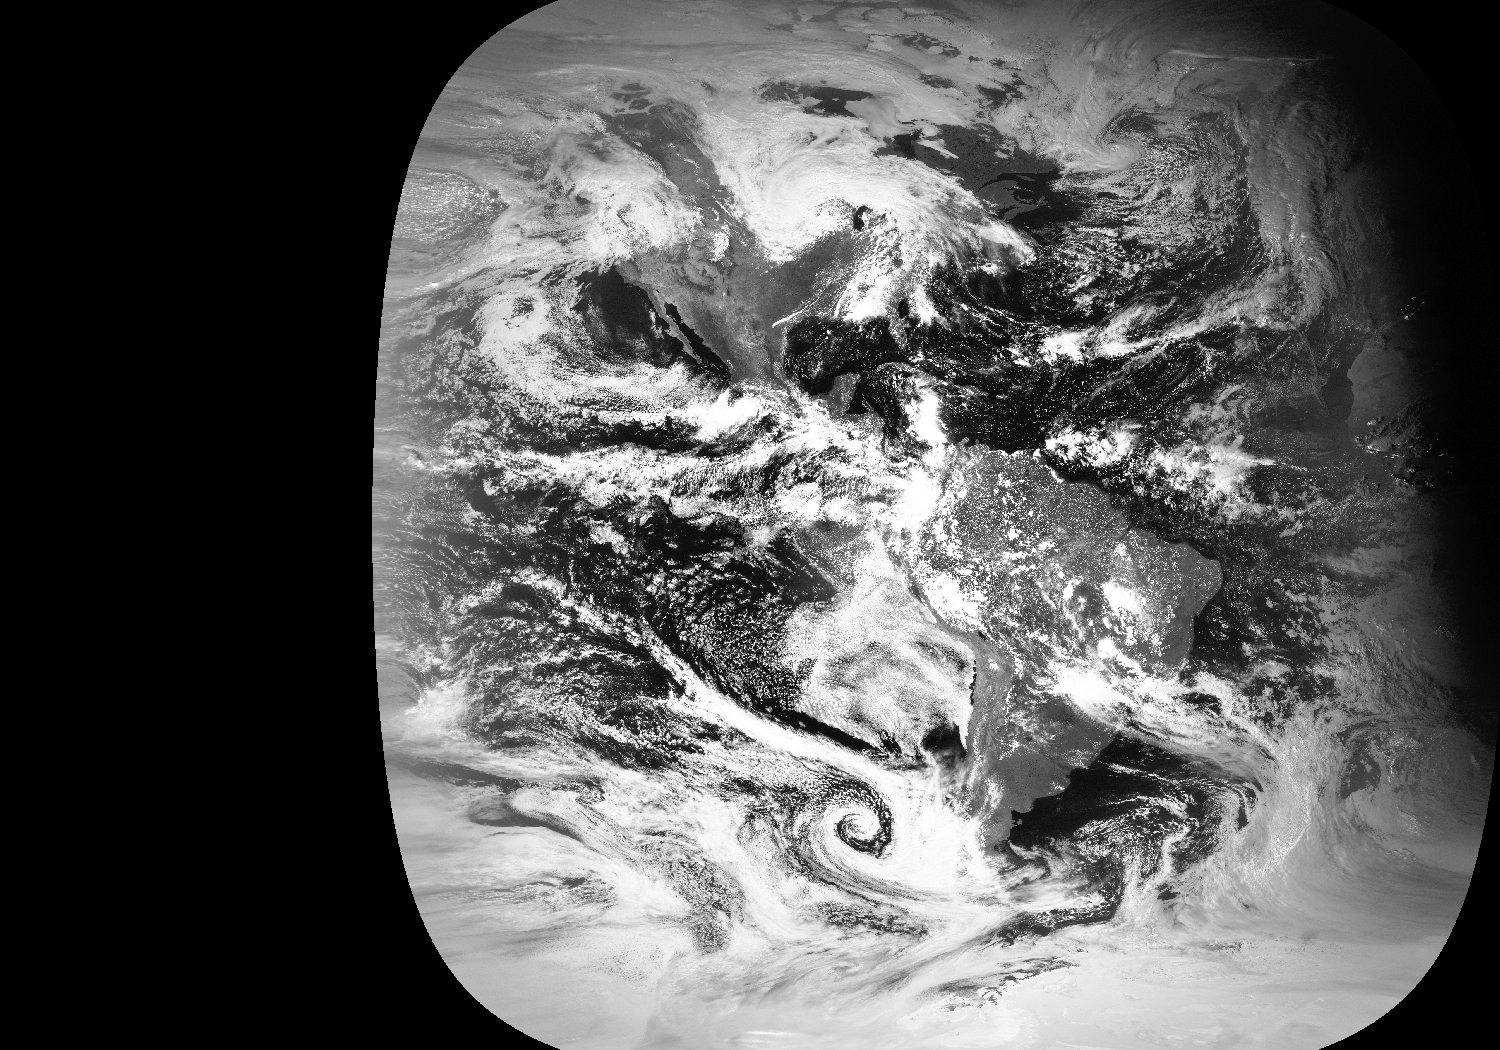
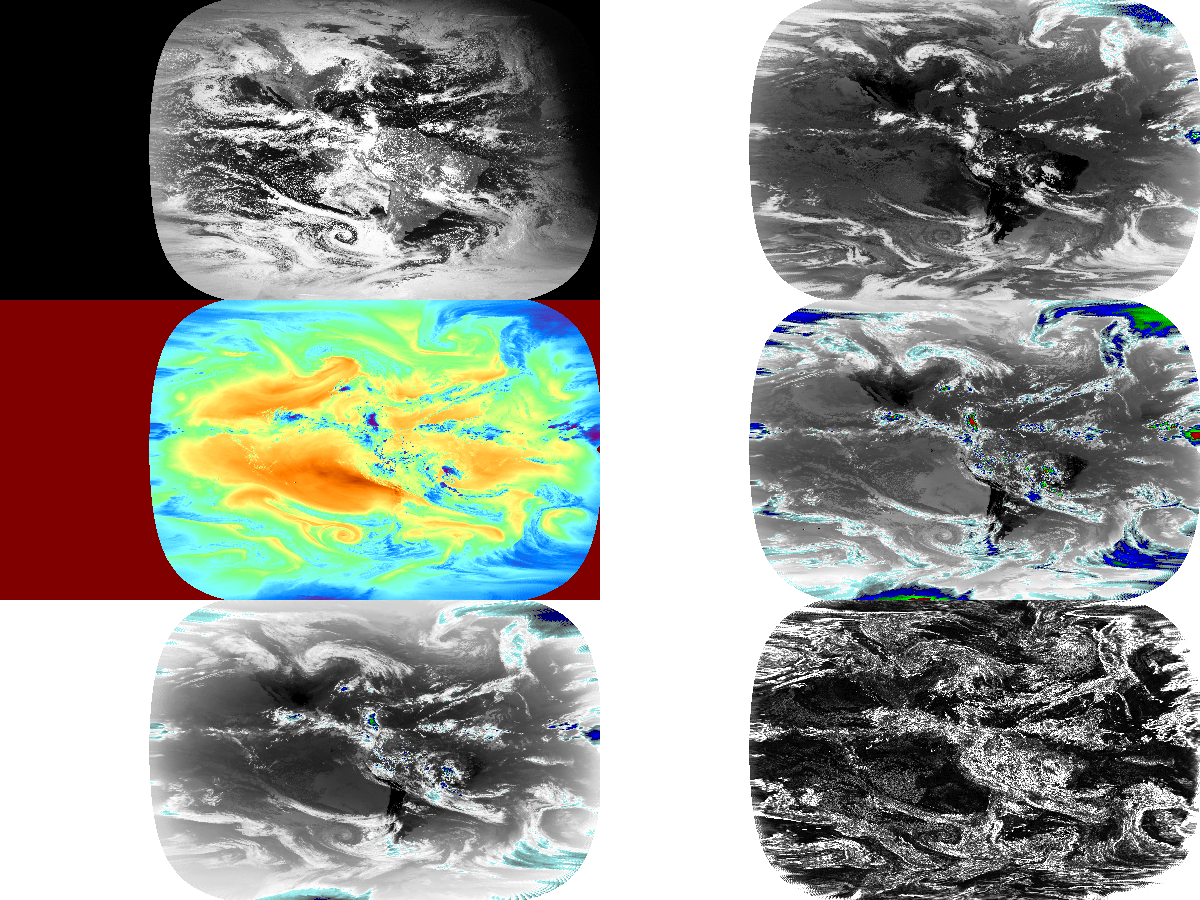
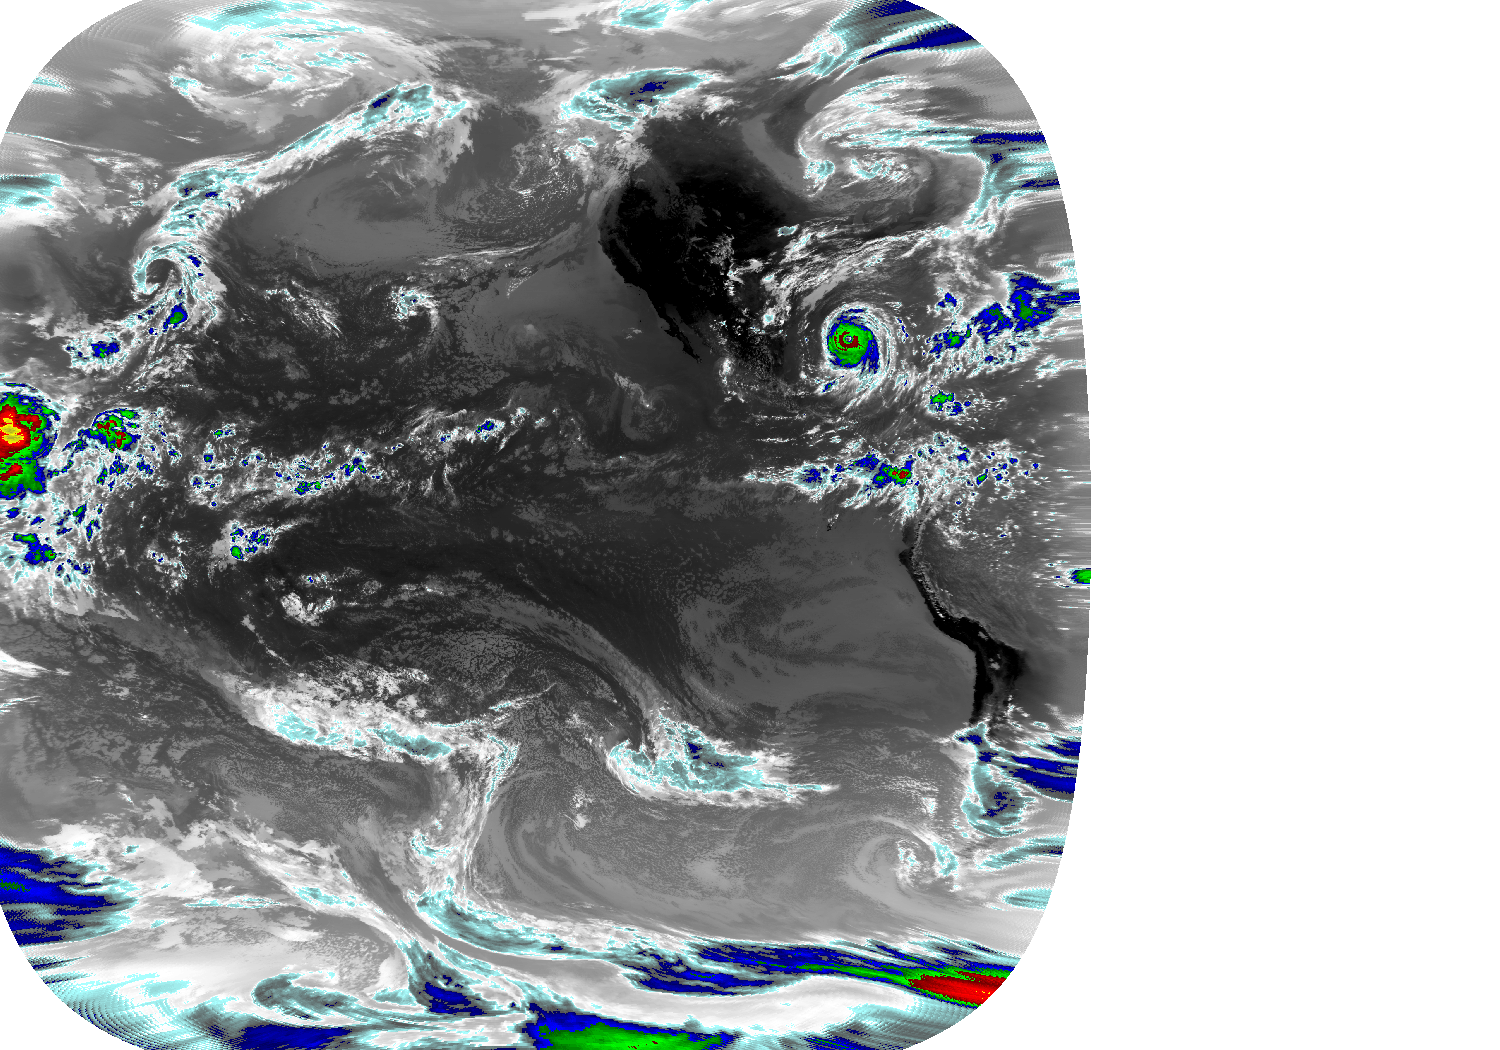
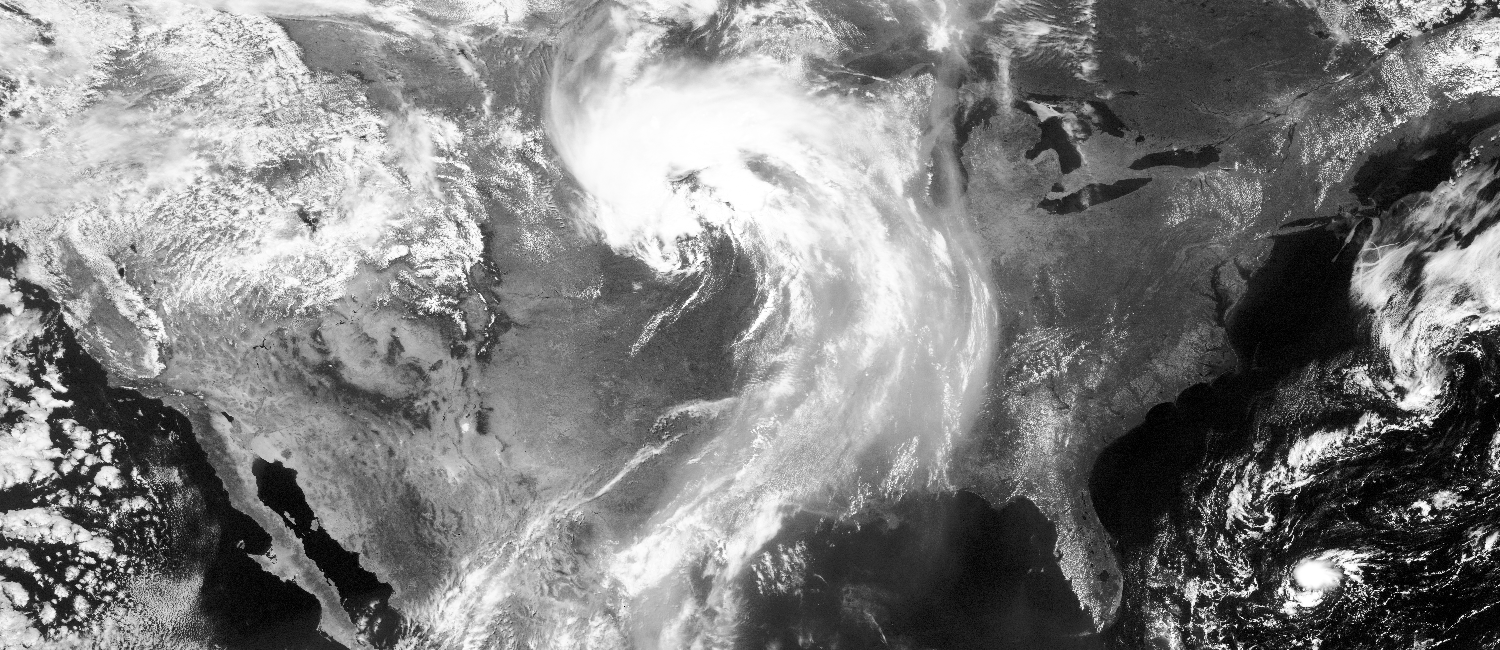
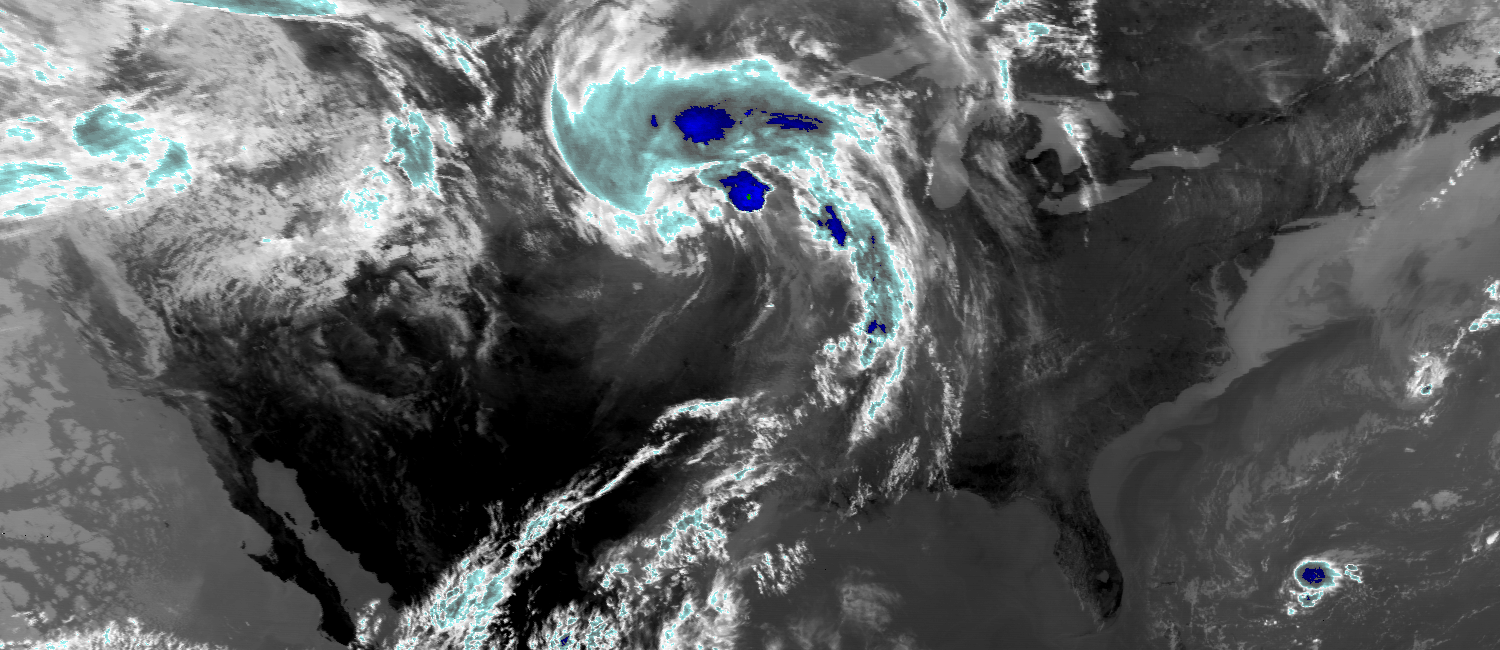
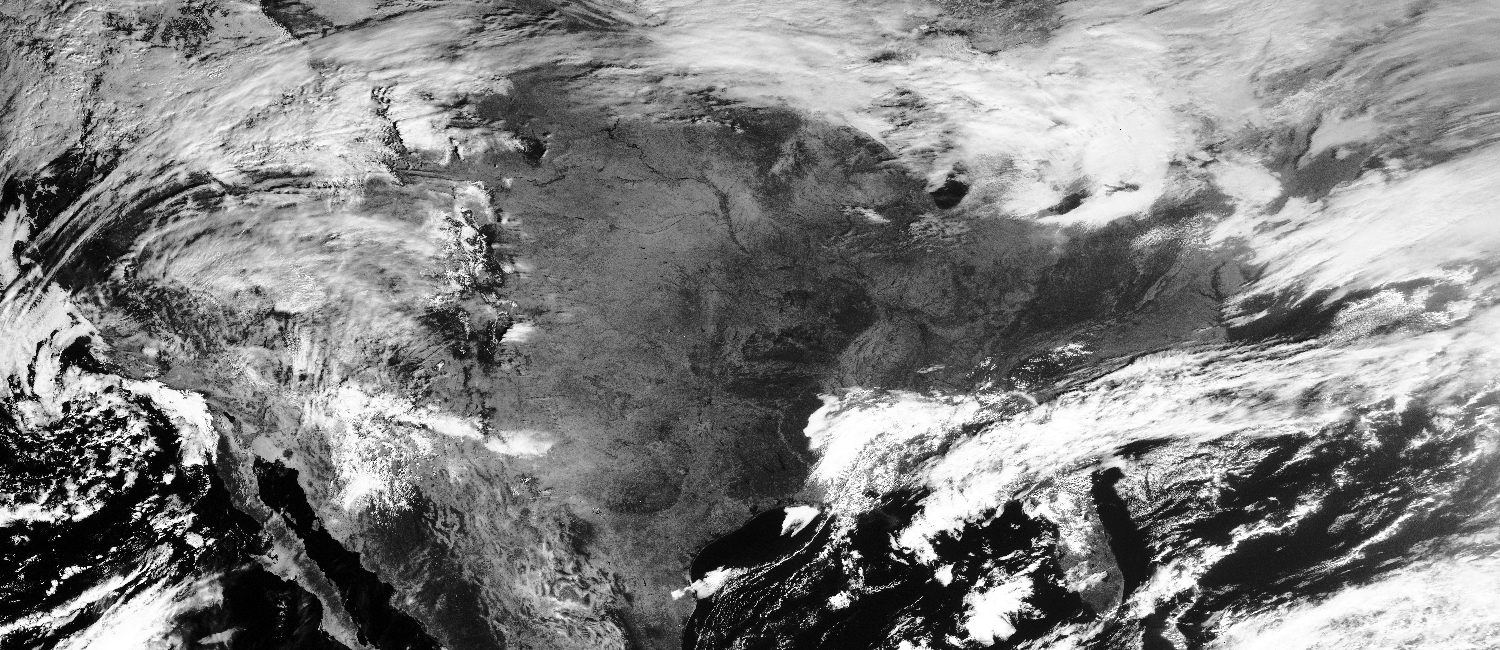
Sample Images
The following images are 1500x1050 pixels rather than full resolution (5375x3750 pixels). A full resolution image (6MB) of the Hurricane Katrina image is available, which demonstrates the full grid resolution.


Coverage Details
- Spatial Extent: 25N to 50N and 135W to 65 W
- Temporal Extent: October 1994 to December 2017
- Spatial Resolution: Approximately 4 km (0.04 deg)
- Temporal Resolution: 15 minutes
File Details and Sizes
- Format: netCDF version 4
- Convention: CF (Climate and Forecasting) Metadata convention
- Approximate file sizes:
- One file: ~4 MB
- One satellite-day (96 files): ~400 MB
- One satellite-year (~35,000 files): ~140 GB
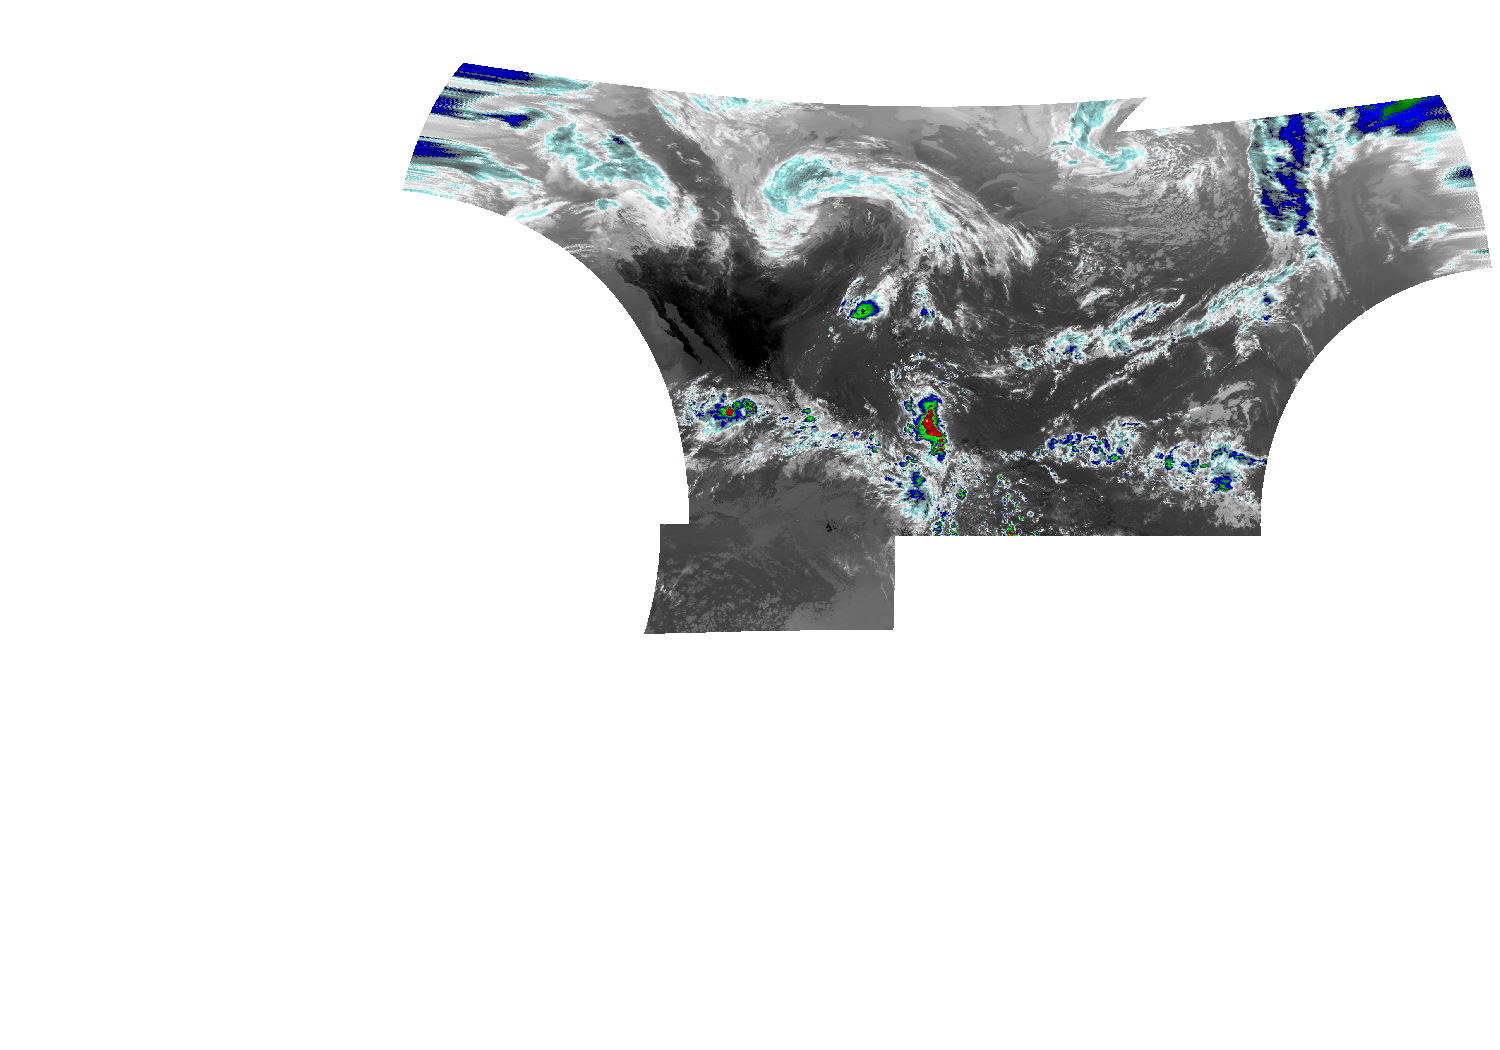
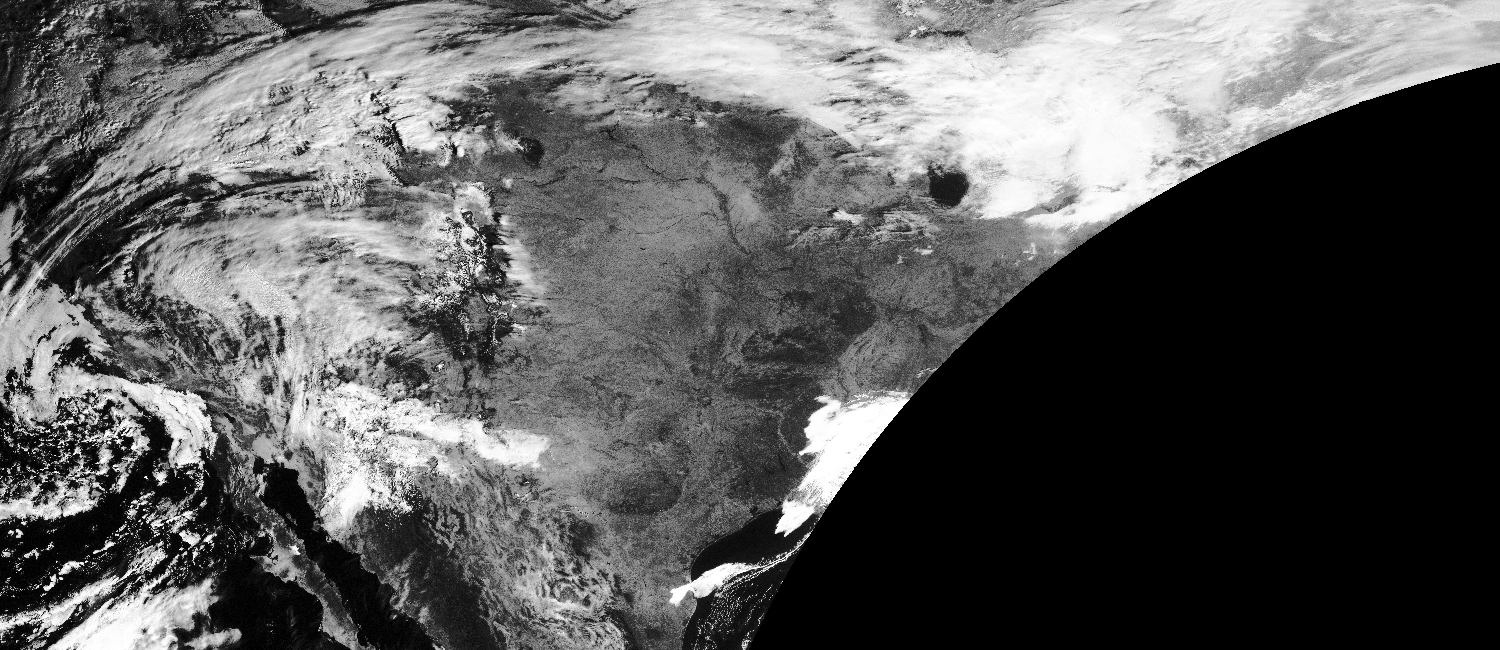
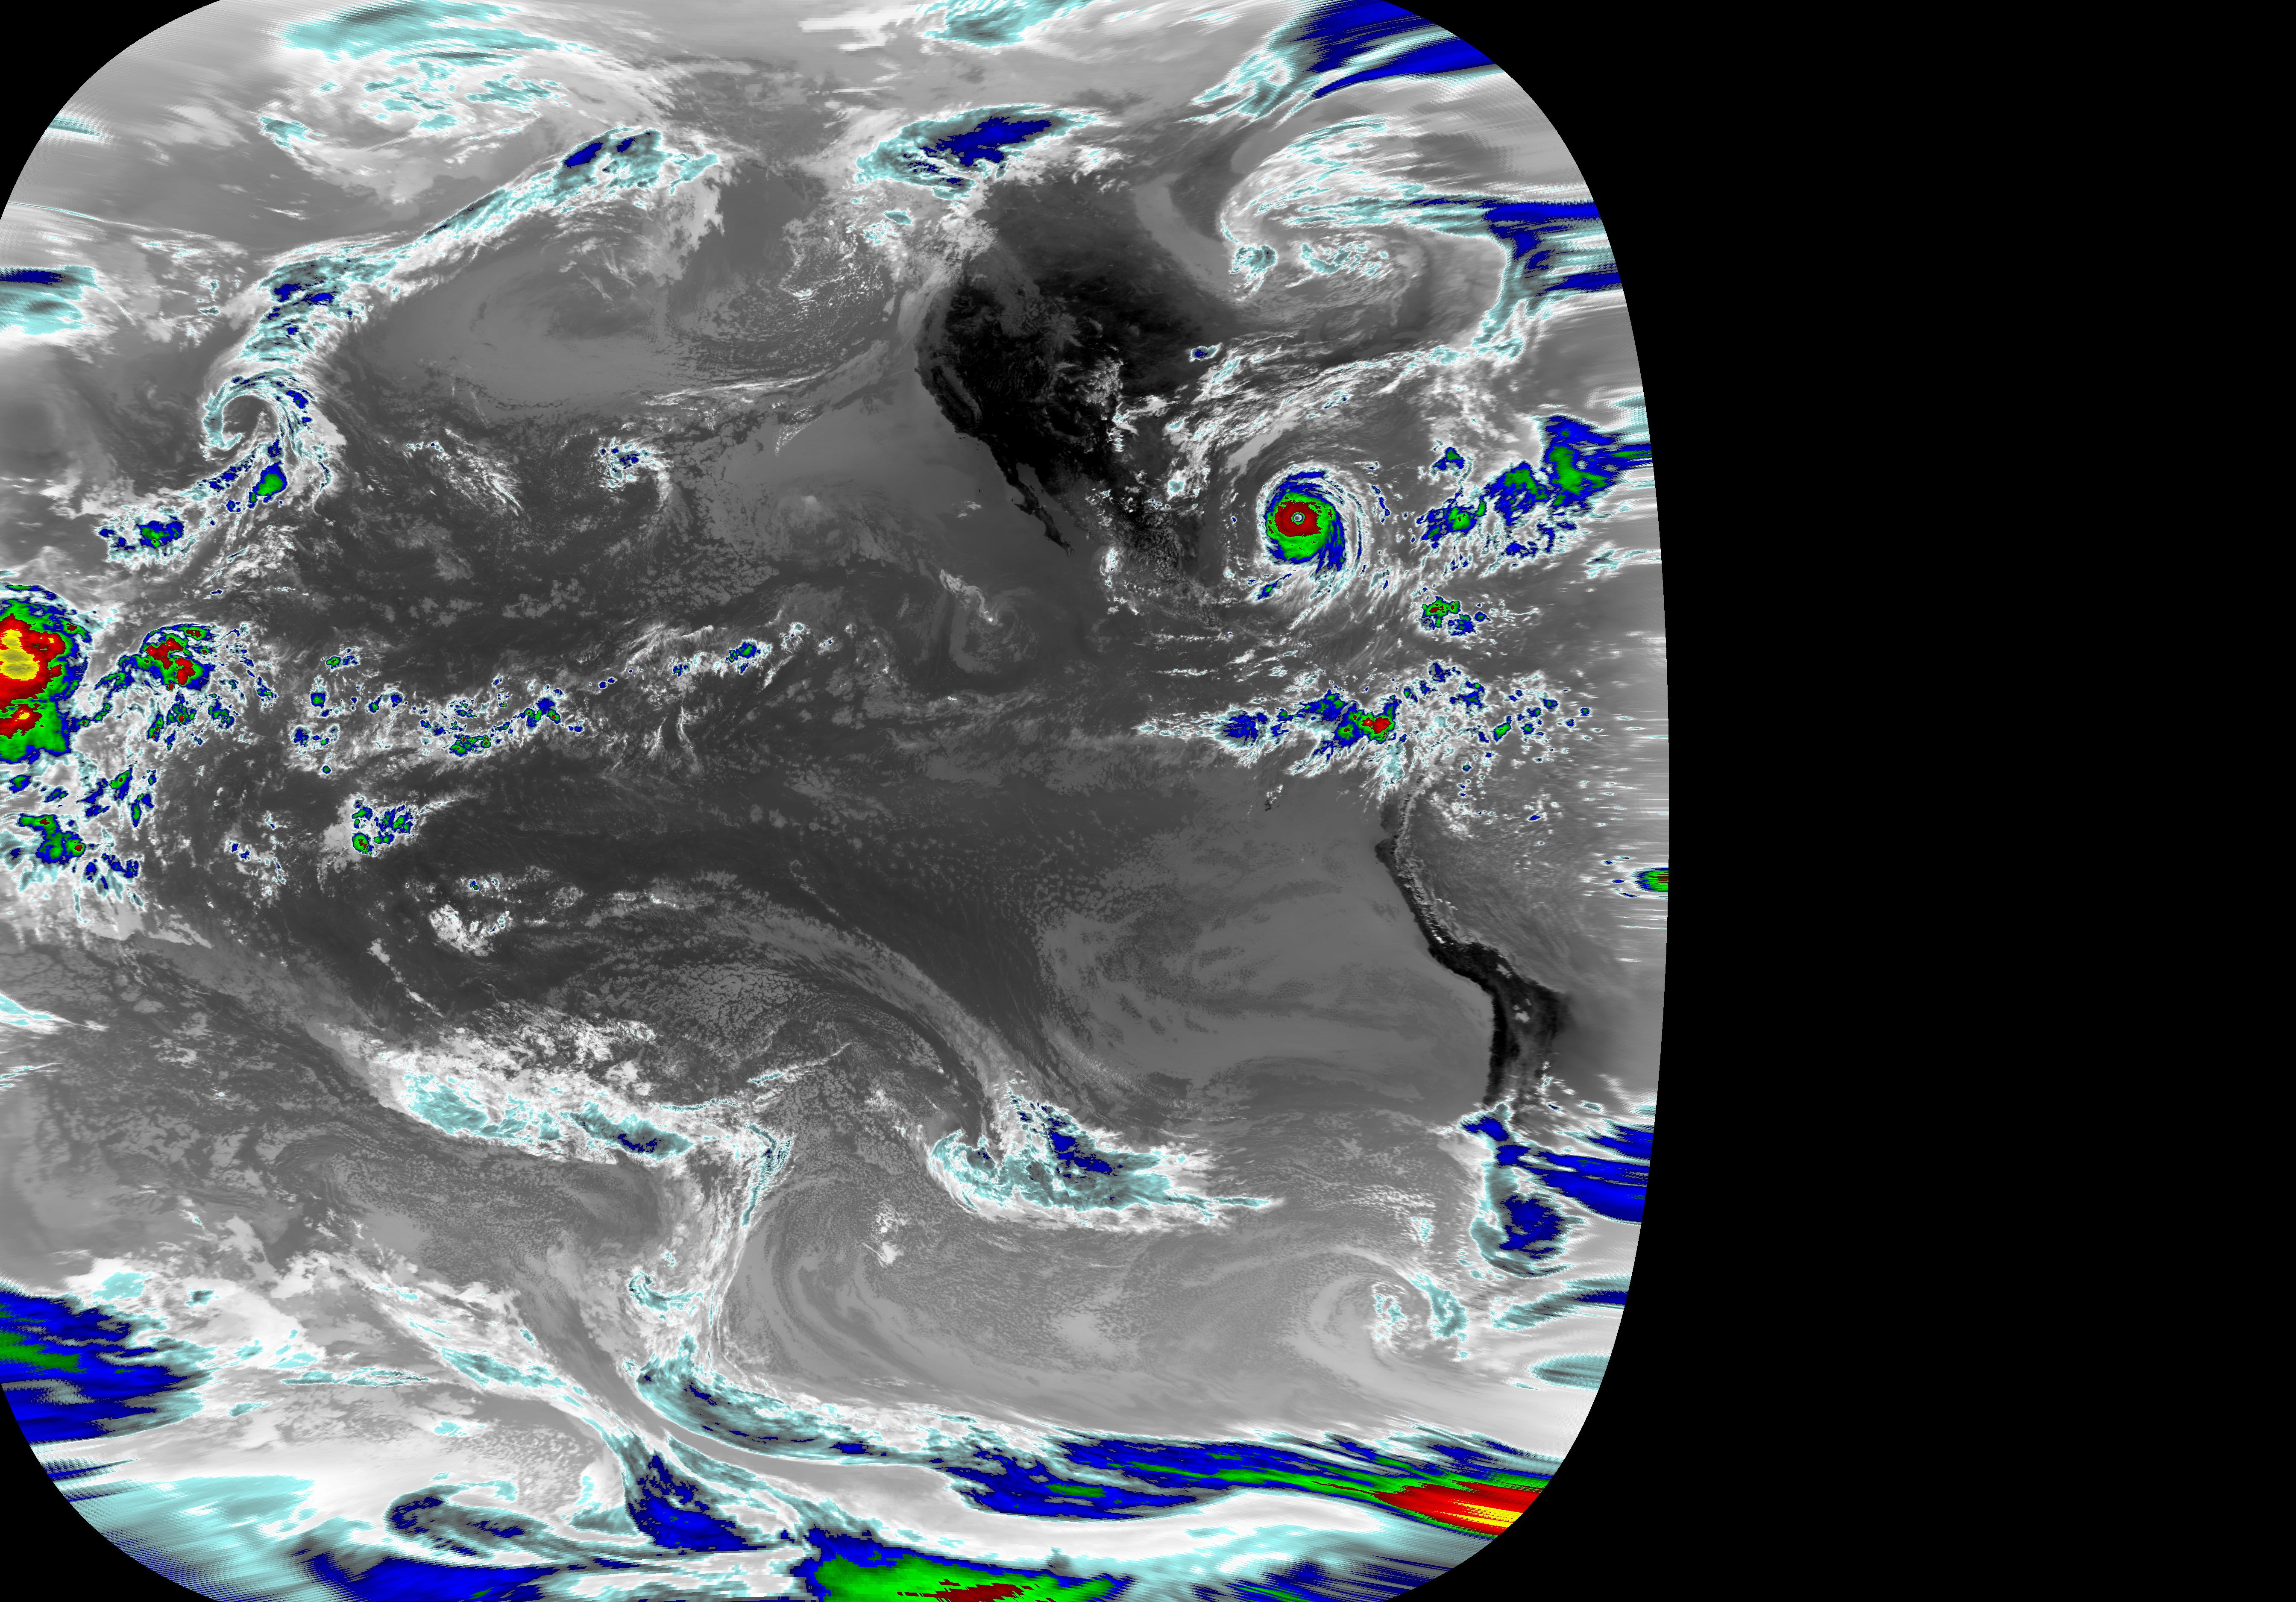
Sample Images
Potential Updates
We are always looking for ways to improve this project. Tell us what updates you’d like to see using our optional product feedback form.
The following are examples of potential updates and their effects on the dataset.
Develop Routine Updates
The product is updated annually in January, but could incorporate additional daily/monthly/quarterly updates.
Expansion to 1980–1994
Current period of record is 1994–2017. Pre-GVAR data (GOES 1-7 and SMS 1-2) could be included with the same spatial and similar temporal resolutions, but with fewer available channels.
Expansion to GOES-16
The GOES-16 data stream will be large (TBs per day). This would subsample GOES-16 full resolution data to the 4 km and 15 min (CONUS) or hourly (hemispherical) resolutions. Providing subsampled GOES-16 data through GridSat-GOES would provide smaller files and make subsetting easier.
Include Cloud Information
Cloud probability, cloud parameters (cloud optical depth, cloud top pressure and temperature, etc. could be provided, but would make the files larger.
Increase Resolution
The visible channel is currently 1 km of visible data, but visible data are subsampled to 4km in GridSat. We could provide a separate 1 km grid of the US, but it would significantly increase file sizes.
Climate Quality Calibration
The current GridSat product uses the operational infrared (IR) calibration information. While current IR calibration is relatively stable, it could be improved. GridSat does use a visible channel correction that adjusts for long-term gain changes, though more analysis is needed to quantify its effectiveness.
Merge Coincident Grids (e.g., from GOES East and West)
Currently, GOES-East and West grids are stored separately. Merging the grids could simplify processing but would lead to issues where illumination geometry changes. This is most apparent in the visible channel.
Related Papers
The approach from the following paper was used to calibrate the visible channel.
Inamdar, A. K. and K. R. Knapp, 2015: Intercomparison of Independent Calibration Techniques Applied to the Visible Channel of the ISCCP B1 Data; Journal of Atmospheric and Oceanic Technology, 32, 1225-1240. doi: 10.1175/JTECH-D-14-00040.1


