Global Time Series
Temperature Anomalies
Global temperature anomaly data come from NOAA's Global Surface Temperature Analysis (NOAAGlobalTemp), which uses comprehensive data collections of increased global coverage over land (Global Historical Climatology Network-Monthly) and ocean (Extended Reconstructed Sea Surface Temperature) surfaces. These datasets have data from 1850 to the present. The land and ocean datasets are blended into a single product to produce the combined global land and ocean temperature anomalies. The global and hemispheric temperature anomalies are calculated with respect to the 1901-2000 average, the gridded temperature anomalies with respect to the 1991-2020 base period, while all other regional anomalies are based on the 1910-2000 period. For more information on these anomalies, please visit Global Surface Temperature Anomalies.
Precipitation
Precipitation data are provided by the The Global Precipitation Climatology Project (GPCP) Monthly Precipitation Climate Data Record (CDR) with data beginning in 1979. Anomalies are calculated with respect to the 1991-2020 base period.
Global Regions
Global Time Series Data Service API
Overview
A RESTful application programming interface (API) is available to access Climate at a Glance data. The API can format desired data as comma-separated values (CSV), JavaScript Object Notation (JSON), and Extensible Markup Language (XML). The Data Service is only available via HTTP Strict Transport Security (HSTS) following Federal government policy.
Request Endpoint Parameters
Accepted values are defined in the table below.
Required Parameters
Required parameters are passed as path parameters.
https://www.ncei.noaa.gov/
Optional Parameters
Note: not applicable to Average Temperature Anomalies (parameter = tavg)
Optional parameters are passed using a GET request. This an optional query component which follows the path, preceded by a question-mark ?, in the form of key=value pairs, and separated by an ampersand &.
…?{basePeriod}=[true|false]&{begBaseYear}=[year]&{begBaseYear}=[year]
| Request Parameter | Type | Description |
|---|---|---|
| region | String |
Accepted surface values in parentheses
Accepted Values
globe
Global (land, ocean, land_ocean)
nhem
Northern Hemisphere (land, ocean, land_ocean)
shem
Southern Hemisphere (land, ocean, land_ocean)
africa
Africa (land)
asia
Asia (land)
europe
Europe (land)
northAmerica
North America (land)
oceania
Oceania (land)
southAmerica
South America (land)
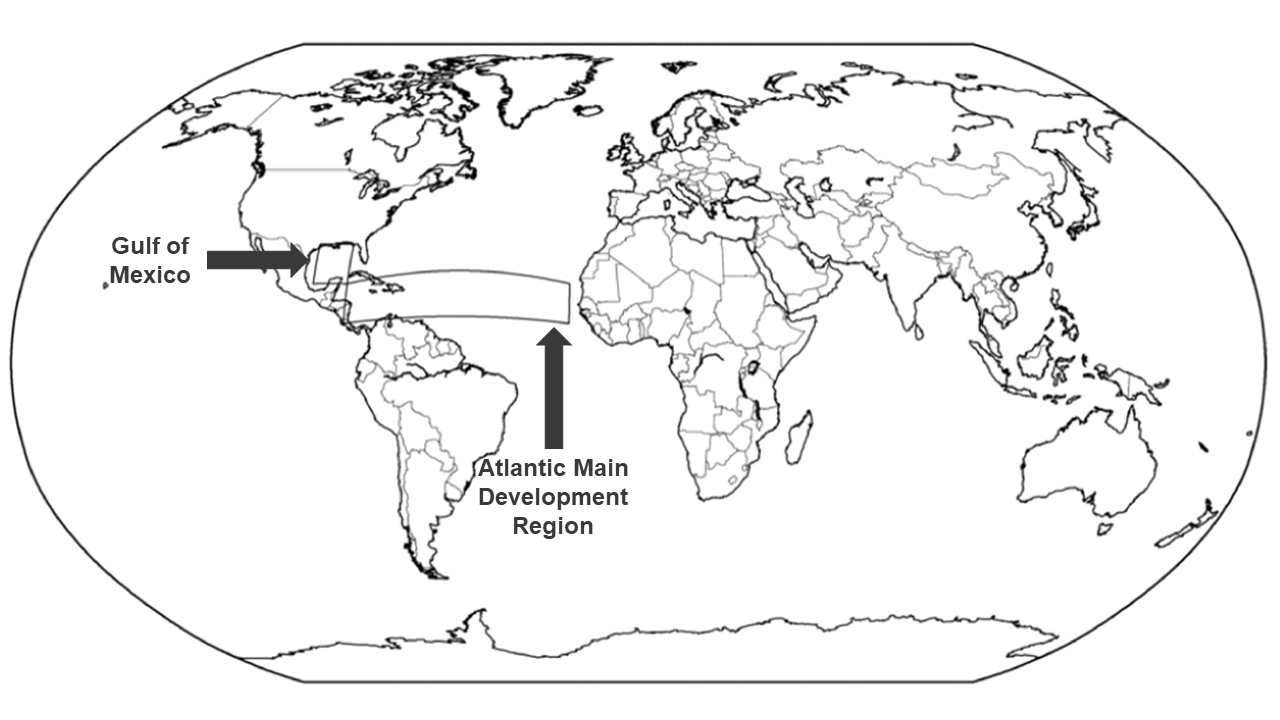
atlanticMdr
Atlantic Main Development Region (land_ocean)
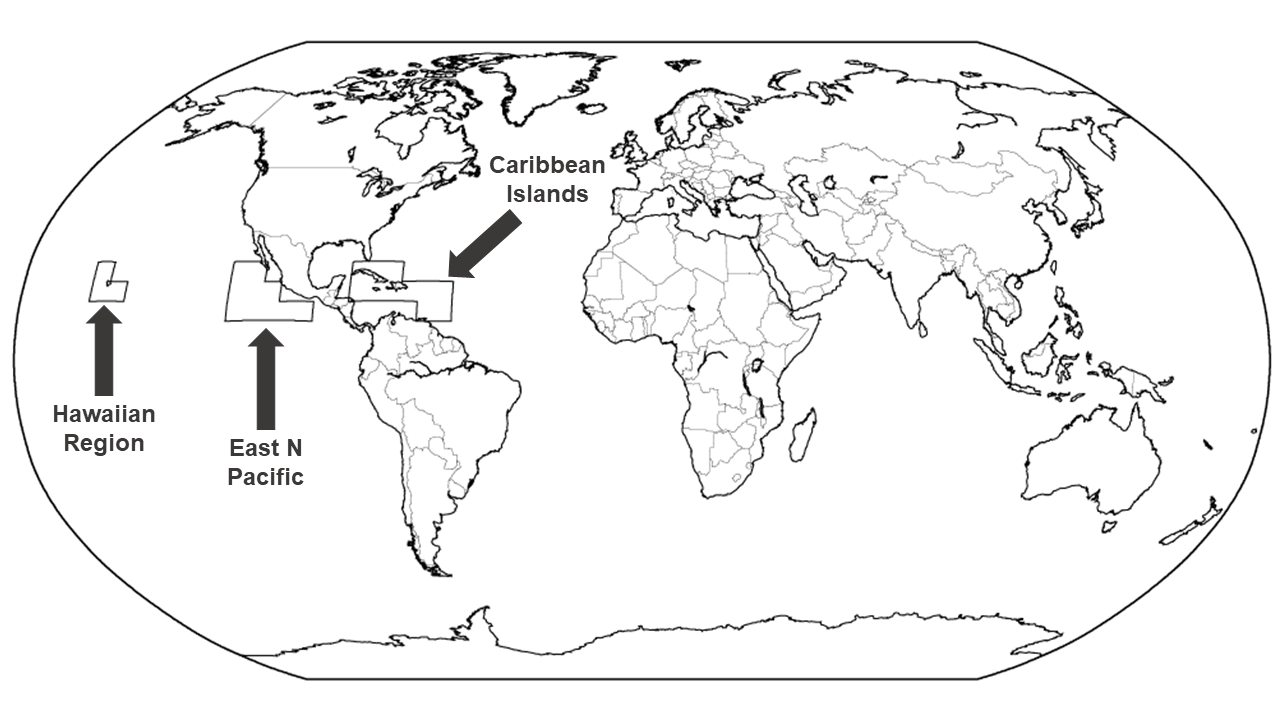
caribbeanIslands
Caribbean Islands (land_ocean)
eastNPacific
East N Pacific (land_ocean)
gulfOfAmerica
Gulf of America (land_ocean)
hawaiianRegion
Hawaiian Region (land_ocean)
arctic
Arctic (land_ocean)
antarctic
Antarctic (land_ocean)
coords
Enter Coordinates (land_ocean)
|
| parameter | String |
Accepted Values
tavg
Average Temperature Anomaly
pcp
Precipitation
|
| surface/ |
String |
Accepted Values
land_ocean
Land and Ocean
land
Land
ocean
Ocean
[-90 - 90],[-180 - 180]
Latitude and Longitude*
*If 'coords' is entered for region, use comma separated latitude (between -90.0 and 90.0) and longitude (between -180.0 and 180.0) with no spaces (e.g., 30.4,84.3).
|
| timescale | Integer, String |
Accepted Values
1-60
Number of Months
ytd
Year to Date
|
| month | Integer |
Accepted Values
1-12
January-December
0
All Months
|
| startYear | Integer |
4-digit year (must be less than or equal to endYear)
Accepted Values
1850-2025
Average Temperature Anomaly
1979-2025
Precipitation
|
| endYear | Integer |
4-digit year (must be greater than or equal to startYear)
Accepted Values
1850-2025
Average Temperature Anomaly
1979-2025
Precipitation
|
| format | String |
Accepted Values
csv
Comma-Separated Values
json
JavaScript Object Notation
xml
Extensible Markup Language
|
| basePeriod | Boolean |
Accepted Values
true
Return anomalies based on the requested base period mean
false
Return no anomalies
|
| begBaseYear | Integer |
4-digit year (must be less than or equal to endBaseYear)
Accepted Values
1850-2025
Average Temperature Anomaly
1979-2025
Precipitation
|
| endBaseYear | Integer |
4-digit year (must be greater than or equal to begBaseYear)
Accepted Values
1850-2025
Average Temperature Anomaly
1979-2025
Precipitation
|
Please note, global and hemispheric temperature anomalies are with respect to the 1901-2000 average. Coordinate temperature anomalies are with respect to the 1991-2020 average. All other regional temperature anomalies are with respect to the 1910-2000 average. Monthly precipitation data are not available until a few days after temperature data are released.
Period | Anomaly | Rank (out of 11) |
|---|---|---|
| June- | 0.92°C | 10 |
| June- | 0.93°C | 11 |
| June- | 0.82°C | 6 |
| June- | 0.84°C | 8 |
| June- | 0.91°C | 9 |
| June- | 0.83°C | 7 |
| June- | 0.73°C | 5 |
| June- | 0.67°C | 1 |
| June- | 0.67°C | 1 |
| June- | 0.67°C | 1 |
| June- | 0.68°C | 4 |
Citing This Page
- NOAA National Centers for Environmental information, Climate at a Glance: Global Time Series, published June 2025, retrieved on June 20, 2025 from https://www.ncei.noaa.gov/access/monitoring/climate-at-a-glance/global/time-series