Note: This report catalogs recent tropical cyclones across the North Atlantic and East Pacific and places each basin’s tropical cyclone activity in a climate-scale context. It is not updated in real time. Users seeking the real time status and forecasts of tropical cyclones should visit The National Hurricane Center.
Australian Basin
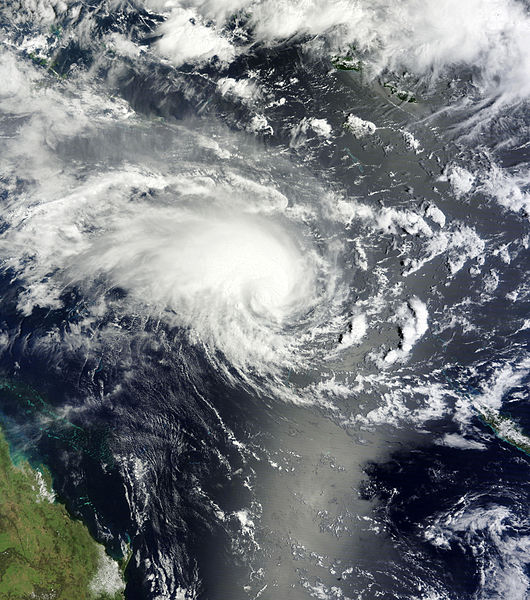 Tropical Storm Jasmine Satellite Image  Australian Scale Color Legend |
 Tropical Storm Jasmine Track  Saffir-Simpson Scale Color Legend | ||||||||
| Tropical Cyclone | Jasmine | ||||||||
| Cyclogenesis Date | 02/04 | ||||||||
| Cyclolysis Date | 02/16 | ||||||||
| Highest Australian Category | Cat 1 | Maximum Gust | 110 km/h | ||||||
| Highest Saffir-Simpson Category | Cat 4 | ||||||||
| Maximum 6-hr Sustained Wind | 132 mph (115 kt or 213 km/h) | ||||||||
| Min Pressure | 978 mbar | ||||||||
| Accumulated Cyclone Energy (ACE*) Index (kt2) | 22.0025 x 10⁴ | ||||||||
| Landfall Information (date, location and sustained winds) | |||||||||
| Deaths | N/A | ||||||||
| *The (ACE) Index calculations are based on preliminary data. | |||||||||
South Pacific Basin
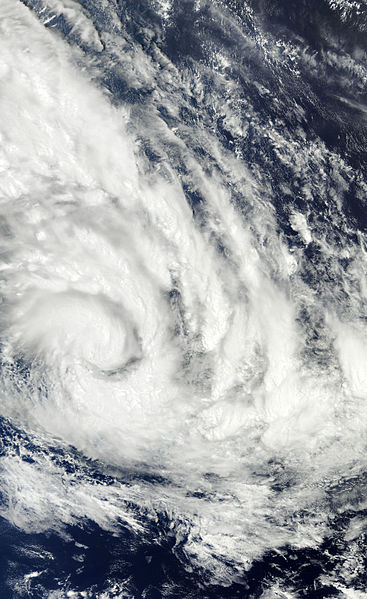 Tropical Storm Cyril Satellite Image |
 Tropical Storm Cyril Forecast Track Saffir-Simpson Scale Color Legend |
| Tropical Cyclone | Cyril | ||||||||
| Cyclogenesis Date | 02/06 | ||||||||
| Cyclolysis Date | 02/08 | ||||||||
| Highest Saffir-Simpson Category | TS | ||||||||
| Maximum 6-hr Sustained Wind | 63 mph (55 kt or 102 km/h) | ||||||||
| Min Pressure | 987 mbar | ||||||||
| Accumulated Cyclone Energy (ACE*) Index (kt2) | 1.3950 x 10⁴ | ||||||||
| Landfall Information (date, location and sustained winds) | |||||||||
| Deaths | |||||||||
| *The (ACE) Index calculations are based on preliminary data. | |||||||||
South Indian Basin
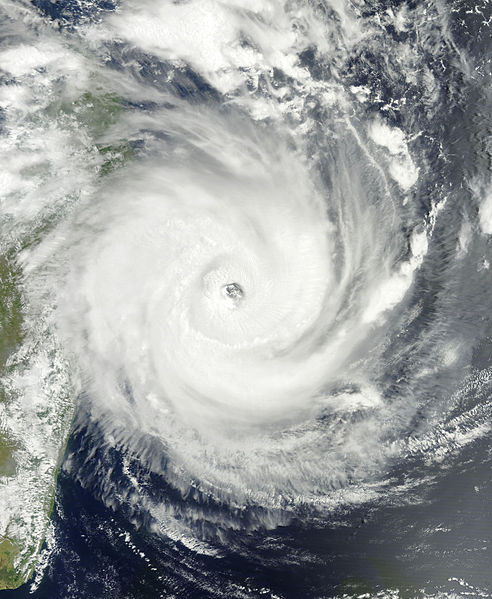 Tropical Storm Giovanna Satellite Image |
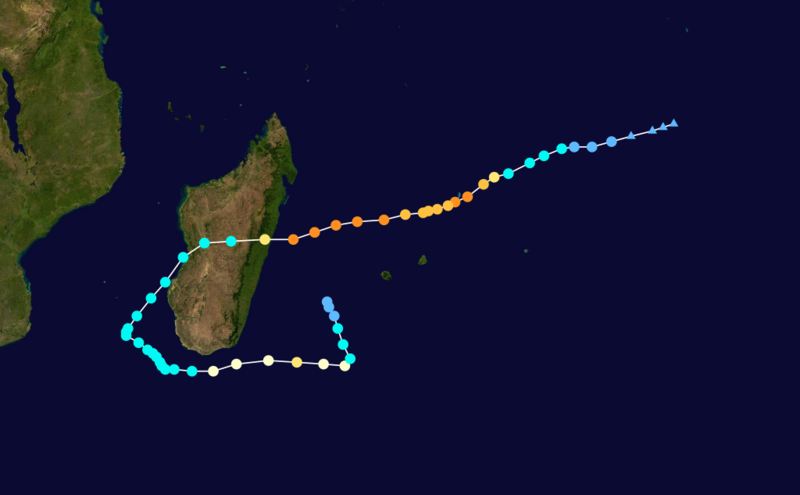 Tropical Storm Giovanna Forecast Track Saffir-Simpson Scale Color Legend |
| Tropical Cyclone | Giovanna | ||||||||
| Cyclogenesis Date | 02/09 | ||||||||
| Cyclolysis Date | 02/21 | ||||||||
| Highest Saffir-Simpson Category | Cat 4 | ||||||||
| Maximum 6-hr Sustained Wind | 144 mph (125 kt or 232 km/h) | ||||||||
| Min Pressure | 932 mbar | ||||||||
| Accumulated Cyclone Energy (ACE*) Index (kt2) | 27.0975 x 10⁴ | ||||||||
| Landfall Information (date, location and sustained winds) | 02/13 - Madagascar (125 kt or 232 km/h) | ||||||||
| Deaths | 18 | ||||||||
| *The (ACE) Index calculations are based on preliminary data. | |||||||||
 Tropical Storm Hilwa Satellite Image |
 Tropical Storm Hilwa Forecast Track Saffir-Simpson Scale Color Legend |
| Tropical Cyclone | Hilwa | ||||||||
| Cyclogenesis Date | 02/14 | ||||||||
| Cyclolysis Date | 02/22 | ||||||||
| Highest Saffir-Simpson Category | TS | ||||||||
| Maximum 6-hr Sustained Wind | 58 mph (50 kt or 93 km/h) | ||||||||
| Min Pressure | 993 mbar | ||||||||
| Accumulated Cyclone Energy (ACE*) Index (kt2) | 4.5400 x 10⁴ | ||||||||
| Landfall Information (date, location and sustained winds) | |||||||||
| Deaths | 0 | ||||||||
| *The (ACE) Index calculations are based on preliminary data. | |||||||||
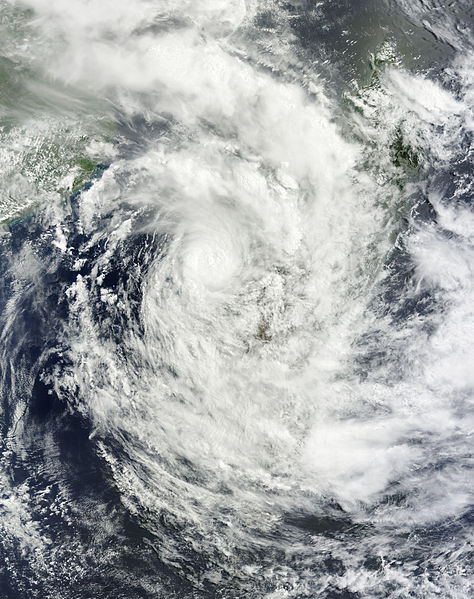 Tropical Storm Irina Satellite Image |
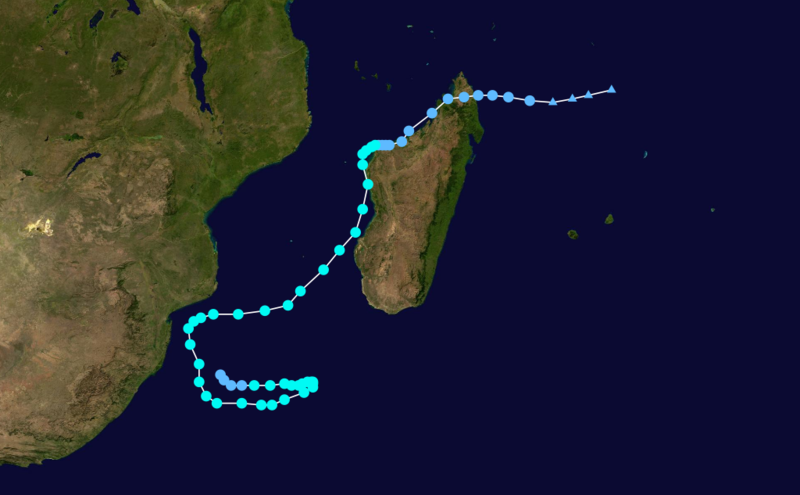 Tropical Storm Irina Forecast Track Saffir-Simpson Scale Color Legend |
| Tropical Cyclone | Irina | ||||||||
| Cyclogenesis Date | 02/29 | ||||||||
| Cyclolysis Date | 03/09 | ||||||||
| Highest Saffir-Simpson Category | TS | ||||||||
| Maximum 6-hr Sustained Wind | 69 mph (60 kt or 111 km/h) | ||||||||
| Min Pressure | 979 mbar | ||||||||
| Accumulated Cyclone Energy (ACE*) Index (kt2) | 8.1125 x 10⁴ | ||||||||
| Landfall Information (date, location and sustained winds) | |||||||||
| Deaths | 77 | ||||||||
| *The (ACE) Index calculations are based on preliminary data. | |||||||||