Atlantic Basin
Lee formed on September 2 from a broad but disorganized tropical wave that entered the Western Caribbean in late August. While the core of the storm meandered inland on September 4 roughly 50 miles (80 km) southwest of Lafayette, LA, its squalls impacted the Gulf Coast as early as the day prior. Lee’s high moisture content and slow speed promoted 24-hour rainfall totals in excess of 5 inches (127 mm) in most locations, including New Orleans Airport and Holden, LA where 11.05 inches (281 mm) and 15.43 inches (393 mm) fell, respectively. Because the storm traversed moderate to severe drought-stricken areas of the Gulf States, existing conditions actually worked to mitigate flood damages. (Lee offered minimal relief to arid Texas; consequently, the storm’s gusts assisted in fueling the Bastrop wildfires.) After becoming post-tropical on September 5, Lee’s remnants traveled northeast, drenching regions along the axis of the Appalachian Mountain range. Several locations set new 24-hour rainfall records, including Jackson, MS whose 11.68 inches (297 mm) of rain broke the city’s previous record of 8.54 inches (217 mm) set in 1979; and Chattanooga, TN which received 9.85 inches (250 mm) of rainfall besting its previous 7.61 inches (193 mm) set in 1886. In the northeastern U.S., Binghamton, NY and Hershey, Pennsylvania both experienced flooding of historic proportions as the Susquehanna River and Swatara Creek crested at 25.69 feet (7.83 m) and 27.2 feet (8.3 m), respectively–their highest levels on record. Binghamton, NY itself received a total of 9.02 inches (229.1 mm) of rain, setting an all-time rain event for the city. Lee is responsible for 21 fatalities and over $250 million in damages. In addition, Lee spawned several weak (EF-0 and EF-1) tornadoes–of which there were more than 40 total reports.
 Tropical Storm Lee Satellite Image |
 Tropical Storm Lee Forecast Track  Saffir-Simpson Scale Color Legend |
| Tropical Cyclone | Lee | ||||||||
| Cyclogenesis Date | 09/02 | ||||||||
| Cyclolysis Date | 09/05 | ||||||||
| Highest Saffir-Simpson Category | TS | ||||||||
| Maximum 6-hr Sustained Wind | 58 mph (50 kt or 93 km/h) | ||||||||
| Min Pressure | 986 mbar | ||||||||
| Accumulated Cyclone Energy (ACE*) Index (kt2) | 2.1575 x 10⁴ | ||||||||
| Landfall Information (date, location and sustained winds) | 09/04 –Lafayette, Louisiana (40 kt or 72 km /h) | ||||||||
| Deaths | 17 | ||||||||
| *The (ACE) Index calculations are based on preliminary data. | |||||||||
Originating from a steadily organizing east African wave, Maria spun into a tropical storm the morning of September 7. As it tracked westward toward the islands of the Caribbean, the storm endured a several-day bout with high wind shear. Despite being disorganized, Maria brought heavy rain and gusty winds to the islands, including a 24-hour rainfall total of 10.71 inches (272 mm) along Puerto Rico’s east coast–a region affected by Hurricane Irene weeks before. From there, Maria tracked north-northwest at a rapid speed of 45 mph (72 km/h). The storm reached hurricane intensity mid-September and maintained this intensity as it made landfall on September 16 in Newfoundland, Canada. Due to Maria’s swift crossing, less than an inch (20 mm) of precipitation was reported in locations such as St. John’s, Newfoundland. The storm transitioned into a post-tropical cyclone later that evening. Maria’s naming on September 7 represents the second earliest arrival of a 13th named storm. (Hurricane Maria of the 2005 season ranks first with a formation date of September 2.) In addition to being the 13th named storm, Maria is also the 13th hurricane to make landfall in Newfoundland since records began in 1851. Together with hurricane Igor of the 2010 season, Maria makes 2011 the second consecutive year during which a landfalling hurricane has occurred within the Canadian island; this event has never before been recorded.
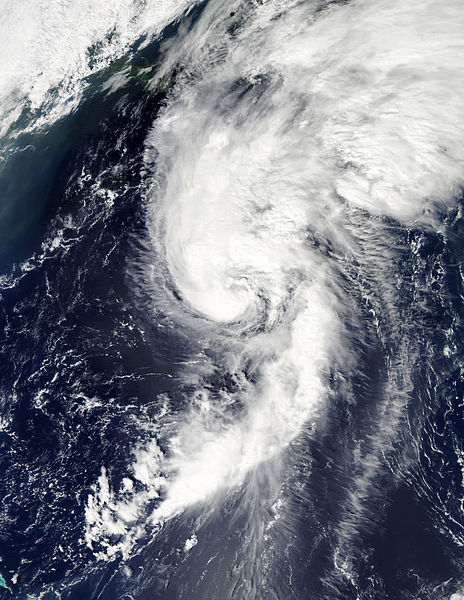 Tropical Storm Maria Satellite Image |
 Tropical Storm Maria Forecast Track Saffir-Simpson Scale Color Legend |
| Tropical Cyclone | Maria | ||||||||
| Cyclogenesis Date | 09/07 | ||||||||
| Cyclolysis Date | 09/16 | ||||||||
| Highest Saffir-Simpson Category | Cat 1 | ||||||||
| Maximum 6-hr Sustained Wind | 81 mph (70 kt or 130 km/h) | ||||||||
| Min Pressure | 979 mbar | ||||||||
| Accumulated Cyclone Energy (ACE*) Index (kt2) | 9.9225 x 10⁴ | ||||||||
| Landfall Information (date, location and sustained winds) | 09/16 – Avalon Peninsula, Newfoundland (56 kt or 103 km /h) | ||||||||
| Deaths | 0 | ||||||||
| *The (ACE) Index calculations are based on preliminary data. | |||||||||
On September 7, Tropical Storm Nate churned into existence in Mexico’s Bay of Campeche. After stalling for several days, the compact storm, whose intensity flirted with, yet remained shy of hurricane strength, finally advanced inland just north of Barra de Nautla in the Mexican state of Veracruz on September 11. A short thirteen hours later, Nate dissipated into a remnant low over central Mexico. A total of 5 fatalities were reported.
 Tropical Storm Nate Satellite Image |
 Tropical Storm Nate Forecast Track Saffir-Simpson Scale Color Legend |
| Tropical Cyclone | Nate | ||||||||
| Cyclogenesis Date | 09/08 | ||||||||
| Cyclolysis Date | 09/11 | ||||||||
| Highest Saffir-Simpson Category | TS | ||||||||
| Maximum 6-hr Sustained Wind | 63 mph (55 kt or 102 km/h) | ||||||||
| Min Pressure | 994 mbar | ||||||||
| Accumulated Cyclone Energy (ACE*) Index (kt2) | 3.8900 x 10⁴ | ||||||||
| Landfall Information (date, location and sustained winds) | 09/11 – Veracruz, Mexico (39 kt or 72 km /h) | ||||||||
| Deaths | 4 | ||||||||
| *The (ACE) Index calculations are based on preliminary data. | |||||||||
Since its inception as a weak tropical storm on September 20 high wind shear acted as an impediment to Ophelia’s development. By September 25, dry air and wind shear values of 20-25 knots had denatured Ophelia, and the storm dissipated east of the northern Lesser Antilles. Against all odds, the remnants of Ophelia regenerated into a tropical depression the evening of September 27. In the days to follow, Ophelia underwent rapid cyclogenesis, attaining hurricane strength on the evening of September 29 and major hurricane intensity by the next morning. The storm tracked over the open Atlantic intensifying to a Category 4 hurricane (the 2nd of the season) east of Bermuda on October 1. The following day, Ophelia progressively weakened back to a Category 1 hurricane and passed over Newfoundland’s Avalon Peninsula as a tropical storm, on the morning of October 3. The storm was declared post-tropical north of Cape Race, Newfoundland that same day.
 Tropical Storm Ophelia Satellite Image |
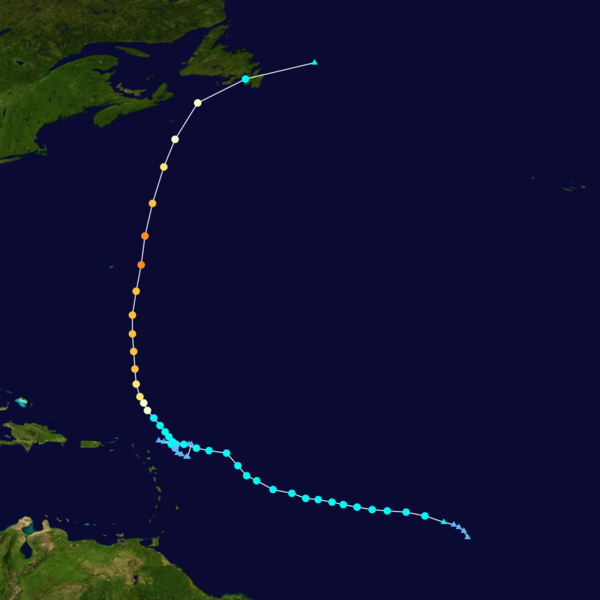 Tropical Storm Ophelia Forecast Track Saffir-Simpson Scale Color Legend |
| Tropical Cyclone | Ophelia | ||||||||
| Cyclogenesis Date | 09/21 | ||||||||
| Cyclolysis Date | 10/03 | ||||||||
| Highest Saffir-Simpson Category | Cat 4 | ||||||||
| Maximum 6-hr Sustained Wind | 138 mph (120 kt or 222 km/h) | ||||||||
| Min Pressure | 940 mbar | ||||||||
| Accumulated Cyclone Energy (ACE*) Index (kt2) | 18.7475 x 10⁴ | ||||||||
| Landfall Information (date, location and sustained winds) | |||||||||
| Deaths | 0 | ||||||||
| *The (ACE) Index value preliminary data for Ophelia was recalculated to include a N-day regeneration on Sep 28-Oct 3. | |||||||||
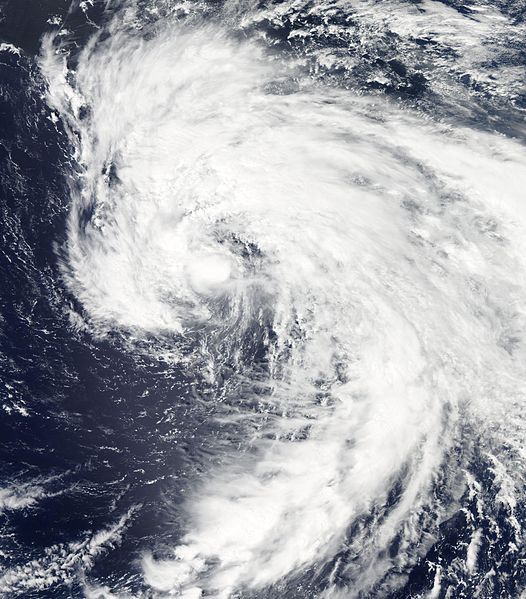
Philippe was designated a tropical storm on September 24, 12 hours after entering the eastern Atlantic as a tropical wave. Strong shear, which affected the system as early as late September, seemed to signal Philippe’s dissipation; however, after lingering in the middle Atlantic for 12 days, the storm entered into a relaxed shear environment and briefly strengthened into the 5th hurricane of the Atlantic season on October 6. Hours after reaching peak winds of 90 mph (150km/h), Philippe began to progressively weaken. The storm became post-tropical just west of the Azores on October 8. No hazard was posed to land areas. Philippe’s naming on September 24 represents the second earliest arrival of a 16th named storm. (Hurricane Philippe of the 2005 season ranks first with a formation date of September 17.) Lasting a total of 15 days, it is the longest-lived tropical cyclone in the Atlantic since hurricane Bertha of 2008.
 Tropical Storm Philippe Satellite Image |
 Tropical Storm Philippe Forecast Track Saffir-Simpson Scale Color Legend |
| Tropical Cyclone | Philippe | ||||||||
| Cyclogenesis Date | 09/24 | ||||||||
| Cyclolysis Date | 10/09 | ||||||||
| Highest Saffir-Simpson Category | TS | ||||||||
| Maximum 6-hr Sustained Wind | 92 mph (80 kt or 148 km/h) | ||||||||
| Min Pressure | 976 mbar | ||||||||
| Accumulated Cyclone Energy (ACE*) Index (kt2) | 14.8425 x 10⁴ | ||||||||
| Landfall Information (date, location and sustained winds) | |||||||||
| Deaths | 0 | ||||||||
| *The (ACE) Index calculations are based on preliminary data. | |||||||||
West North Pacific Basin
 Tropical Storm Noru Satellite Image |
 Tropical Storm Noru Forecast Track Saffir-Simpson Scale Color Legend |
| Tropical Cyclone | Noru | ||||||||
| Cyclogenesis Date | 09/03 | ||||||||
| Cyclolysis Date | 09/06 | ||||||||
| Highest Saffir-Simpson Category | TS | ||||||||
| Maximum 6-hr Sustained Wind | 52 mph (45 kt or 83 km/h) | ||||||||
| Min Pressure | 990 mbar | ||||||||
| Accumulated Cyclone Energy (ACE*) Index (kt2) | 1.4600 x 10⁴ | ||||||||
| Landfall Information (date, location and sustained winds) | N/A | ||||||||
| Deaths | 0 | ||||||||
| *The (ACE) Index calculations are based on preliminary data. | |||||||||
 Tropical Storm Kulap Satellite Image |
 Tropical Storm Kulap Forecast Track Saffir-Simpson Scale Color Legend |
| Tropical Cyclone | Kulap(Nonoy) | ||||||||
| Cyclogenesis Date | 09/07 | ||||||||
| Cyclolysis Date | 09/08 | ||||||||
| Highest Saffir-Simpson Category | TS | ||||||||
| Maximum 6-hr Sustained Wind | 52 mph (45 kt or 83 km/h) | ||||||||
| Min Pressure | 1000 mbar | ||||||||
| Accumulated Cyclone Energy (ACE*) Index (kt2) | .9700 x 104 | ||||||||
| Landfall Information (date, location and sustained winds) | N/A | ||||||||
| Deaths | 0 | ||||||||
| *The (ACE) Index calculations are based on preliminary data. | |||||||||
 Tropical Storm Roke Satellite Image |
 Tropical Storm Roke Forecast Track Saffir-Simpson Scale Color Legend |
| Tropical Cyclone | Roke(Onyok) | ||||||||
| Cyclogenesis Date | 09/13 | ||||||||
| Cyclolysis Date | 09/22 | ||||||||
| Highest Saffir-Simpson Category | Cat 4 | ||||||||
| Maximum 6-hr Sustained Wind | 131 mph (115 kt or 211 km/h) | ||||||||
| Min Pressure | 940 mbar | ||||||||
| Accumulated Cyclone Energy (ACE*) Index (kt2) | 12.5700 x 10⁴ | ||||||||
| Landfall Information (date, location and sustained winds) | N/A | ||||||||
| Deaths | 0 | ||||||||
| *The (ACE) Index calculations are based on preliminary data. | |||||||||
 Tropical Storm Sonca Satellite Image |
 Tropical Storm Sonca Forecast Track Saffir-Simpson Scale Color Legend |
| Tropical Cyclone | Sonca | ||||||||
| Cyclogenesis Date | 09/15 | ||||||||
| Cyclolysis Date | 09/20 | ||||||||
| Highest Saffir-Simpson Category | Cat 2 | ||||||||
| Maximum 6-hr Sustained Wind | 98 mph (85 kt or 157 km/h) | ||||||||
| Min Pressure | 970 mbar | ||||||||
| Accumulated Cyclone Energy (ACE*) Index (kt2) | 8.5500 x 10⁴ | ||||||||
| Landfall Information (date, location and sustained winds) | N/A | ||||||||
| Deaths | 0 | ||||||||
| *The (ACE) Index calculations are based on preliminary data. | |||||||||
 Tropical Storm Nesat Satellite Image |
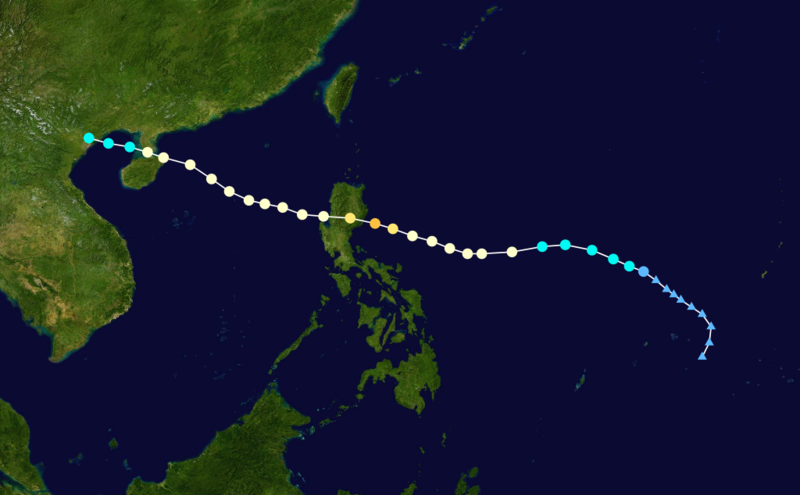 Tropical Storm Nesat Forecast Track Saffir-Simpson Scale Color Legend |
| Tropical Cyclone | Nesat(Pedring) | ||||||||
| Cyclogenesis Date | 09/23 | ||||||||
| Cyclolysis Date | 09/30 | ||||||||
| Highest Saffir-Simpson Category | Cat 3 | ||||||||
| Maximum 6-hr Sustained Wind | 121 mph (105 kt or 194 km/h) | ||||||||
| Min Pressure | 950 mbar | ||||||||
| Accumulated Cyclone Energy (ACE*) Index (kt2) | 12.9350 x 10⁴ | ||||||||
| Landfall Information (date, location and sustained winds) | 09/27– Luzon, Philippines (95 kt or 176 km /h) 09/29– Hainan, China (65 kt or 120 km /h) 09/30– northen Vietnam (55 kt or 102 km /h) |
||||||||
| Deaths | 61 | ||||||||
| *The (ACE) Index calculations are based on preliminary data. | |||||||||
 Tropical Storm Nalgae Satellite Image |
 Tropical Storm Nalgae Forecast Track Saffir-Simpson Scale Color Legend |
| Tropical Cyclone | Nalgae(Quiel) | ||||||||
| Cyclogenesis Date | 09/28 | ||||||||
| Cyclolysis Date | 10/04 | ||||||||
| Highest Saffir-Simpson Category | Cat 4 | ||||||||
| Maximum 6-hr Sustained Wind | 150 mph (130 kt or 241 km/h) | ||||||||
| Min Pressure | 935 mbar | ||||||||
| Accumulated Cyclone Energy (ACE*) Index (kt2) | 13.5475 x 10⁴ | ||||||||
| Landfall Information (date, location and sustained winds) | 10/01– Luzon, Philippines (86 kt or 160 km /h) | ||||||||
| Deaths | 10 | ||||||||
| *The (ACE) Index calculations are based on preliminary data. | |||||||||
East North Pacific Basin
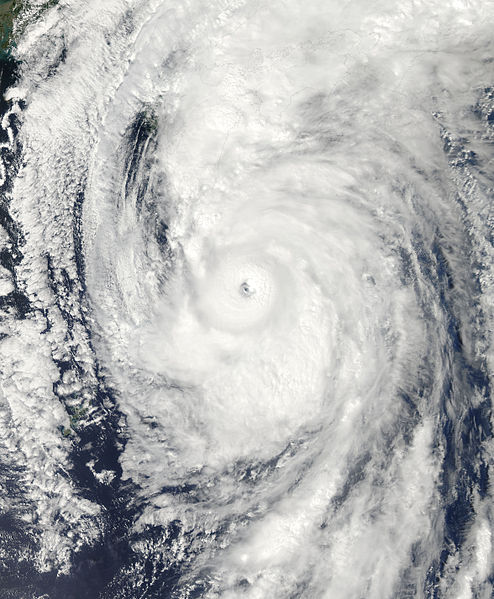
Hurricane Hilary initially formed in the southeast Gulf of Tehuantepec near mid-September. On September 21, the disturbance was declared a tropical depression, six hours after which Tropical Storm Hilary was named. The following day, Hilary intensified into the 7th hurricane of the Eastern Pacific season as well as a major hurricane. Bounded by easterlies to the south and a mid-level subtropical ridge to the north, Hilary steered west-northwestward which kept its core offshore. At its closest, the small storm passed 75 miles (120 km) parallel to the southwest coastline of Mexico, where its outer bands produced 24-hour rains accumulating to 8.58 inches (218 mm) in the state of Tabasco. In the Mexican state of Colima, wave heights reached 9-15 feet (2.7-4.6 m). Continuing its rapid intensification, Hilary became a Category 4 hurricane over the open Pacific the morning of September 23. During this time, the Tropical Rainfall Measuring Mission (TRMM) recorded cloud top temperatures of -63 degrees F (-52 degrees C), cloud heights which extended 8.6 miles (14 km) vertically around the eye wall, and bands of precipitation capable of producing 2 inches (50 mm) of rainfall per hour. As it departed the basin’s warmest waters, Hilary began to steadily weaken and had lost all tropical characteristics by September 30. The storm never made landfall. Hilary is the Eastern Pacific’s fourth Category 4 hurricane this season, and with maximum sustained winds of 145 mph (230 km/h), it is the second strongest behind Hurricane Dora of July.
 Tropical Storm Hilary Satellite Image |
 Tropical Storm Hilary Forecast Track Saffir-Simpson Scale Color Legend |
| Tropical Cyclone | Hilary | ||||||||
| Cyclogenesis Date | 09/21 | ||||||||
| Cyclolysis Date | 09/30 | ||||||||
| Highest Saffir-Simpson Category | Cat 4 | ||||||||
| Maximum 6-hr Sustained Wind | 144 mph (125 kt or 232 km/h) | ||||||||
| Min Pressure | 944 mbar | ||||||||
| Accumulated Cyclone Energy (ACE*) Index (kt2) | N/A | ||||||||
| Landfall Information (date, location and sustained winds) | |||||||||
| Deaths | 0 | ||||||||
| *The (ACE) Index calculations are based on preliminary data. | |||||||||