Note: This report catalogs recent tropical cyclones across the North Atlantic and East Pacific and places each basin’s tropical cyclone activity in a climate-scale context. It is not updated in real time. Users seeking the real time status and forecasts of tropical cyclones should visit The National Hurricane Center.
East North Pacific Basin
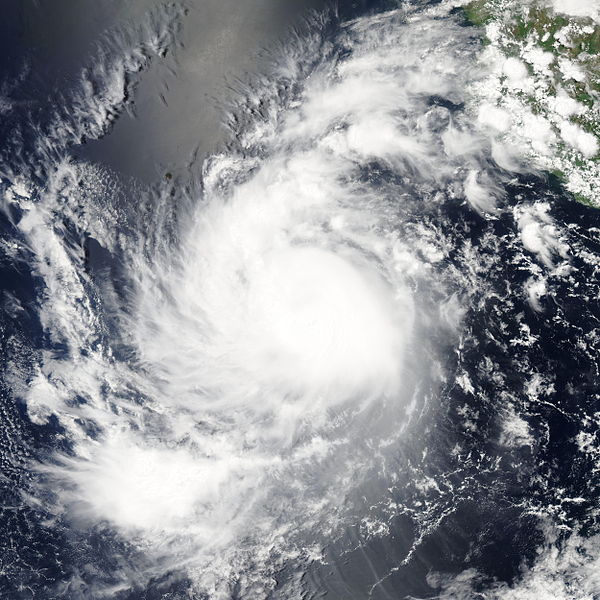 Tropical Storm Calvin Satellite Image |
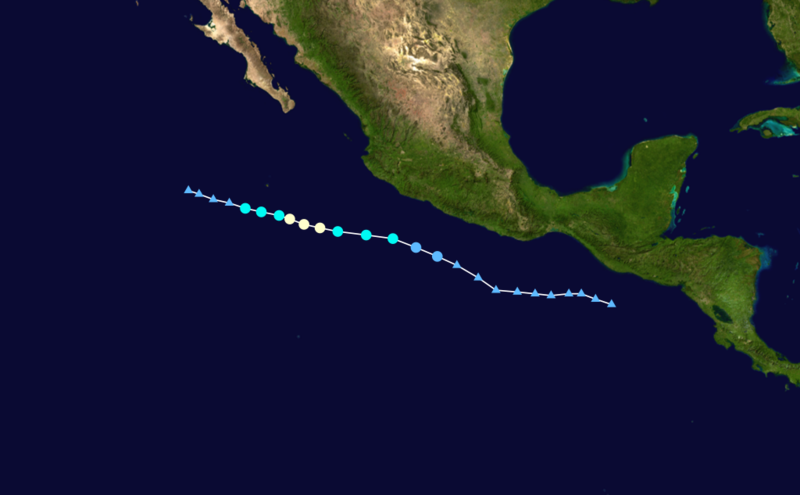 Tropical Storm Calvin Forecast Track  Saffir-Simpson Scale Color Legend |
| Tropical Cyclone | Calvin | ||||||||
| Cyclogenesis Date | 07/08 | ||||||||
| Cyclolysis Date | 07/10 | ||||||||
| Highest Saffir-Simpson Category | Cat 1 | ||||||||
| Maximum 6-hr Sustained Wind | 92 mph (80 kt or 148 km/h) | ||||||||
| Min Pressure | 984 mbar | ||||||||
| Accumulated Cyclone Energy (ACE*) Index (kt2) | 3.5950 x 10⁴ | ||||||||
| Landfall Information (date, location and sustained winds) | |||||||||
| Deaths | 0 | ||||||||
| *The (ACE) Index calculations are based on preliminary data. | |||||||||
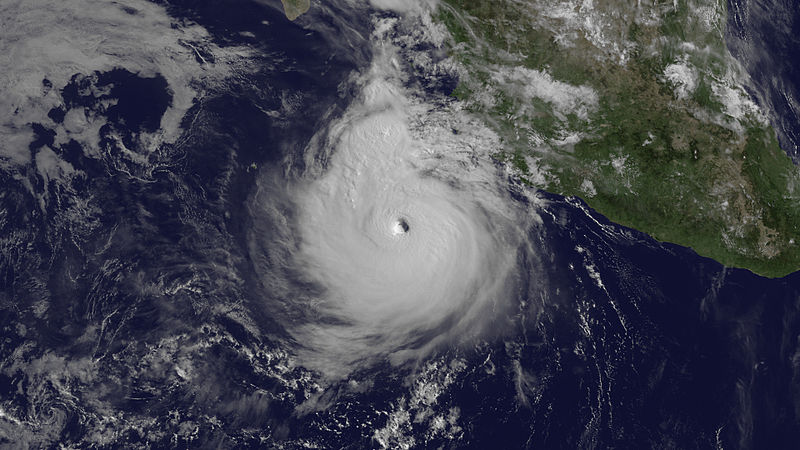 Tropical Storm Dora Satellite Image |
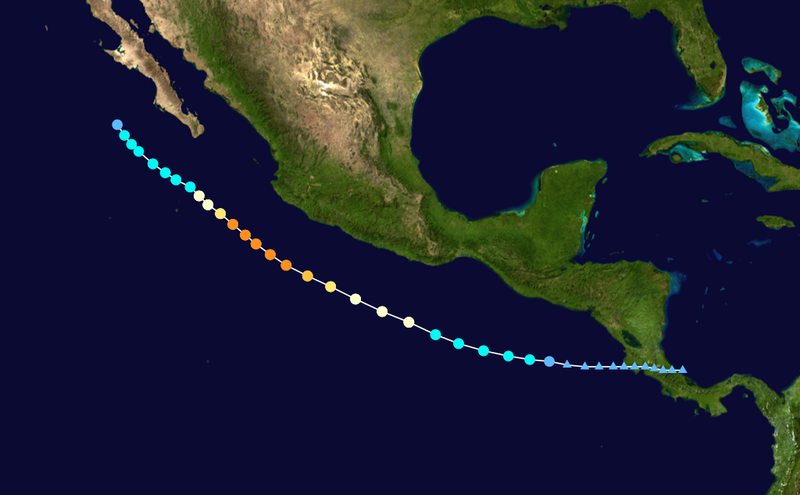 Tropical Storm Dora Forecast Track Saffir-Simpson Scale Color Legend |
| Tropical Cyclone | Dora | ||||||||
| Cyclogenesis Date | 07/18 | ||||||||
| Cyclolysis Date | 07/24 | ||||||||
| Highest Saffir-Simpson Category | Cat 4 | ||||||||
| Maximum 6-hr Sustained Wind | 138 mph (120 kt or 222 km/h) | ||||||||
| Min Pressure | 929 mbar | ||||||||
| Accumulated Cyclone Energy (ACE*) Index (kt2) | 14.6675 x 10⁴ | ||||||||
| Landfall Information (date, location and sustained winds) | |||||||||
| Deaths | 0 | ||||||||
| *The (ACE) Index calculations are based on preliminary data. | |||||||||
 Tropical Storm Eugene Satellite Image |
 Tropical Storm Eugene Forecast Track Saffir-Simpson Scale Color Legend |
| Tropical Cyclone | Eugene | ||||||||
| Cyclogenesis Date | 07/31 | ||||||||
| Cyclolysis Date | 08/06 | ||||||||
| Highest Saffir-Simpson Category | Cat 4 | ||||||||
| Maximum 6-hr Sustained Wind | 138 mph (120 kt or 222 km/h) | ||||||||
| Min Pressure | 942 mbar | ||||||||
| Accumulated Cyclone Energy (ACE*) Index (kt2) | 14.6675 x 10⁴ | ||||||||
| Landfall Information (date, location and sustained winds) | |||||||||
| Deaths | 0 | ||||||||
| *The (ACE) Index calculations are based on preliminary data. | |||||||||
West North Pacific Basin
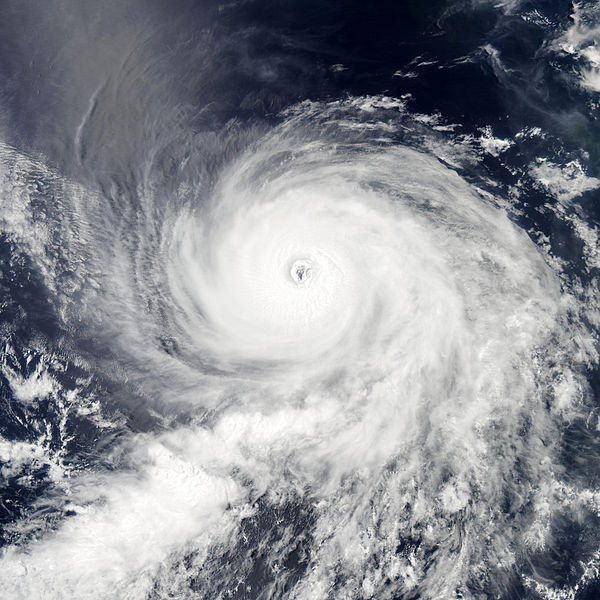
 Tropical Storm Ma-on Satellite Image |
 Tropical Storm Ma-on Forecast Track Saffir-Simpson Scale Color Legend |
| Tropical Cyclone | Ma-on | ||||||||
| Cyclogenesis Date | 07/12 | ||||||||
| Cyclolysis Date | 07/21 | ||||||||
| Highest Saffir-Simpson Category | Cat 4 | ||||||||
| Maximum 6-hr Sustained Wind | 132 mph (115 kt or 213 km/h) | ||||||||
| Min Pressure | 935 mbar | ||||||||
| Accumulated Cyclone Energy (ACE*) Index (kt2) | 24.8525 x 10⁴ | ||||||||
| Landfall Information (date, location and sustained winds) | 07/19 - Southern coast of Shikoku Island, Japan (65 kt or 120 km/h) | ||||||||
| Deaths | 0 | ||||||||
| *The (ACE) Index calculations are based on preliminary data. | |||||||||
 Tropical Storm Nock-ten Satellite Image |
 Tropical Storm Nock-ten Forecast Track Saffir-Simpson Scale Color Legend |
| Tropical Cyclone | Nock-ten(Juaning) | ||||||||
| Cyclogenesis Date | 07/26 | ||||||||
| Cyclolysis Date | 07/30 | ||||||||
| Highest Saffir-Simpson Category | Cat 1 | ||||||||
| Maximum 6-hr Sustained Wind | 75 mph (65 kt or 120 km/h) | ||||||||
| Min Pressure | 984 mbar | ||||||||
| Accumulated Cyclone Energy (ACE*) Index (kt2) | 4.4325 x 10⁴ | ||||||||
| Landfall Information (date, location and sustained winds) | 07/27 - Northern coast of Luzon, Philippines (65 kt or 120 km/h) 07/29 - Southern China (55 kt or 102 km/h) 07/30 - Northern coast of Vietnam (45 kt or 83 km/h) |
||||||||
| Deaths | 100 | ||||||||
| *The (ACE) Index calculations are based on preliminary data. | |||||||||
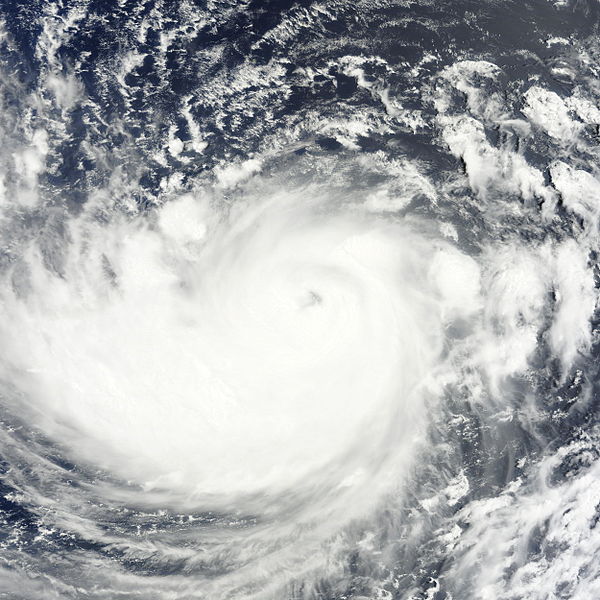
 Tropical Storm Muifa Satellite Image |
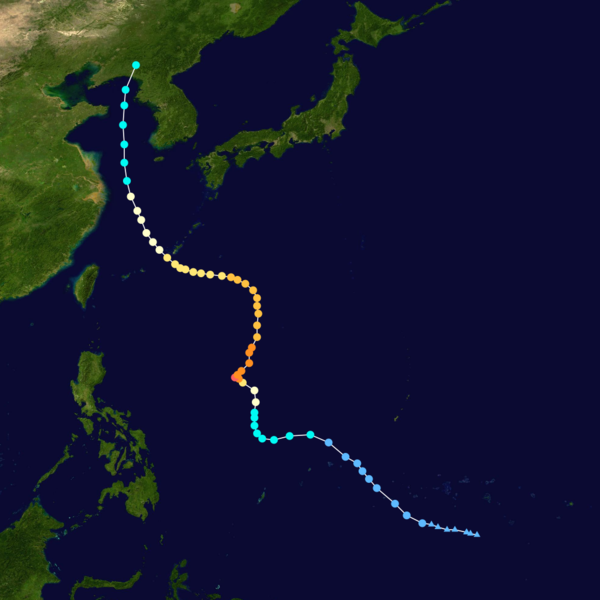 Tropical Storm Muifa Forecast Track Saffir-Simpson Scale Color Legend |
| Tropical Cyclone | Muifa(Kabayan) | ||||||||
| Cyclogenesis Date | 07/28 | ||||||||
| Cyclolysis Date | 08/08 | ||||||||
| Highest Saffir-Simpson Category | Cat 5 | ||||||||
| Maximum 6-hr Sustained Wind | 161 mph (140 kt or 259 km/h) | ||||||||
| Min Pressure | 930 mbar | ||||||||
| Accumulated Cyclone Energy (ACE*) Index (kt2) | 36.2025 x 10⁴ | ||||||||
| Landfall Information (date, location and sustained winds) | 08/08 - Yalu River (50 kt or 93 km/h) | ||||||||
| Deaths | 22 | ||||||||
| *The (ACE) Index calculations are based on preliminary data. | |||||||||
Atlantic Basin
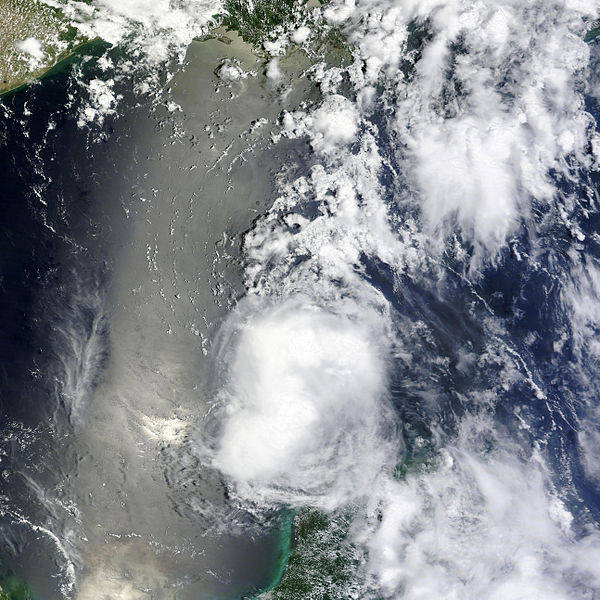
 Tropical Storm Bret Satellite Image |
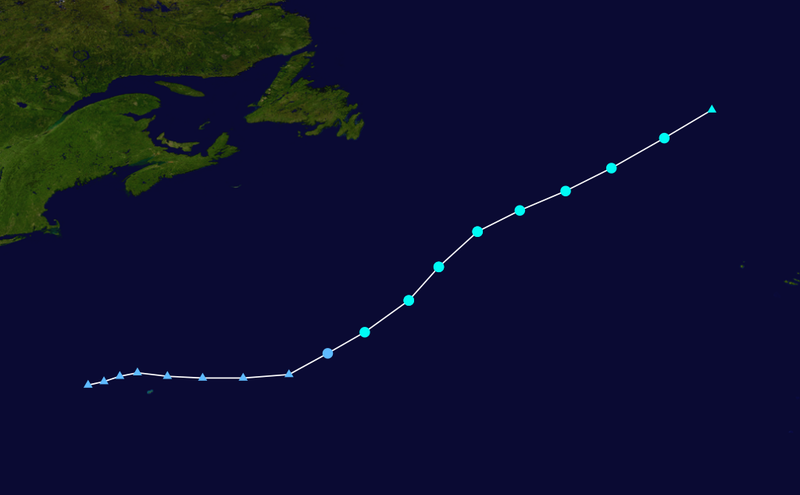
 Tropical Storm Bret Forecast Track Saffir-Simpson Scale Color Legend |
| Tropical Cyclone | Bret | ||||||||
| Cyclogenesis Date | 07/18 | ||||||||
| Cyclolysis Date | 07/21 | ||||||||
| Highest Saffir-Simpson Category | TS | ||||||||
| Maximum 6-hr Sustained Wind | 63 mph (55 kt or 102 km/h) | ||||||||
| Min Pressure | 996 mbar | ||||||||
| Accumulated Cyclone Energy (ACE*) Index (kt2) | 2.9450 x 10⁴ | ||||||||
| Landfall Information (date, location and sustained winds) | |||||||||
| Deaths | 0 | ||||||||
| *The (ACE) Index calculations are based on preliminary data. | |||||||||
 Tropical Storm Cindy Satellite Image |
 Tropical Storm Cindy Forecast Track Saffir-Simpson Scale Color Legend |
| Tropical Cyclone | Cindy | ||||||||
| Cyclogenesis Date | 07/20 | ||||||||
| Cyclolysis Date | 07/22 | ||||||||
| Highest Saffir-Simpson Category | TS | ||||||||
| Maximum 6-hr Sustained Wind | 58 mph (50 kt or 93 km/h) | ||||||||
| Min Pressure | 1000 mbar | ||||||||
| Accumulated Cyclone Energy (ACE*) Index (kt2) | 1.8425 x 10⁴ | ||||||||
| Landfall Information (date, location and sustained winds) | |||||||||
| Deaths | 0 | ||||||||
| *The (ACE) Index calculations are based on preliminary data. | |||||||||
 Tropical Storm Don Satellite Image |
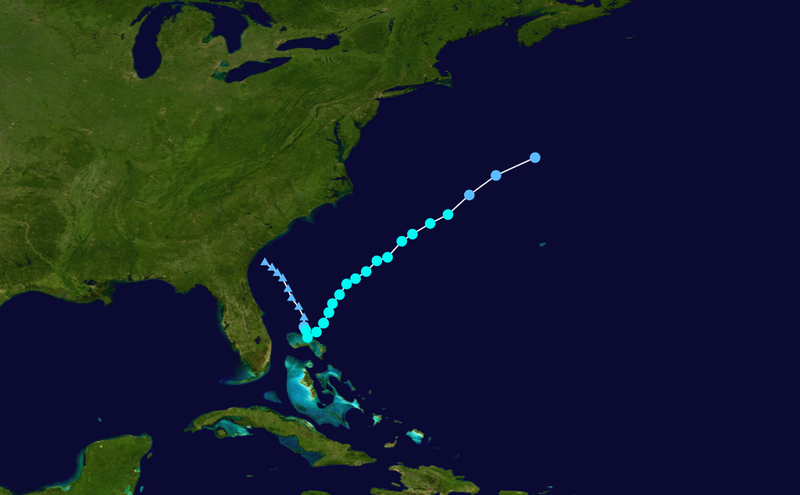
 Tropical Storm Don Forecast Track Saffir-Simpson Scale Color Legend |
| Tropical Cyclone | Don | ||||||||
| Cyclogenesis Date | 07/28 | ||||||||
| Cyclolysis Date | 07/29 | ||||||||
| Highest Saffir-Simpson Category | TS | ||||||||
| Maximum 6-hr Sustained Wind | 52 mph (45 kt or 83 km/h) | ||||||||
| Min Pressure | 998 mbar | ||||||||
| Accumulated Cyclone Energy (ACE*) Index (kt2) | 1.3325 x 10⁴ | ||||||||
| Landfall Information (date, location and sustained winds) | |||||||||
| Deaths | 0 | ||||||||
| *The (ACE) Index calculations are based on preliminary data. | |||||||||