East North Pacific Basin
Originating several hundred miles southwest of Acapulco, Mexico, Jova gradually strengthened into a tropical storm on the afternoon of October 6. Set in a favorable environment, the storm became a hurricane on October 8, and by October 10 had intensified to a strong Category 3 storm–the 5th major hurricane of the eastern Pacific season. A day prior to landfall, the storm began an eyewall replacement cycle and weakened to a minimal Category 2 hurricane. It maintained this intensity as it made landfall in the Mexican state of Jalisco just prior to midnight on October 11. With winds of 100 mph (km/h), Jova was the strongest hurricane to hit Mexico’s Pacific coast since Hurricane Jimena of 2009 (winds of 105 mph). A small storm with winds extending outward a modest 15 miles (24 km) from its center, Jova’s main threat was from torrential rains which triggered flooding and mudslides, claimed 8 lives, and caused an estimated $27.7 million (U.S. dollars) in damages. Coquimatlan, Colima, Mexico reported the highest rainfall total with 14.74 inches (374.4 mm); this challenges the state’s all-time record hurricane rainfall of 15.57 inches (395.5 mm) set in 1998 by Hurricane Javier. As the storm passed over the rugged terrain of western Mexico, it quickly dissipated, becoming post-tropical within 24 hours.
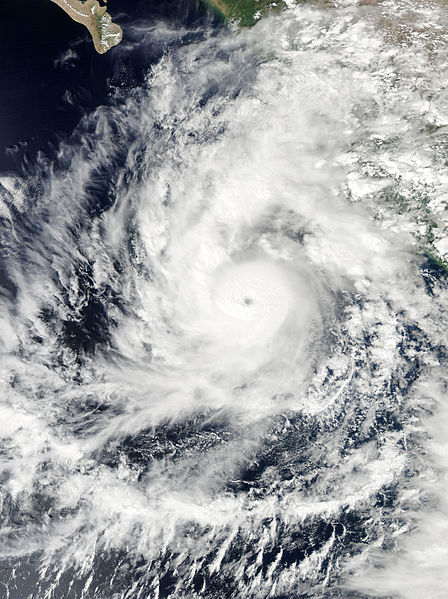 Tropical Storm Jova Satellite Image |
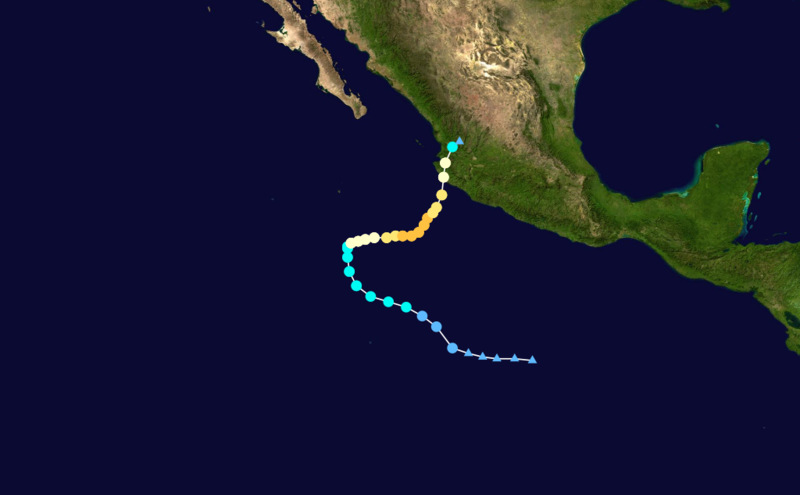 Tropical Storm Jova Forecast Track  Saffir-Simpson Scale Color Legend |
| Tropical Cyclone | Jova | ||||||||
| Cyclogenesis Date | 10/06 | ||||||||
| Cyclolysis Date | 10/12 | ||||||||
| Highest Saffir-Simpson Category | Cat 3 | ||||||||
| Maximum 6-hr Sustained Wind | 127 mph (110 kt or 204 km/h) | ||||||||
| Min Pressure | 955 mbar | ||||||||
| Accumulated Cyclone Energy (ACE*) Index (kt2) | 14.5200 x 10⁴ | ||||||||
| Landfall Information (date, location and sustained winds) | 10/12 – Jalisco, Mexico (85 kt or 157 km /h) | ||||||||
| Deaths | 8 | ||||||||
| *The (ACE) Index calculations are based on preliminary data. | |||||||||
On the morning of October 6, an area of disturbed weather emerged 700 miles (1126.5 km) northwest of Tropical Depression Ten-E (Jova). Just 5 hours later, it surpassed Jova in strength, and was named Tropical Storm Irwin. Irwin strengthened to a Category 1 hurricane the following day, then downgraded on October 8; the storm fluctuated between tropical storm and tropical depression intensity the remainder of its lifespan. While initially forecast to impact the same stretch of coastline as Jova, Irwin came within 145 miles (235 km) of Manzanillo, Mexico, then drifted southwestward back into the Pacific–an unusual track for an eastern Pacific tropical cyclone, the majority of which move west-northwestward. On October 16, the storm became a remnant low while out to sea.
 Tropical Storm Irwin Satellite Image |
 Tropical Storm Irwin Forecast Track Saffir-Simpson Scale Color Legend |
| Tropical Cyclone | Irwin | ||||||||
| Cyclogenesis Date | 10/06 | ||||||||
| Cyclolysis Date | 10/15 | ||||||||
| Highest Saffir-Simpson Category | Cat 1 | ||||||||
| Maximum 6-hr Sustained Wind | 92 mph (80 kt or 148 km/h) | ||||||||
| Min Pressure | 977 mbar | ||||||||
| Accumulated Cyclone Energy (ACE*) Index (kt2) | N/A | ||||||||
| Landfall Information (date, location and sustained winds) | 7.9825 x 10⁴ | ||||||||
| Deaths | 0 | ||||||||
| *The (ACE) Index calculations are based on preliminary data. | |||||||||
Atlantic Basin
Near mid-October, a large low pressure system located within 100 miles (170 km) of the Nicaragua-Honduras border brought 3 to 10 inches (76.2 to 254 mm) of precipitation to locations in South Florida, Cuba, and the Yucatan Peninsula. On October 23, the system organized into a tropical depression and was named Tropical Storm Rina by that day’s close. Twenty–one hours later, Rina strengthened to the 6th hurricane of the Atlantic season. It peaked as a strong Category 2 storm, then weakened, making landfall near Cozumel, Mexico on the night of October 27 as a tropical storm. Rainfall totals included 8.2 inches (208 mm) in Cozumel and 1.89 inches (48 mm) in the popular tourist locale of Cancun. While no injuries were reported, an estimated 10,000 tourists evacuated the region. The following day, the storm degenerated to a remnant low over the Yucatan Channel. Its moisture was absorbed into the southerly flow of a rare 2011 Halloween nor’easter which affected the mid-Atlantic and Northeastern U.S.
 Tropical Storm Rina Satellite Image |
 Tropical Storm Rina Forecast Track Saffir-Simpson Scale Color Legend |
| Tropical Cyclone | Rina | ||||||||
| Cyclogenesis Date | 10/24 | ||||||||
| Cyclolysis Date | 10/28 | ||||||||
| Highest Saffir-Simpson Category | Cat 2 | ||||||||
| Maximum 6-hr Sustained Wind | 109 mph (95 kt or 176 km/h) | ||||||||
| Min Pressure | 966 mbar | ||||||||
| Accumulated Cyclone Energy (ACE*) Index (kt2) | 9.2075 x 10⁴ | ||||||||
| Landfall Information (date, location and sustained winds) | N/A | ||||||||
| Deaths | 0 | ||||||||
| *The (ACE) Index calculations are based on preliminary data. | |||||||||