North Indian Basin
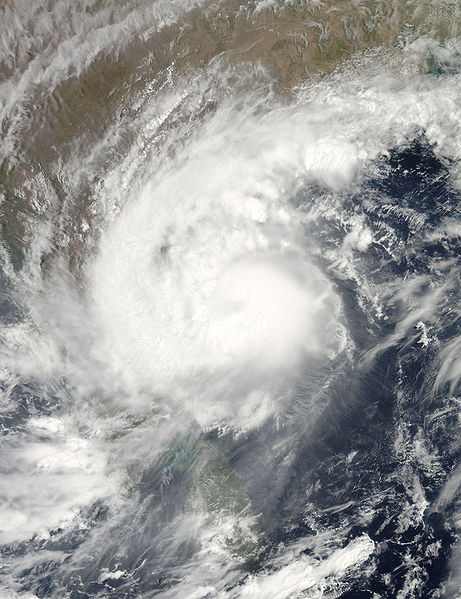 Tropical Storm Laila Satellite Image |
 Tropical Storm Laila Track  Saffir-Simpson Scale Color Legend | ||||||||
| Tropical Cyclone | Laila | ||||||||
| Cyclogenesis Date | 05/17 | ||||||||
| Cyclolysis Date | 05/21 | ||||||||
| Highest Saffir-Simpson Category | Cat 1 | ||||||||
| Maximum 6-hr Sustained Wind | 75 mph (65 kt or 120 km/h) | ||||||||
| Min Pressure | 986 mbar | ||||||||
| Accumulated Cyclone Energy (ACE*) Index (kt2) | 4.4600 x 10⁴ | ||||||||
| Landfall Information (date, location and sustained winds) | 05/20 - Bapta Guntur, Andhra Pradesh, India ( 105 km/h) | ||||||||
| Deaths | 56 | ||||||||
| *The (ACE) Index calculations are based on preliminary data. | |||||||||
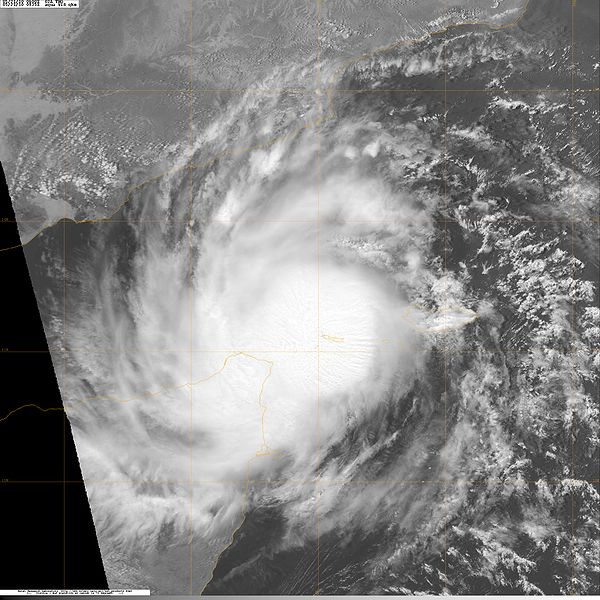 Tropical Storm Bandu Satellite Image |
 Tropical Storm Bandu Track Saffir-Simpson Scale Color Legend | ||||||||
| Tropical Cyclone | Bandu | ||||||||
| Cyclogenesis Date | 05/19 | ||||||||
| Cyclolysis Date | 05/22 | ||||||||
| Highest Saffir-Simpson Category | TS | ||||||||
| Maximum 6-hr Sustained Wind | 63 mph (55 kt or 102 km/h) | ||||||||
| Min Pressure | 994 mbar | ||||||||
| Accumulated Cyclone Energy (ACE*) Index (kt2) | 2.6725 x 10⁴ | ||||||||
| Landfall Information (date, location and sustained winds) | |||||||||
| Deaths | 1 | ||||||||
| *The (ACE) Index calculations are based on preliminary data. | |||||||||
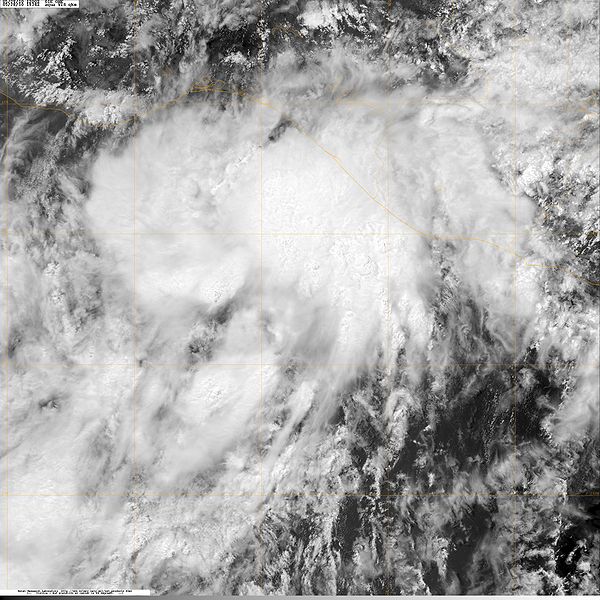
 Tropical Storm Phet Satellite Image |
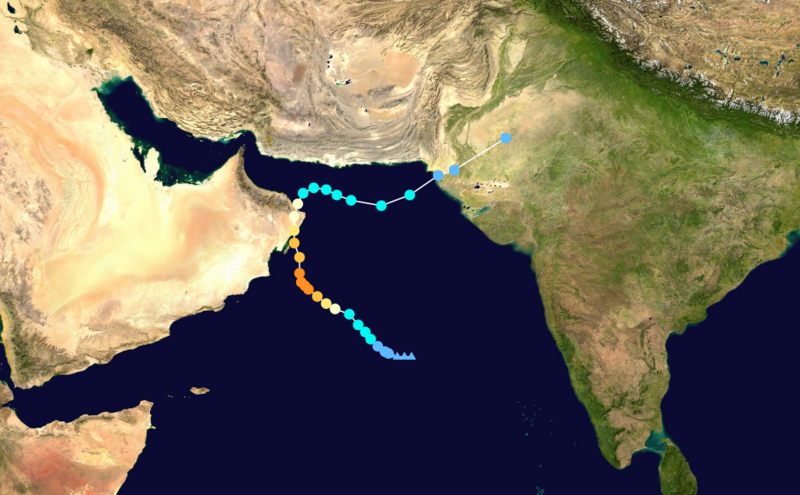 Tropical Storm Phet Track Saffir-Simpson Scale Color Legend | ||||||||
| Tropical Cyclone | Phet | ||||||||
| Cyclogenesis Date | 05/31 | ||||||||
| Cyclolysis Date | 06/06 | ||||||||
| Highest Saffir-Simpson Category | Cat 4 | ||||||||
| Maximum 6-hr Sustained Wind | 144 mph (125 kt or 232 km/h) | ||||||||
| Min Pressure | 970 mbar | ||||||||
| Accumulated Cyclone Energy (ACE*) Index (kt2) | 14.1375 x 10⁴ | ||||||||
| Landfall Information (date, location and sustained winds) | 06/04 - Oman Desert, Oman (145 km/h) and Thatta District, Sindh, Pakistan (56 km/h) | ||||||||
| Deaths | 44 | ||||||||
| *The (ACE) Index calculations are based on preliminary data. | |||||||||
Northeast Pacific Basin
 Tropical Storm Agatha Satellite Image |
 Tropical Storm Agatha Track Saffir-Simpson Scale Color Legend | ||||||||
The Eastern Pacific hurricane season officially began on May 15th. Tropical Storm Agatha was the first tropical cyclone for the basin this season. Agatha formed rapidly off the Guatemalan coast on May 29th with sustained winds of 45 miles per hour (72 km/hr), and the storm made landfall near the Guatemalan-Mexican border on the same day. The main impact of Agatha was heavy rainfall in Guatemala, Honduras, and El Salvador. Over three feet (0.9 meters) of rain were reported in mountainous areas, which caused numerous landslides. A giant sink hole was created in the densely populated Guatemala City during the storm. According to the Associated Press, 184 people were killed in Central America due to impacts of the storm, and hundreds of thousands were forced to evacuate vulnerable areas. More information on Tropical Storm Agatha is available from the NOAA National Hurricane Center. | |||||||||
| Tropical Cyclone | Agatha | ||||||||
| Cyclogenesis Date | 05/29 | ||||||||
| Cyclolysis Date | 05/29 | ||||||||
| Highest Saffir-Simpson Category | TS | ||||||||
| Maximum 6-hr Sustained Wind | 45 mph (40 kt or 72 km/h) | ||||||||
| Min Pressure | 1000 mbar | ||||||||
| Accumulated Cyclone Energy (ACE*) Index (kt2) | .2825 x 104 | ||||||||
| Landfall Information (date, location and sustained winds) | 05/29 - Mexico-Guatemala border ( 72 km/h) | ||||||||
| Deaths | 184 | ||||||||
| *The (ACE) Index calculations are based on preliminary data. | |||||||||