Note: This report catalogs recent tropical cyclones across the North Atlantic and East Pacific and places each basin’s tropical cyclone activity in a climate-scale context. It is not updated in real time. Users seeking the real time status and forecasts of tropical cyclones should visit The National Hurricane Center.
South Indian Basin
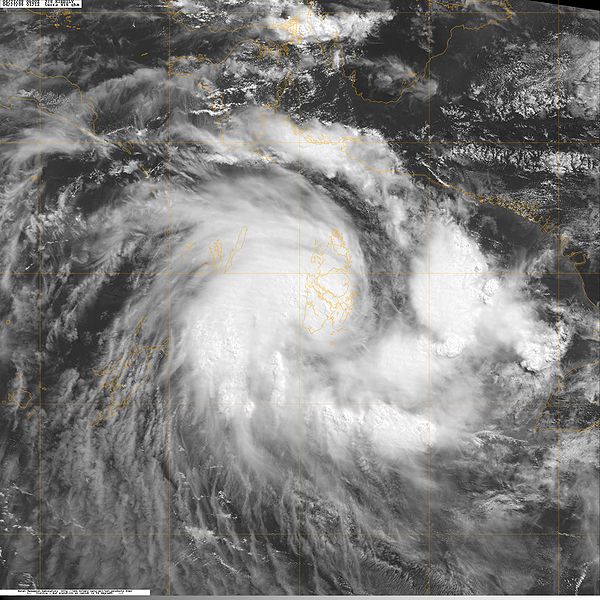
 Tropical Storm Jade Satellite Image |
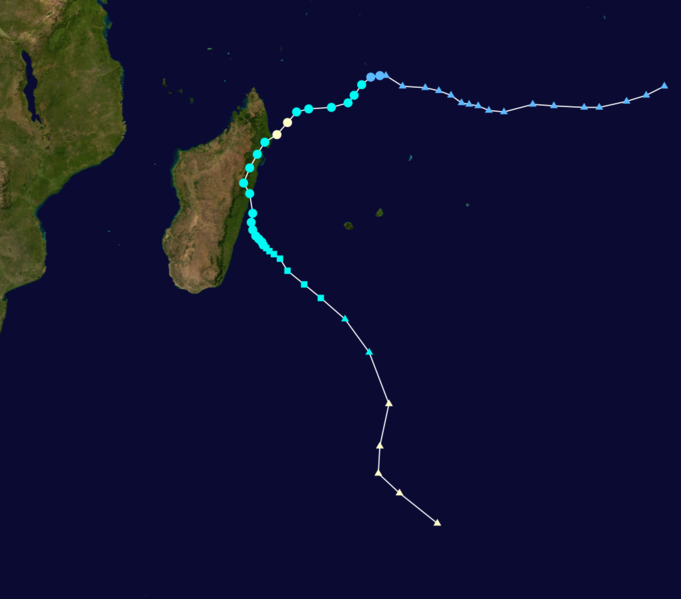 Tropical Storm Jade Track  Saffir-Simpson Scale Color Legend | ||||||||
| Tropical Cyclone | Jade | ||||||||
| Cyclogenesis Date | 04/04 | Cyclolysis Date | 04/10 | ||||||
| Highest Saffir-Simpson Category | Cat 1 | ||||||||
| Maximum 6-hr Sustained Wind | 75 mph (65 kt or 120 km/h) | ||||||||
| Min Pressure | 975 mbar | ||||||||
| Accumulated Cyclone Energy (ACE*) Index (kt2) | 4.9813 x 10⁴ | ||||||||
| Landfall Information (date, location and sustained winds) | 04/05 - northeastern Madagascar (65 kt or 120km/h) | ||||||||
| Deaths | 15 | ||||||||
| *The (ACE) Index calculations are based on preliminary data. | |||||||||
South Pacific Basin
 Tropical Storm Lin Satellite Image |
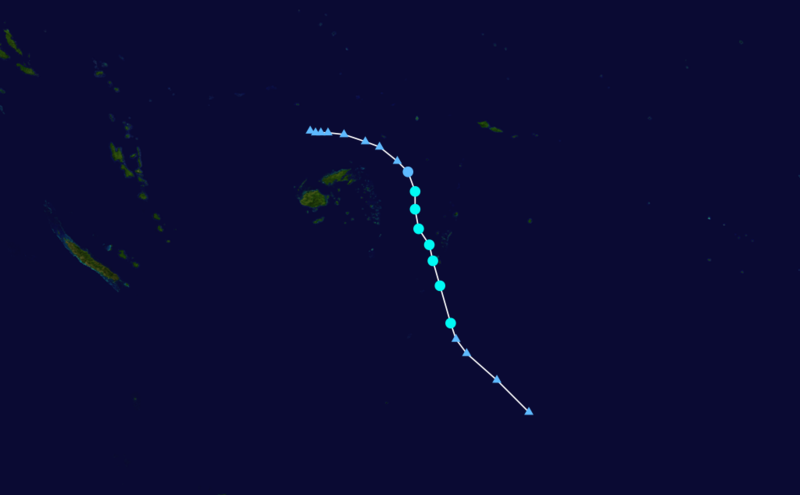 Tropical Storm Lin Track Saffir-Simpson Scale Color Legend | ||||||||
| Tropical Cyclone | Lin | ||||||||
| Cyclogenesis Date | 04/04 | Cyclolysis Date | 04/05 | ||||||
| Highest Saffir-Simpson Category | TS | ||||||||
| Maximum 6-hr Sustained Wind | 58 mph (50 kt or 93 km/h) | ||||||||
| Min Pressure | 975 mbar | ||||||||
| Accumulated Cyclone Energy (ACE*) Index (kt2) | 1.1012 x 10⁴ | ||||||||
| Landfall Information (date, location and sustained winds) | N/A | ||||||||
| Deaths | 0 | ||||||||
| *The (ACE) Index calculations are based on preliminary data. | |||||||||
North Indian Ocean
 Tropical Storm Bijli Satellite Image |
 Tropical Storm Bijli Track Saffir-Simpson Scale Color Legend | ||||||||
| Tropical Cyclone | Bijli | ||||||||
| Cyclogenesis Date | 04/15 | Cyclolysis Date | 04/28 | ||||||
| Highest Saffir-Simpson Category | TS | ||||||||
| Maximum 6-hr Sustained Wind | 58 mph (50 kt or 93 km/h) | ||||||||
| Min Pressure | 996 mbar | ||||||||
| Accumulated Cyclone Energy (ACE*) Index (kt2) | 2.3800 x 10⁴ | ||||||||
| Landfall Information (date, location and sustained winds) | N/A | ||||||||
| Deaths | 0 | ||||||||
| *The (ACE) Index calculations are based on preliminary data. | |||||||||
Australian Basin
 Tropical Storm Kirrily Satellite Image  Australian Scale Color Legend |
 Tropical Storm Kirrily Track Saffir-Simpson Scale Color Legend | ||||||||
| Tropical Cyclone | Kirrily | ||||||||
| Cyclogenesis Date | 04/26 | Cyclolysis Date | 04/28 | ||||||
| Highest Australian Category | Cat 1 | Maximum Gust | 72 km/h | ||||||
| Highest Saffir-Simpson Category | TS | ||||||||
| Maximum 6-hr Sustained Wind | 46 mph (40 kt or 74 km/h) | ||||||||
| Min Pressure | 998 mbar | ||||||||
| Accumulated Cyclone Energy (ACE*) Index (kt2) | .6863 x 104 | ||||||||
| Landfall Information (date, location and sustained winds) | N/A | ||||||||
| Deaths | 0 | ||||||||
| *The (ACE) Index calculations are based on preliminary data. | |||||||||