Note: This report catalogs recent tropical cyclones across the North Atlantic and East Pacific and places each basin’s tropical cyclone activity in a climate-scale context. It is not updated in real time. Users seeking the real time status and forecasts of tropical cyclones should visit The National Hurricane Center.
Atlantic Basin
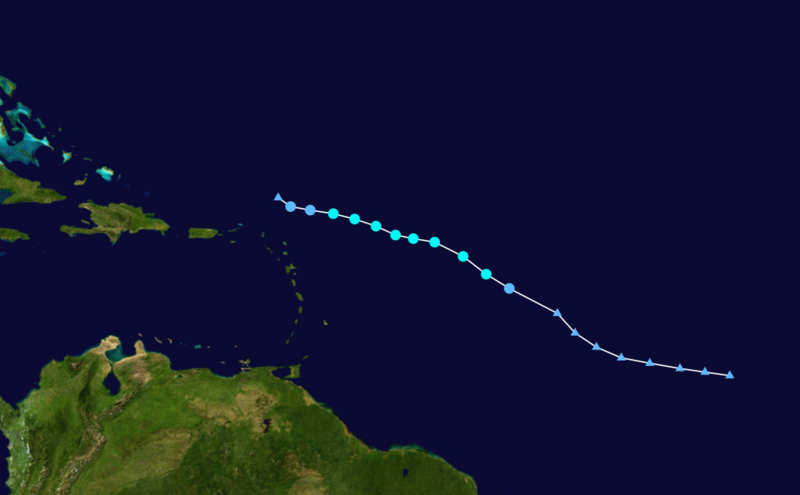
 Tropical Storm Grace Satellite Image |
 Tropical Storm Grace Track  Saffir-Simpson Scale Color Legend | ||||||||
| Tropical Cyclone | Grace | ||||||||
| Cyclogenesis Date | 10/04 | ||||||||
| Cyclolysis Date | 10/05 | ||||||||
| Highest Saffir-Simpson Category | TS | ||||||||
| Maximum 6-hr Sustained Wind | 69 mph (60 kt or 111 km/h) | ||||||||
| Min Pressure | 990 mbar | ||||||||
| Accumulated Cyclone Energy (ACE*) Index (kt2) | 2.0225 x 10⁴ | ||||||||
| Landfall Information (date, location and sustained winds) | N/A | ||||||||
| Deaths | 0 | ||||||||
| *The (ACE) Index calculations are based on preliminary data. | |||||||||
More information on Grace is available from the NOAA National Hurricane Center.
 Tropical Storm Henri Satellite Image |
 Tropical Storm Henri Track Saffir-Simpson Scale Color Legend | ||||||||
| Tropical Cyclone | Henri | ||||||||
| Cyclogenesis Date | 10/06 | ||||||||
| Cyclolysis Date | 10/07 | ||||||||
| Highest Saffir-Simpson Category | TS | ||||||||
| Maximum 6-hr Sustained Wind | 52 mph (45 kt or 83 km/h) | ||||||||
| Min Pressure | 1005 mbar | ||||||||
| Accumulated Cyclone Energy (ACE*) Index (kt2) | .7675 x 104 | ||||||||
| Landfall Information (date, location and sustained winds) | N/A | ||||||||
| Deaths | 0 | ||||||||
| *The (ACE) Index calculations are based on preliminary data. | |||||||||
More information on Henri is available from the NOAA National Hurricane Center.
Northeast Pacific Basin
 Tropical Storm Patricia Satellite Image |
 Tropical Storm Patrica Track Saffir-Simpson Scale Color Legend | ||||||||
| Tropical Cyclone | Patricia | ||||||||
| Cyclogenesis Date | 10/12 | ||||||||
| Cyclolysis Date | 10/14 | ||||||||
| Highest Saffir-Simpson Category | TS | ||||||||
| Max Wind | 58 mph (50 kt or 93 km/h) | ||||||||
| Min Pressure | 997 mbar | ||||||||
| Accumulated Cyclone Energy (ACE*) Index (kt2) | 1.7675 x 10⁴ | ||||||||
| Landfall Information (date, location and sustained winds) | N/A | ||||||||
| Deaths | 0 | ||||||||
| *The (ACE) Index calculations are based on preliminary data. | |||||||||
More information on Patricia is available from the NOAA National Hurricane Center.
 Tropical Storm Rick Satellite Image |
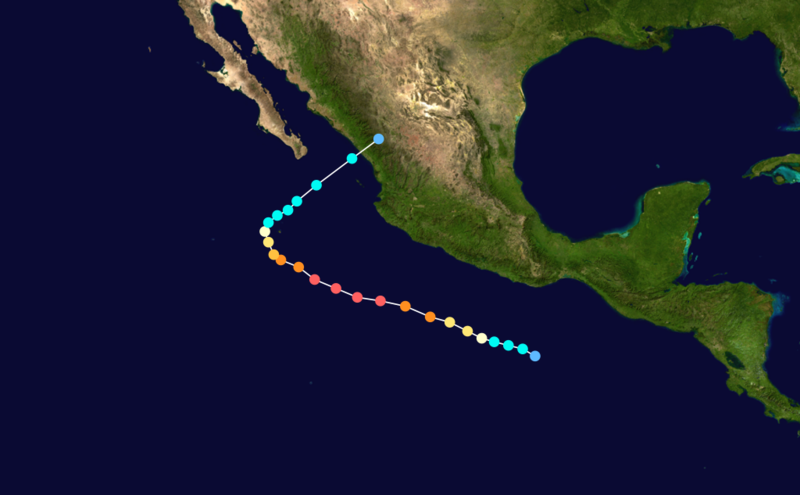 Tropical Storm Rick Track Saffir-Simpson Scale Color Legend | ||||||||
| Tropical Cyclone | Rick | ||||||||
| Cyclogenesis Date | 10/16 | ||||||||
| Cyclolysis Date | 10/21 | ||||||||
| Highest Saffir-Simpson Category | Cat 5 | ||||||||
| Max Wind | 178 mph (155 kt or 287 km/h) | ||||||||
| Min Pressure | 906 mbar | ||||||||
| Accumulated Cyclone Energy (ACE*) Index (kt2) | 24.1650 x 10⁴ | ||||||||
| Landfall Information (date, location and sustained winds) | 10/21 Mazatlan, Mexico(43 kt or 80 km/h) | ||||||||
| Deaths | 4 | ||||||||
| *The (ACE) Index calculations are based on preliminary data. | |||||||||
More information on Rick is available from the NOAA National Hurricane Center.
 Tropical Storm Neki Satellite Image |
 Tropical Storm Neki Track Saffir-Simpson Scale Color Legend | ||||||||
| Tropical Cyclone | Neki | ||||||||
| Cyclogenesis Date | 10/19 | ||||||||
| Cyclolysis Date | 10/26 | ||||||||
| Highest Saffir-Simpson Category | Cat 3 | ||||||||
| Max Wind | 121 mph (105 kt or 194 km/h) | ||||||||
| Min Pressure | 956 mbar | ||||||||
| Accumulated Cyclone Energy (ACE*) Index (kt2) | 12.3556 x 10⁴ | ||||||||
| Landfall Information (date, location and sustained winds) | N/A | ||||||||
| Deaths | 0 | ||||||||
| *The (ACE) Index calculations are based on preliminary data. | |||||||||
Northwest Pacific Basin
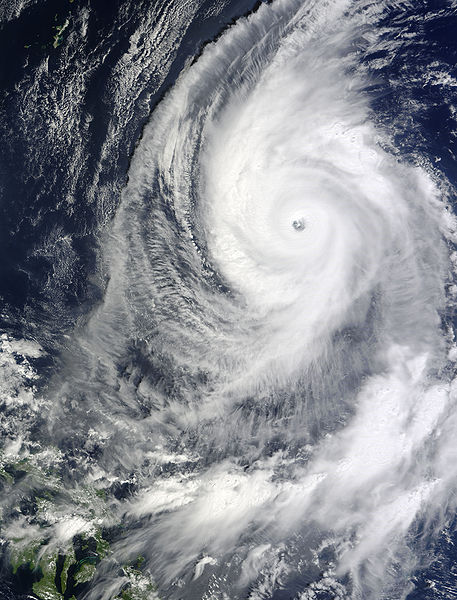
 Tropical Storm Nepartak Satellite Image |
 Tropical Storm Nepartak Track Saffir-Simpson Scale Color Legend | ||||||||
| Tropical Cyclone | Nepartak | ||||||||
| Cyclogenesis Date | 10/10 | ||||||||
| Cyclolysis Date | 10/13 | ||||||||
| Highest Saffir-Simpson Category | TS | ||||||||
| Maximum 6-hr Sustained Wind | 63 mph (55 kt or 102 km/h) | ||||||||
| Min Pressure | N/A | ||||||||
| Accumulated Cyclone Energy (ACE*) Index (kt2) | 2.5100 x 10⁴ | ||||||||
| Landfall Information (date, location and sustained winds) | N/A | ||||||||
| Deaths | N/A | ||||||||
| *The (ACE) Index calculations are based on preliminary data. | |||||||||
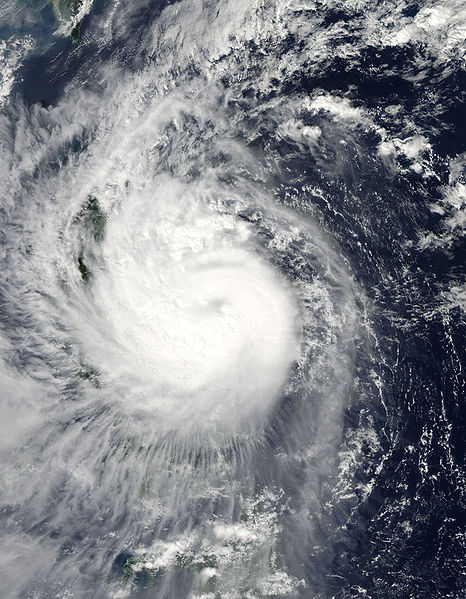
 Tropical Storm Lupit Satellite Image |
 Tropical Storm Lupit Track Saffir-Simpson Scale Color Legend | ||||||||
| Tropical Cyclone | Lupit | ||||||||
| Cyclogenesis Date | 10/14 | ||||||||
| Cyclolysis Date | 10/27 | ||||||||
| Highest Saffir-Simpson Category | Cat 4 | ||||||||
| Max Wind | 155 mph (135 kt or 250 km/h) | ||||||||
| Min Pressure | 930 mbar | ||||||||
| Accumulated Cyclone Energy (ACE*) Index (kt2) | 31.2181 x 10⁴ | ||||||||
| Landfall Information (date, location and sustained winds) | N/A | ||||||||
| Deaths | 0 | ||||||||
| *The (ACE) Index calculations are based on preliminary data. | |||||||||
 Tropical Storm Mirinae Satellite Image |
 Tropical Storm Mirinae Track Saffir-Simpson Scale Color Legend | ||||||||
| Tropical Cyclone | Mirinae | ||||||||
| Cyclogenesis Date | 10/26 | ||||||||
| Cyclolysis Date | 11/02 | ||||||||
| Highest Saffir-Simpson Category | Cat 2 | ||||||||
| Max Wind | 98 mph (85 kt or 157 km/h) | ||||||||
| Min Pressure | 998 mbar | ||||||||
| Accumulated Cyclone Energy (ACE*) Index (kt2) | 11.8050 x 10⁴ | ||||||||
| Landfall Information (date, location and sustained winds) | 10/30 Quezon, Luzon (65 kt or 121 km/h) 11/2 Vietnam (43 kt or 80 km/h) |
||||||||
| Deaths | 16 | ||||||||
| *The (ACE) Index calculations are based on preliminary data. | |||||||||