Atlantic Basin
 Hurricane Bertha Satellite Image (high resolution) |
 Hurricane Bertha Track  Saffir-Simpson Scale Color Legend |
Bertha developed as a tropical wave south of the Cape Verde islands on July 3, strengthening into Tropical Storm Bertha later that day. The storm further strengthened on July 6 and was upgraded to a hurricane early the next day based on satellite and microwave imagery. Bertha rapidly intensified into a Category 3 hurricane with estimated 195 km/hr (105 knots or 120 mph) winds and a well-defined eye later the same day. The hurricane rapidly weakened to a Category 1 storm due to strong wind shear on the afternoon of July 8. The next day Bertha intensified briefly to a Category 2 hurricane, then later weakened. The storm weakened to tropical storm status on July 19 and was classified as extratropical the next day southwest of Iceland. Bertha was the longest-lived pre-August Atlantic tropical cyclone on record. Peak intensity was 193 km/hr (104 knots or 120 mph) with a minimum pressure of 948 mb. More information on Bertha is available from the NOAA National Hurricane Center. | |
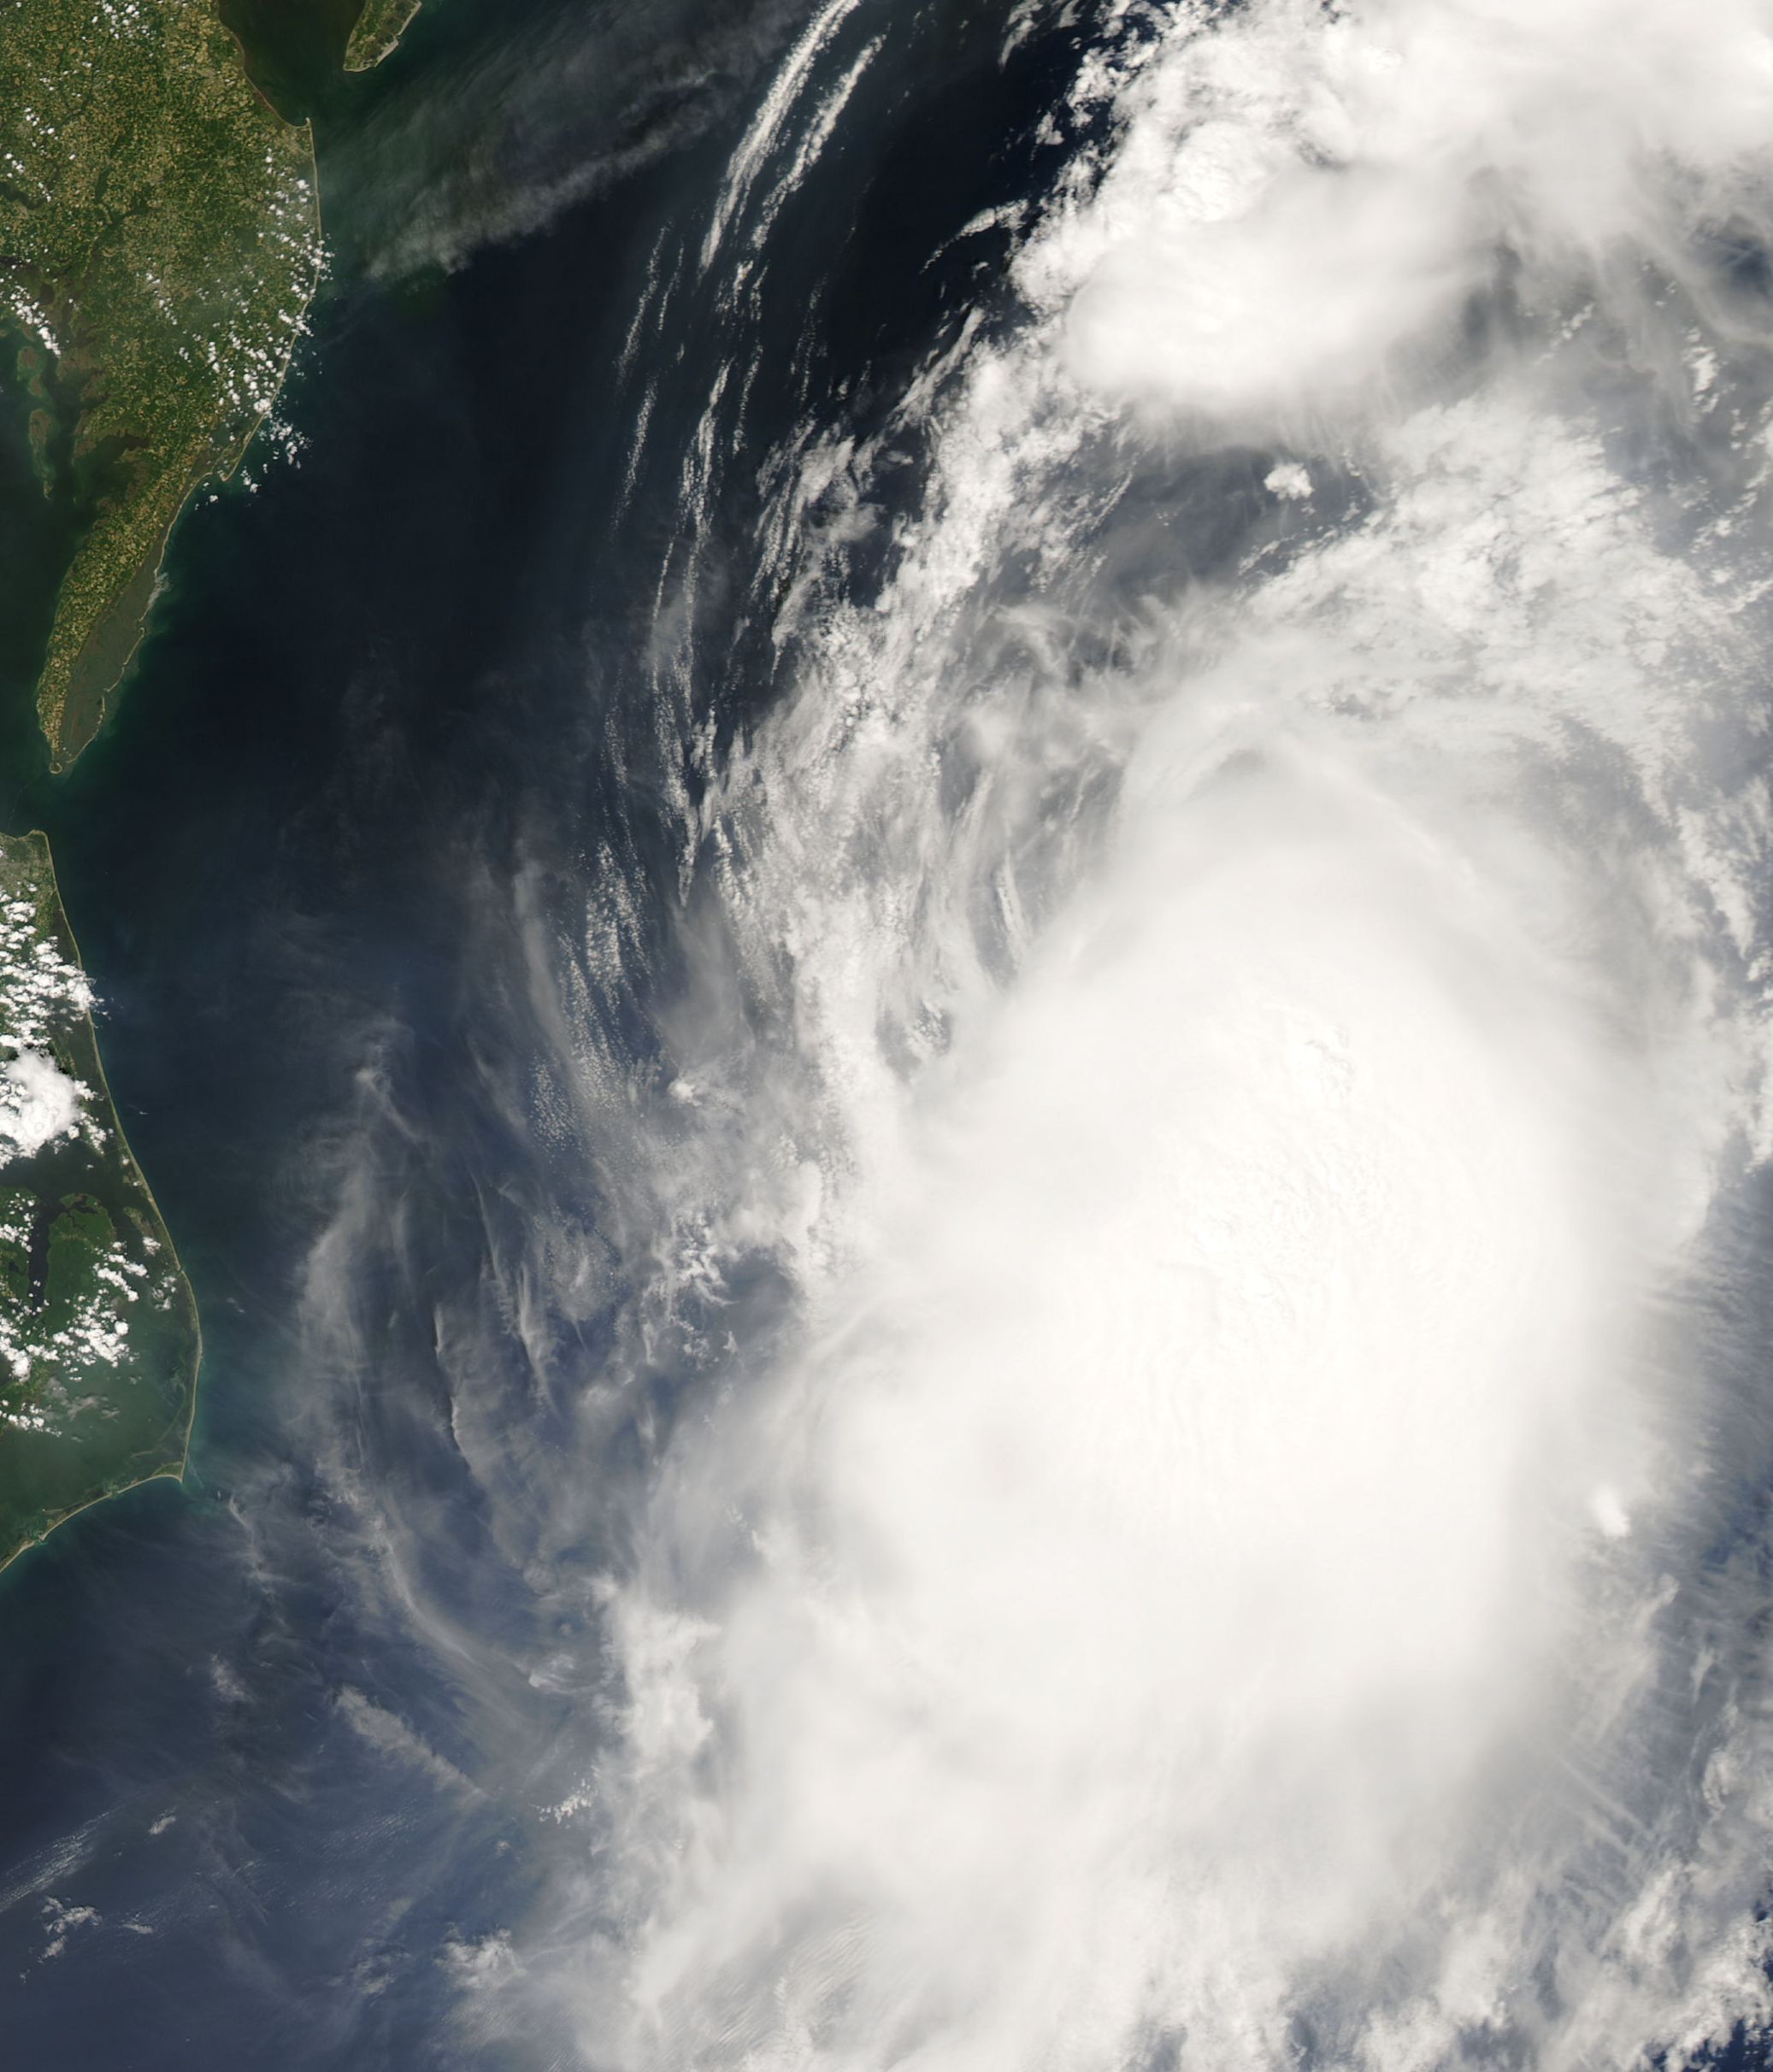
 Tropical Storm Cristobal Satellite Image (high resolution) |
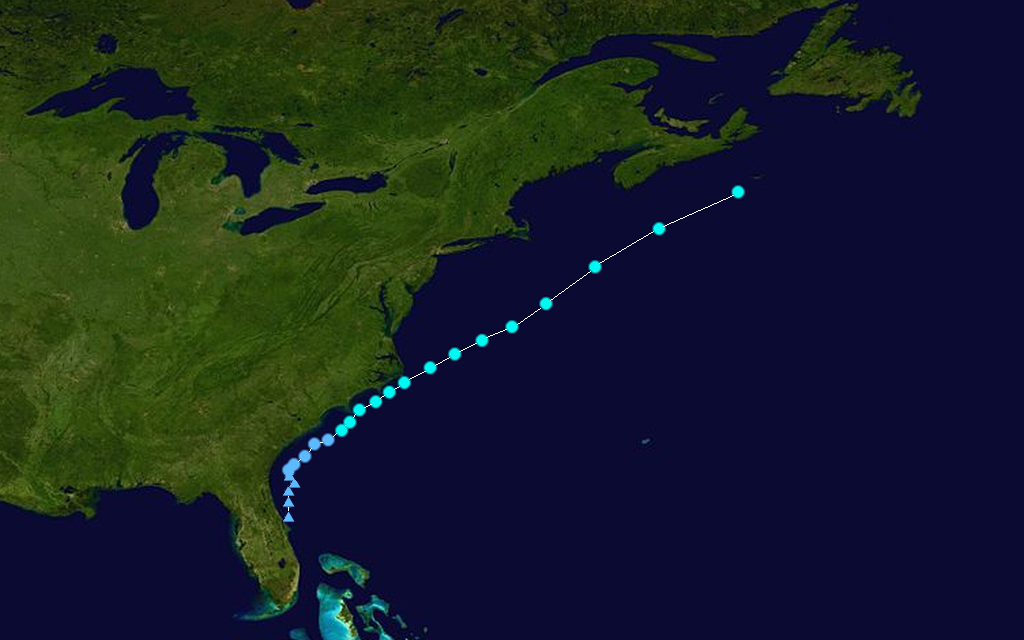 Tropical Storm Cristobal Track Saffir-Simpson Scale Color Legend |
Cristobal formed from a low pressure disturbance that moved northeastward from the Gulf of Mexico across Florida. The system continued to move northeastward near the east coast of the U.S. and became a tropical depression on July 18 about 65 miles south-southeast of Charleston, SC. As the storm slowly moved northeast, it intensified into a tropical storm the next day. Cristobal continued moving northeast away from the U.S. coast and reached its peak intensity of 105 km/hr (56 knots or 65 mph) on July 21 about 700 miles southwest of Halifax, Nova Scotia. The system became extratropical two days later. Cristobal's minimum pressure was 1000 mb. More information on Cristobal is available from the NOAA National Hurricane Center. | |
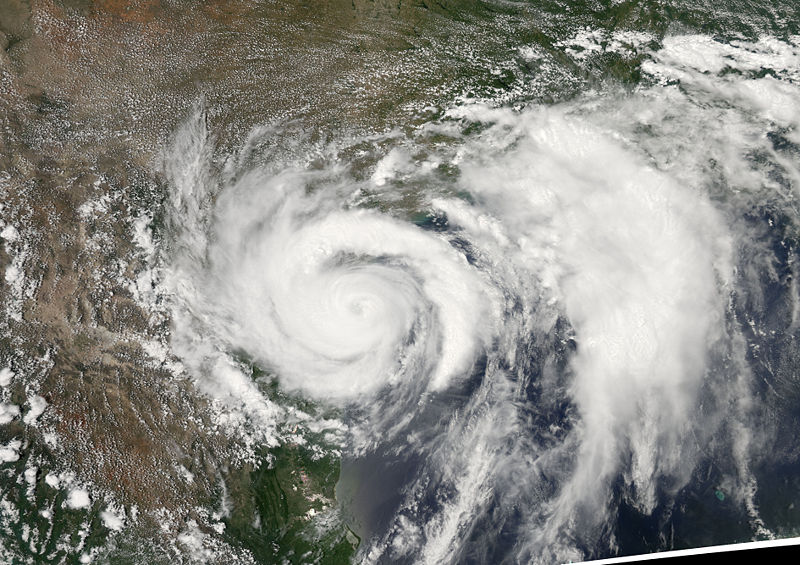 Hurricane Dolly Satellite Image (high resolution) |
 Hurricane Dolly Track Saffir-Simpson Scale Color Legend |
Dolly originated from a tropical wave off the coast of Africa on July 11, 2008. The disturbance strengthened as it moved westward and formed a well-defined circulation on July 20 in the western Caribbean, when it was classified as a tropical storm. The storm made landfall in the Yucatán Peninsula on July 21 with maximum sustained winds near 80 km/hr (49 mph or 43 knots). Dolly moved northwestward, weakened, then reorganized over the Gulf of Mexico on July 21. The storm strengthened into a hurricane on July 22 and reached its peak intensity on July 23 shortly before its eye made landfall on South Padre Island, Texas. After landfall, Dolly steadily weakened and became a tropical depression the next day near the U.S.-Mexico border. Hurricane Dolly's peak intensity was 160 km/hr (86 knots or 100 mph) with a minimum pressure of 964 mb. More information on Dolly is available from the NOAA National Hurricane Center. | |
Pacific Basin
 Hurricane Genevieve Satellite Image |
 Hurricane Genevieve Track Saffir-Simpson Scale Color Legend |
Genevieve began as a tropical wave near Nicaragua on July 17 and moved westward over the following several days. The disturbance evolved into a tropical depression on July 21 250 miles southwest of Acapulco and intensified into a tropical storm later that day. Genevieve became a hurricane on July 25 far offshore of Cabo San Lucas, Mexico, then weakened the next day. The storm weakened into a depression early on July 27 and dissipated later that day. The strongest winds in Hurricane Genevieve were 121 km/hr (65 knots or 75 mph) and its lowest pressure was 987 mb. More information on Tropical Storm Genevieve is available from the NOAA National Hurricane Center. | |
 Hurricane Fausto Satellite Image (high resolution) |
 Hurricane Fausto Track Saffir-Simpson Scale Color Legend |
Fausto developed as a westward-moving tropical wave off the coast of Africa in early July and developed into a tropical depression on July 16 about 560 miles southeast of Acapulco. The system reached tropical storm status later that day and strengthened into a hurricane on July 18. Hurricane Fausto moved northwestward, then west-northwestward where it encountered cool waters which weakened the storm. Fausto rapidly weakened into a remnant low by July 22 and dissipated two days later about 1200 miles west of the southern tip of Baja California. The strongest winds in Hurricane Fausto were 161 km/hr (87 knots or 100 mph) and its lowest pressure was 975 mb. More information on Hurricane Fausto is available from the NOAA National Hurricane Center. | |
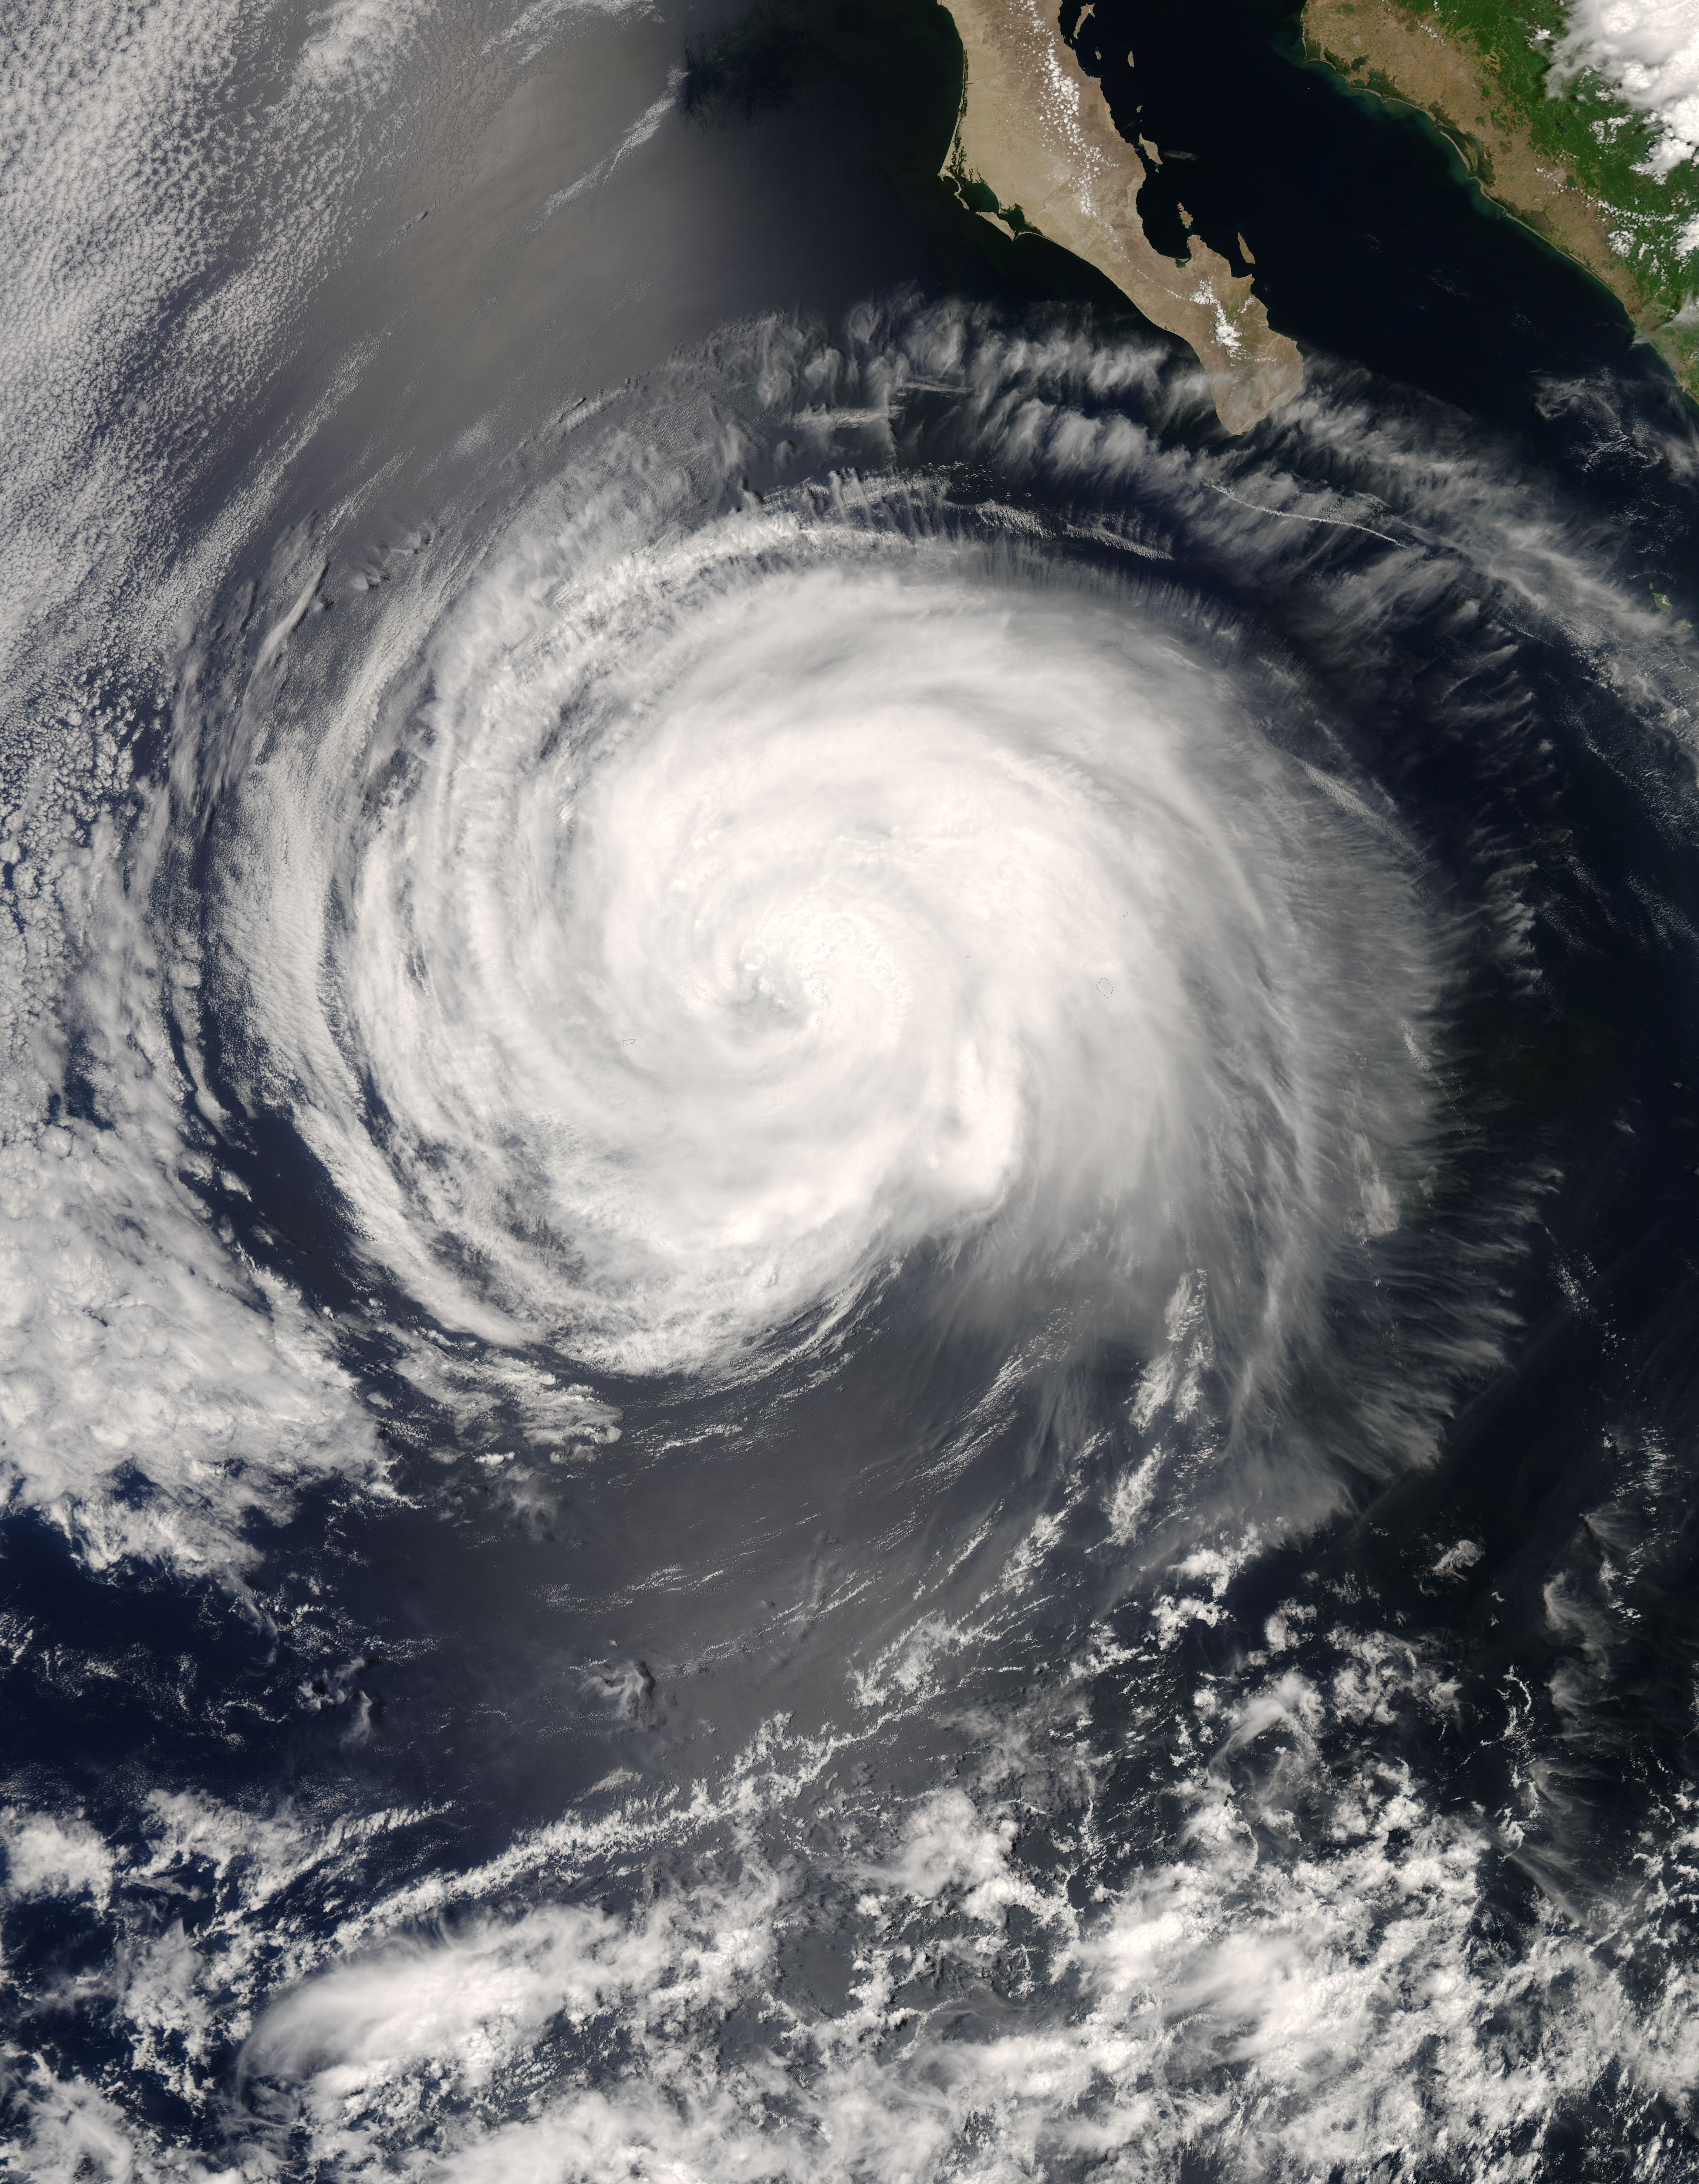
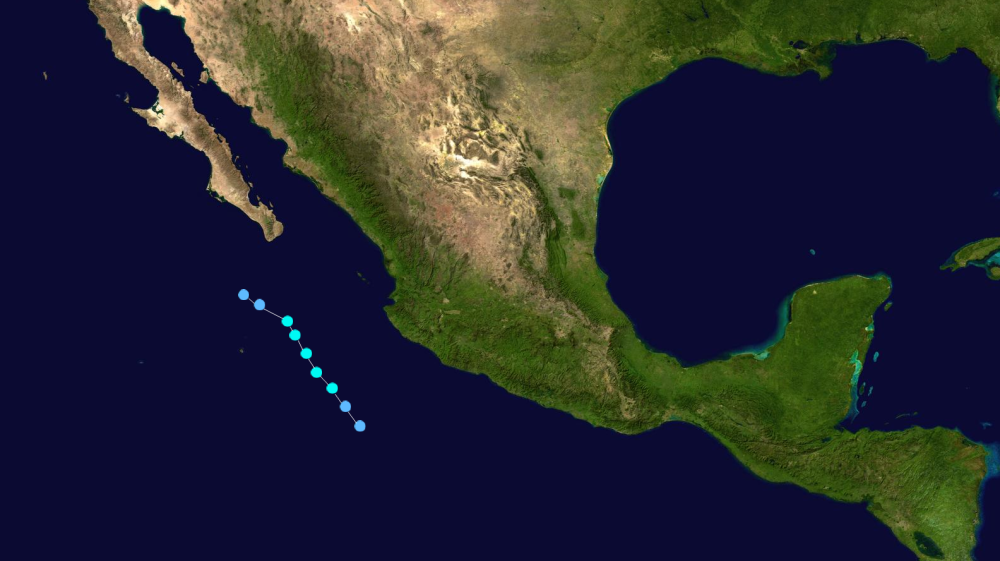
 Hurricane Elida Satellite Image (high resolution) |
 Hurricane Elida Track Saffir-Simpson Scale Color Legend |
Elida began on July 11 as a tropical depression located about 400 miles southeast of Acapulco and strengthened into a tropical storm later the same day. The storm moved west-northwestward for several days and strengthened into a hurricane on July 14. Hurricane Elida strengthened and reached its peak on July 16 before moving over cooler waters. The cool waters weakened the storm's intensity and it was downgraded to a tropical storm on July 18, and a depression the next day. This category 2 storm was ocean-bound and did not affect land. The strongest winds in Hurricane Elida were 169 km/hr (91 knots or 105 mph) and its lowest pressure was 970 mb. More information on Hurricane Elida is available from the NOAA National Hurricane Center. | |
 Tropical Storm Douglas Satellite Image |
 Tropical Storm Douglas Track Saffir-Simpson Scale Color Legend |
Douglas was a short-lived tropical cyclone that formed on July 1 about 280 miles southwest of Manzanillo, Mexico. The storm moved northwestward, paralleling the Mexican coast for several days. Douglas weakened to a remnant low on July 3 after bringing heavy rains to parts of southwest coastal Mexico. The strongest winds in Tropical Storm Douglas were 65 km/hr (35 knots or 40 mph) and its lowest pressure was 1003 mb. More information on Tropical Storm Douglas is available from the NOAA National Hurricane Center. | |