Atlantic Basin
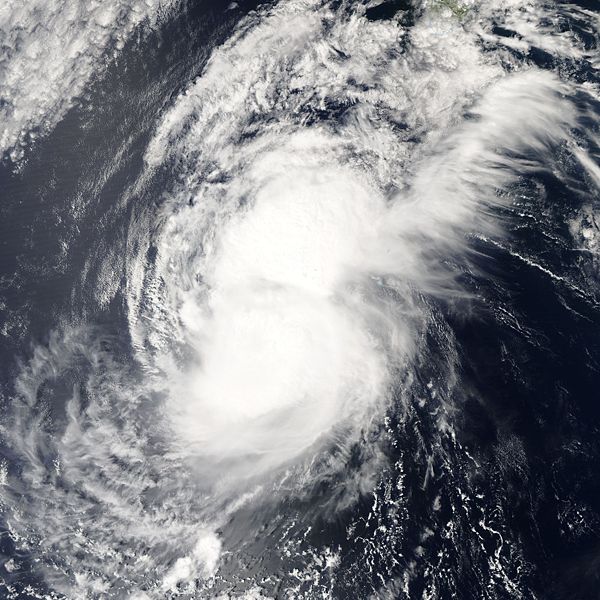
 Hurricane Felix Satellite Image |
 Hurricane Felix Track  Saffir-Simpson Scale Color Legend |
|
On August 31, a westward-moving tropical depression formed east of the Windward Islands. It organized enough to be classified the next day as Tropical Storm Felix, and intensified later that day into a hurricane. Hurricane Felix continued to move westward over very warm waters and intensified into a Category 5 storm by late on September 2. Felix weakened briefly overnight and then strengthened into a Category 5 storm again before it struck northeastern Nicaragua on September 4. The rugged terrain of Central America weakened the storm significantly such that it was downgraded to a tropical depression on September 5. The strongest winds in Hurricane Felix were 270 km/hr (146 knots or 168 mph), and its lowest pressure was 929 mb. More information on Hurricane Felix is available from the NOAA National Hurricane Center. |
|
|
|
|
 Tropical Storm Gabrielle Satellite Image |
 Tropical Storm Gabrielle Track Saffir-Simpson Scale Color Legend |
|
An area of low pressure off the Carolina coast developed into Subtropical Storm Gabrielle on September 7. Reconnaissance aircraft data suggested the presence of a weak warm core on the 8th, prompting a reclassification of Gabrielle as a tropical storm. The system passed over the Outer Banks of North Carolina on the ninth, and weakened to a depression the next day as it moved northeast. The final advisory was issued on September 11. The strongest winds in Tropical Storm Gabrielle were 85 km/hr (46 knots or 53 mph), and its lowest pressure was 1004 mb. More information on Tropical Storm Gabrielle is available from the NOAA National Hurricane Center. |
|
|
|
|
 Hurricane Humberto Satellite Image |
 Hurricane Humberto Track Saffir-Simpson Scale Color Legend |
|
Hurricane Humberto began as an area of disorganized showers and thunderstorms off the coast of western Cuba on September 8. These storms moved slowly west-northwestward across the Gulf of Mexico and organized enough to be classified as Tropical Depression Nine on the morning of September 12. Within a few hours, the tropical depression had strengthened into Tropical Storm Humberto. The system turned northward and continued to intensify until it reached hurricane status early in the morning of September 13. Hurricane Humberto made landfall around 0700 UTC near High Island, Texas as a Category 1 hurricane. The storm rapidly weakened as it traveled northeast over land and dropped heavy amounts of precipitation on Louisiana, Mississippi, Alabama, and parts of Georgia and the Carolinas. Humberto is blamed for the death of a man who was killed by a falling carport in Bridge City, Texas. The strongest winds in Hurricane Humberto were 135 km/hr (73 knots or 85 mph), and its lowest pressure was 986 mb. More information on Hurricane Humberto is available from the NOAA National Hurricane Center. |
|
|
|
|
 Tropical Storm Ingrid Satellite Image |
 Tropical Storm Ingrid Track Saffir-Simpson Scale Color Legend |
|
A tropical wave 1820 km (1130 miles) east of the Lesser Antilles developed into Tropical Depression Eight on September 12 at the same time that the system that later became Humberto developed. Unlike Tropical Depression Nine, this depression developed slowly and did not become Tropical Storm Ingrid until September 14. Ingrid was weakened by strong upper-level winds and reclassified as a depression on September 15. The storm continued to grow increasingly disorganized and the final advisory was issued on September 17. The strongest winds in Tropical Storm Ingrid were 75 km/hr (40 knots or 46 mph), and its lowest pressure was 1004 mb. More information on Tropical Storm Ingrid is available from the NOAA National Hurricane Center. |
|
|
|
|
 Tropical Storm Jerry Satellite Image |
 Tropical Storm Jerry Track Saffir-Simpson Scale Color Legend |
|
In the early morning of September 23, an extratropical area of low pressure was classified as a subtropical depression about 1705 km (1060 miles) west of the Azores. This depression quickly strengthened into Subtropical Storm Jerry later that morning and was reclassified as a tropical storm early on September 24. Tropical Storm Jerry weakened later on the 24th as it moved over cooler waters, then re-intensified back into a tropical storm later that day before being absorbed by a vigorous extratropical cyclone. The strongest winds in Tropical Storm Jerry were 75 km/hr (40 knots or 46 mph), and its lowest pressure was 1000 mb. More information on Tropical Storm Jerry is available from the NOAA National Hurricane Center. |
|
|
|
|
 Hurricane Karen Satellite Image |
 Hurricane Karen Track Saffir-Simpson Scale Color Legend |
|
Karen began as a very large tropical wave off the coast of Africa that slowly organized into a tropical depression on September 25. Later that same day, the storm strengthened into Tropical Storm Karen. The system barely reached hurricane strength before weakening as a result of increased wind shear. The strongest winds in Hurricane Karen were 120 km/hr (65 knots or 75 mph), and its lowest pressure was 988 mb. More information on Hurricane Karen is available from the NOAA National Hurricane Center. Note: The National Hurricane Center later upgraded Karen to hurricane status. Please see the NHC's Tropical Cyclone Report on Hurricane Karen for more information. |
|
|
|
|
 Hurricane Lorenzo Satellite Image |
 Hurricane Lorenzo Track Saffir-Simpson Scale Color Legend |
|
An area of convection that had been moving about the western Caribbean was classified as a tropical depression on the evening of September 25. The system moved slowly south and southwest into the Bay of Campeche and intensified rapidly on the 27th to Tropical Storm Lorenzo. The system reached hurricane status early that evening and made landfall in central Mexico the next morning as a Category 1 hurricane. The strongest winds in Hurricane Lorenzo were 130 km/hr (70 knots or 80 mph), and its lowest pressure was 990 mb. More information on Hurricane Lorenzo is available from the NOAA National Hurricane Center. |
|
|
|
|
 Tropical Storm Melissa Satellite Image |
 Tropical Storm Melissa Track Saffir-Simpson Scale Color Legend |
|
On September 28, an area of low pressure near the Cape Verde islands developed into a tropical depression. This storm strengthened the next morning and became Tropical Storm Melissa. The storm weakened into a tropical depression and then a remnant low on September 30. The strongest winds in Tropical Storm Melissa were 75 km/hr (40 knots or 46 mph), and its lowest pressure was 1003 mb. More information on Tropical Storm Melissa is available from the NOAA National Hurricane Center. |
|
Pacific Basin
 Hurricane Henriette Satellite Image |
 Hurricane Henriette Track Map Saffir-Simpson Scale Color Legend |
| Hurricane Henriette began as a tropical depression about 400 km (250 miles) southeast of Acapulco, Mexico on August 30, and it strengthened into a tropical storm by September 1. Henriette brought heavy rain to the Mexican coast as it traveled northwest, and strengthened to hurricane classification on September 4. Hurricane Henriette first made landfall on the tip of the Baja California peninsula near San José del Cabo on September 4, and quickly passed into the Sea of Cortez. Henriette made landfall for the second time on September 5 near Guaymas, Sonora, Mexico, and was declassified as a tropical depression on September 6. The maximum sustained winds of Hurricane Henriette were 140 km/hr (76 knots or 87 mph), and the minimum pressure was 972 mb. More information may be found on NCDC's 2007 Northeast Pacific Tropical Cyclone statistics page, at the NOAA National Hurricane Center. | |
|
|
|
 Hurricane Ivo Satellite Image |
 Hurricane Ivo Track Map Saffir-Simpson Scale Color Legend |
| Hurricane Ivo formed on September 18 as a tropical depression about 1080 km (670 miles) south-southeast of the southern tip of Baja California. The system was upgraded to a tropical storm later that day and strengthened to a hurricane on September 19. Although Ivo spent its first few days in the open ocean, it moved close enough to land on September 22 for the National Hurricane Center to issue a tropical storm watch for the extreme southern coast of the Baja California Peninsula. Ivo weakened as it curved northeast and then eastward toward the peninsula and the Mexican Government discontinued the tropical storm watch on early in the morning of September 23. The maximum sustained winds of Hurricane Ivo were 130 km/hr (70 knots or 80 mph), and the minimum pressure was 980 mb. More information may be found on NCDC's 2007 Northeast Pacific Tropical Cyclone statistics page, at the NOAA National Hurricane Center. | |
|
|
|
 Tropical Storm Juliette Satellite Image |
 Tropical Storm Juliette Track Map Saffir-Simpson Scale Color Legend |
| Tropical Storm Juliette beggan as a low-pressure system west-southwest of Manzanillo, Mexico and strengthened into a tropical storm, then a hurricane, on September 29. Juliette reached its peak the next day and was weakened by increasing levels of shear until it dissipated late on October 1. The maximum sustained winds of Tropical Storm Juliette were 85 km/hr (46 knots or 50 mph), and the minimum pressure was 1000 mb. More information may be found on NCDC's 2007 Northeast Pacific Tropical Cyclone statistics page, at the NOAA National Hurricane Center. | |