Note: This Synoptic Discussion describes recent weather events and climate anomalies in relation to the phenomena that cause the weather. These phenomena include the jet stream, fronts and low pressure systems that bring precipitation, high pressure systems that bring dry weather, and the mechanisms which control these features — such as El Niño, La Niña, and other oceanic and atmospheric drivers (PNA, NAO, AO, and others). The report may contain more technical language than other components of the State of the Climate series.
Summary
The Earth's ocean-atmosphere system entered into a weak La Niña state during October 2017. The upper-level circulation pattern underwent a couple significant shifts over the contiguous United States (CONUS) at mid-month and a little later in the month, changing from a predominantly trough-West/ridge-East pattern during the first half of the month to a predominantly zonal flow for the middle third of the month, ending with mostly a ridge-West/trough-East pattern for the last third of the month. The temperature anomaly pattern concurrently switched from a cold-West/warm-East pattern during the first half of the month to a cold-South-and-Southeast/warm-West-and-North pattern for the last half of the month. Fronts and low pressure systems brought above-normal precipitation to the Pacific Northwest, central Plains to Great Lakes, and, with help from the remnants of Hurricane Nate and Tropical Storm Philippe, to the Southeast to New England. The weather systems mostly missed much of the rest of the West, far northern and southern Plains, Lower Mississippi Valley, and parts of the coastal Southeast, where it was drier than normal. The precipitation helped shrink drought and abnormal dryness, especially in the Northwest, Midwest, and Northeast, while drought and abnormal dryness expanded where it was dry in the Southwest and Lower Mississippi Valley. The upper-level circulation, temperature, and precipitation anomaly patterns suggested that the atmospheric drivers originating in the Pacific likely had an influence on the month's weather. See below for details.
Synoptic Discussion
 Animation of daily upper-level circulation for the month.
|
 Animation of daily surface fronts and pressure systems for the month.
|
In the Northern Hemisphere, October marks the middle of climatological fall (autumn) which is the time of year when solar heating decreases as the sun angle decreases, and an expanding circumpolar vortex forces the jet stream to migrate southward. Polar air masses influence the weather over the contiguous U.S. (CONUS) more, and the warm, dry subtropical high pressure belts influence the weather less.
 500-mb mean circulation for the CONUS for October 1-16, 2017, showing a long-wave trough in the West and ridge in the East.
|
 500-mb mean circulation for the CONUS for October 17-23, 2017, showing mostly a zonal flow.
|
 500-mb mean circulation for the CONUS for October 23-31, 2017, showing a long-wave ridge in the West and trough in the East.
|
During October 2017, the atmospheric circulation continued in a highly meridional state. A meridional circulation pattern transfers heat from the low latitudes to higher latitudes and transports colder air masses from the poles southward, which helps to balance the distribution of heat across the Earth. But the circulation behaved in an unusual way by "flipping" modes a couple times during the month, changing from a stable long-wave trough-West/ridge-East pattern for the first half of the month to a pattern consisting of a ridge in the West and trough in the East for the last third of the month, with a variable (mostly zonal) pattern in between. Each of these patterns was characterized by specific weather phenomena, temperature anomalies, precipitation anomalies, and impacts.
 500-mb circulation anomalies for the CONUS for October 1-16, 2017.
|
 Temperature anomalies (departure from normal) for the CONUS for October 1-16, 2017.
|
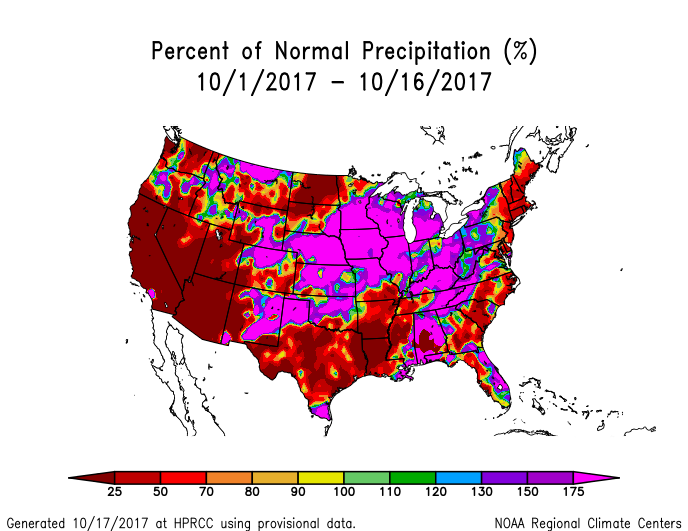 Precipitation anomalies (percent of normal) for the CONUS for October 1-16, 2017.
|
Cold fronts and surface low pressure systems dived into the trough over the West during the first half of the month, frequently stalling out as they moved into the Plains. They picked up Gulf of Mexico moisture after they crossed the Rockies, resulting in above-normal precipitation from the central Plains to Great Lakes. The remnants of Hurricane Nate became entwined along a cold front (that penetrated into the Southeast on October 8th) and moved up the Appalachians, resulting in above-normal precipitation for that region. But much of the West, southern and northern Plains, and East Coast were dry. The colder Pacific and Canadian air that sank over the West beneath the trough kept temperatures colder than normal. In the East, a southerly flow of warm air combined with subsidence beneath the ridge to bring warmer-than-normal temperatures.
 500-mb circulation anomalies for the CONUS for October 17-23, 2017.
|
 Temperature anomalies (departure from normal) for the CONUS for October 17-23, 2017.
|
 Precipitation anomalies (percent of normal) for the CONUS for October 17-23, 2017.
|
Fronts and surface lows moved across the CONUS in a more westerly flow during the middle of the month, but the air masses were not as cold so temperatures were near to above normal for most of the country. The absence of cold air masses was especially noticeable in the northern Plains to Great Lakes, where temperatures were much warmer than normal. Pacific fronts brought above-normal precipitation to the Pacific Northwest, and Gulf of Mexico moisture was drawn along a cold front bringing above-normal precipitation to parts of the South to Midwest, but much of the rest of the country was drier than normal during this period.
 500-mb circulation anomalies for the CONUS for October 23-31, 2017.
|
 Temperature anomalies (departure from normal) for the CONUS for October 25-31, 2017.
|
 Precipitation anomalies (percent of normal) for the CONUS for October 25-31, 2017.
|
When the upper-level circulation pattern shifted to a ridge in the West and trough in the East during the last third of the month, cold Canadian air masses were funneled far to the South, plunging into the Gulf of Mexico and northern Mexico. As a result, below-normal temperatures dominated much of the country east of the Rockies. The storm track frequently brought surface lows across the Great Lakes. The warm southerly flow ahead of the lows kept New England warmer than normal for much of this period. The surface lows and fronts pulled in Atlantic moisture, including the remnants of Tropical Storm Philippe near the end of the month, giving much of the Mid-Atlantic to Northeast wetter-than-normal weather. The ridge in the West kept the weather warmer than normal. With the ridge driving weather systems to the north, most of the western CONUS was drier than normal, and the northwesterly flow aloft kept Gulf of Mexico moisture out of the central CONUS, with drier-than-normal Canadian air masses dominating there.
The regional and meridional characteristics of the atmospheric circulation and temperature and precipitation anomalies become hard to identify at the monthly level because the averaging process masks out the extremes that occurred during the three parts of the month.
- The monthly averaged upper-level circulation consists of a weak trough from central Canada into the central CONUS with positive height anomalies, or ridges, along the West and East Coasts.
- The monthly upper-level circulation anomalies are reflected in the monthly temperature anomalies at the surface. Monthly temperatures were below average in the northwestern fourth of the CONUS, reflecting the dominance of the upper-level trough early in the month and its impact on the monthly averaged circulation anomaly. Monthly temperatures were warmer than normal across the eastern half of the CONUS and especially warm in New England where upper-level ridging and a warm southerly surface flow dominated. In fact, the six New England states (Connecticut, Rhode Island, Massachusetts, Vermont, New Hampshire, and Maine) had the warmest October in the 123-year record.
- When daily temperature records are examined, the extreme warmth was more extreme, persistent, and/or widespread than the extreme cold. When integrated across the month, there were 5,334 record warm daily high (1,517) and low (3,817) temperature records. This was about 2.7 times the 1,966 record cold daily high (1,060) and low (906) temperature records.
- October is in the transition period between summer and fall when heating demand in the northern states increases while cooling demand in the southern states can still be significant. The circulation pattern was highly meridional this month and flipped at mid-month, with cold outbreaks occurring in many parts of the country. However, temperatures were consistently warmer than normal in the high-population centers of the Northeast and Midwest, which reduced heating demand, and averaged cooler than normal mostly in the low-population areas of the West. The aggregate effect was a REDTI (Residential Energy Demand Temperature Index) value for October 2017 which ranked fourth lowest in the 123-year historical record for October.
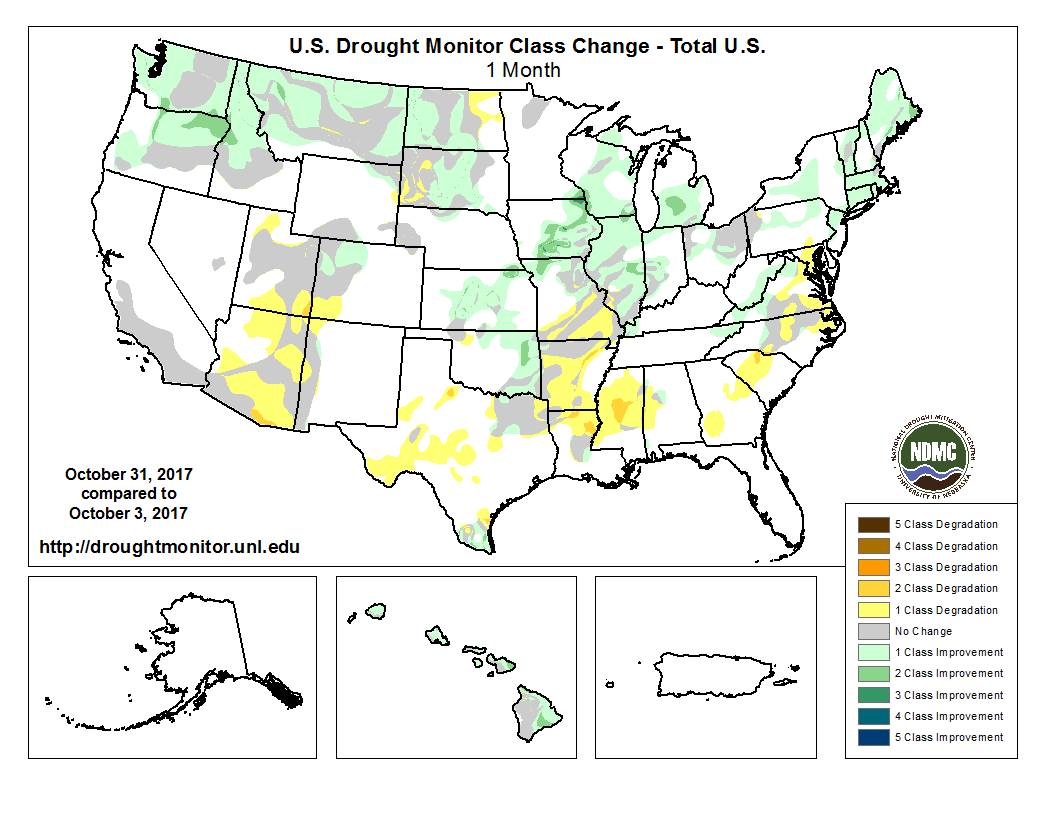
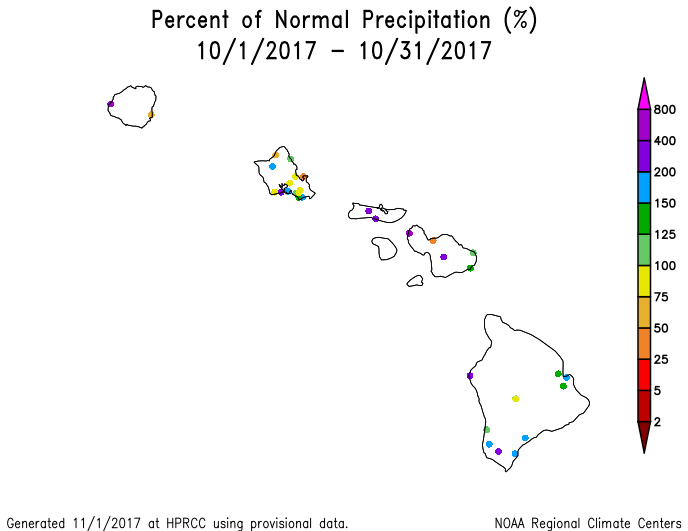
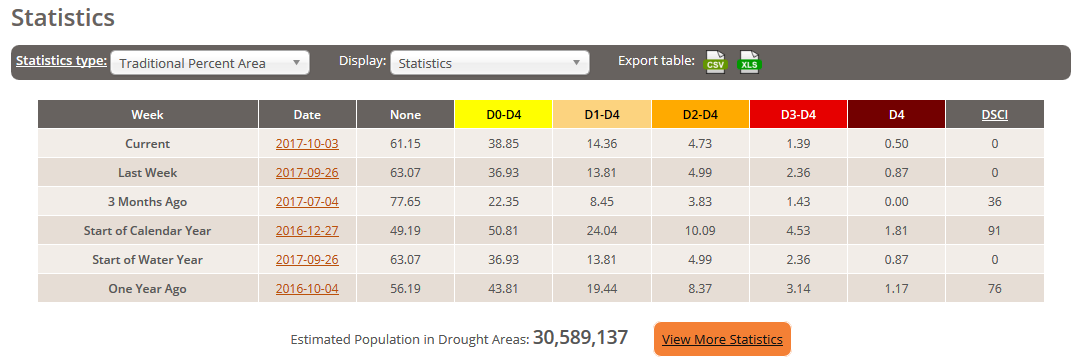
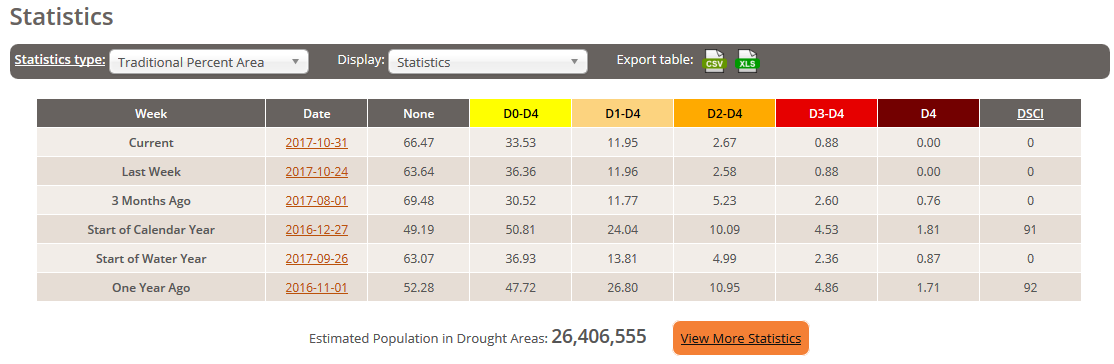
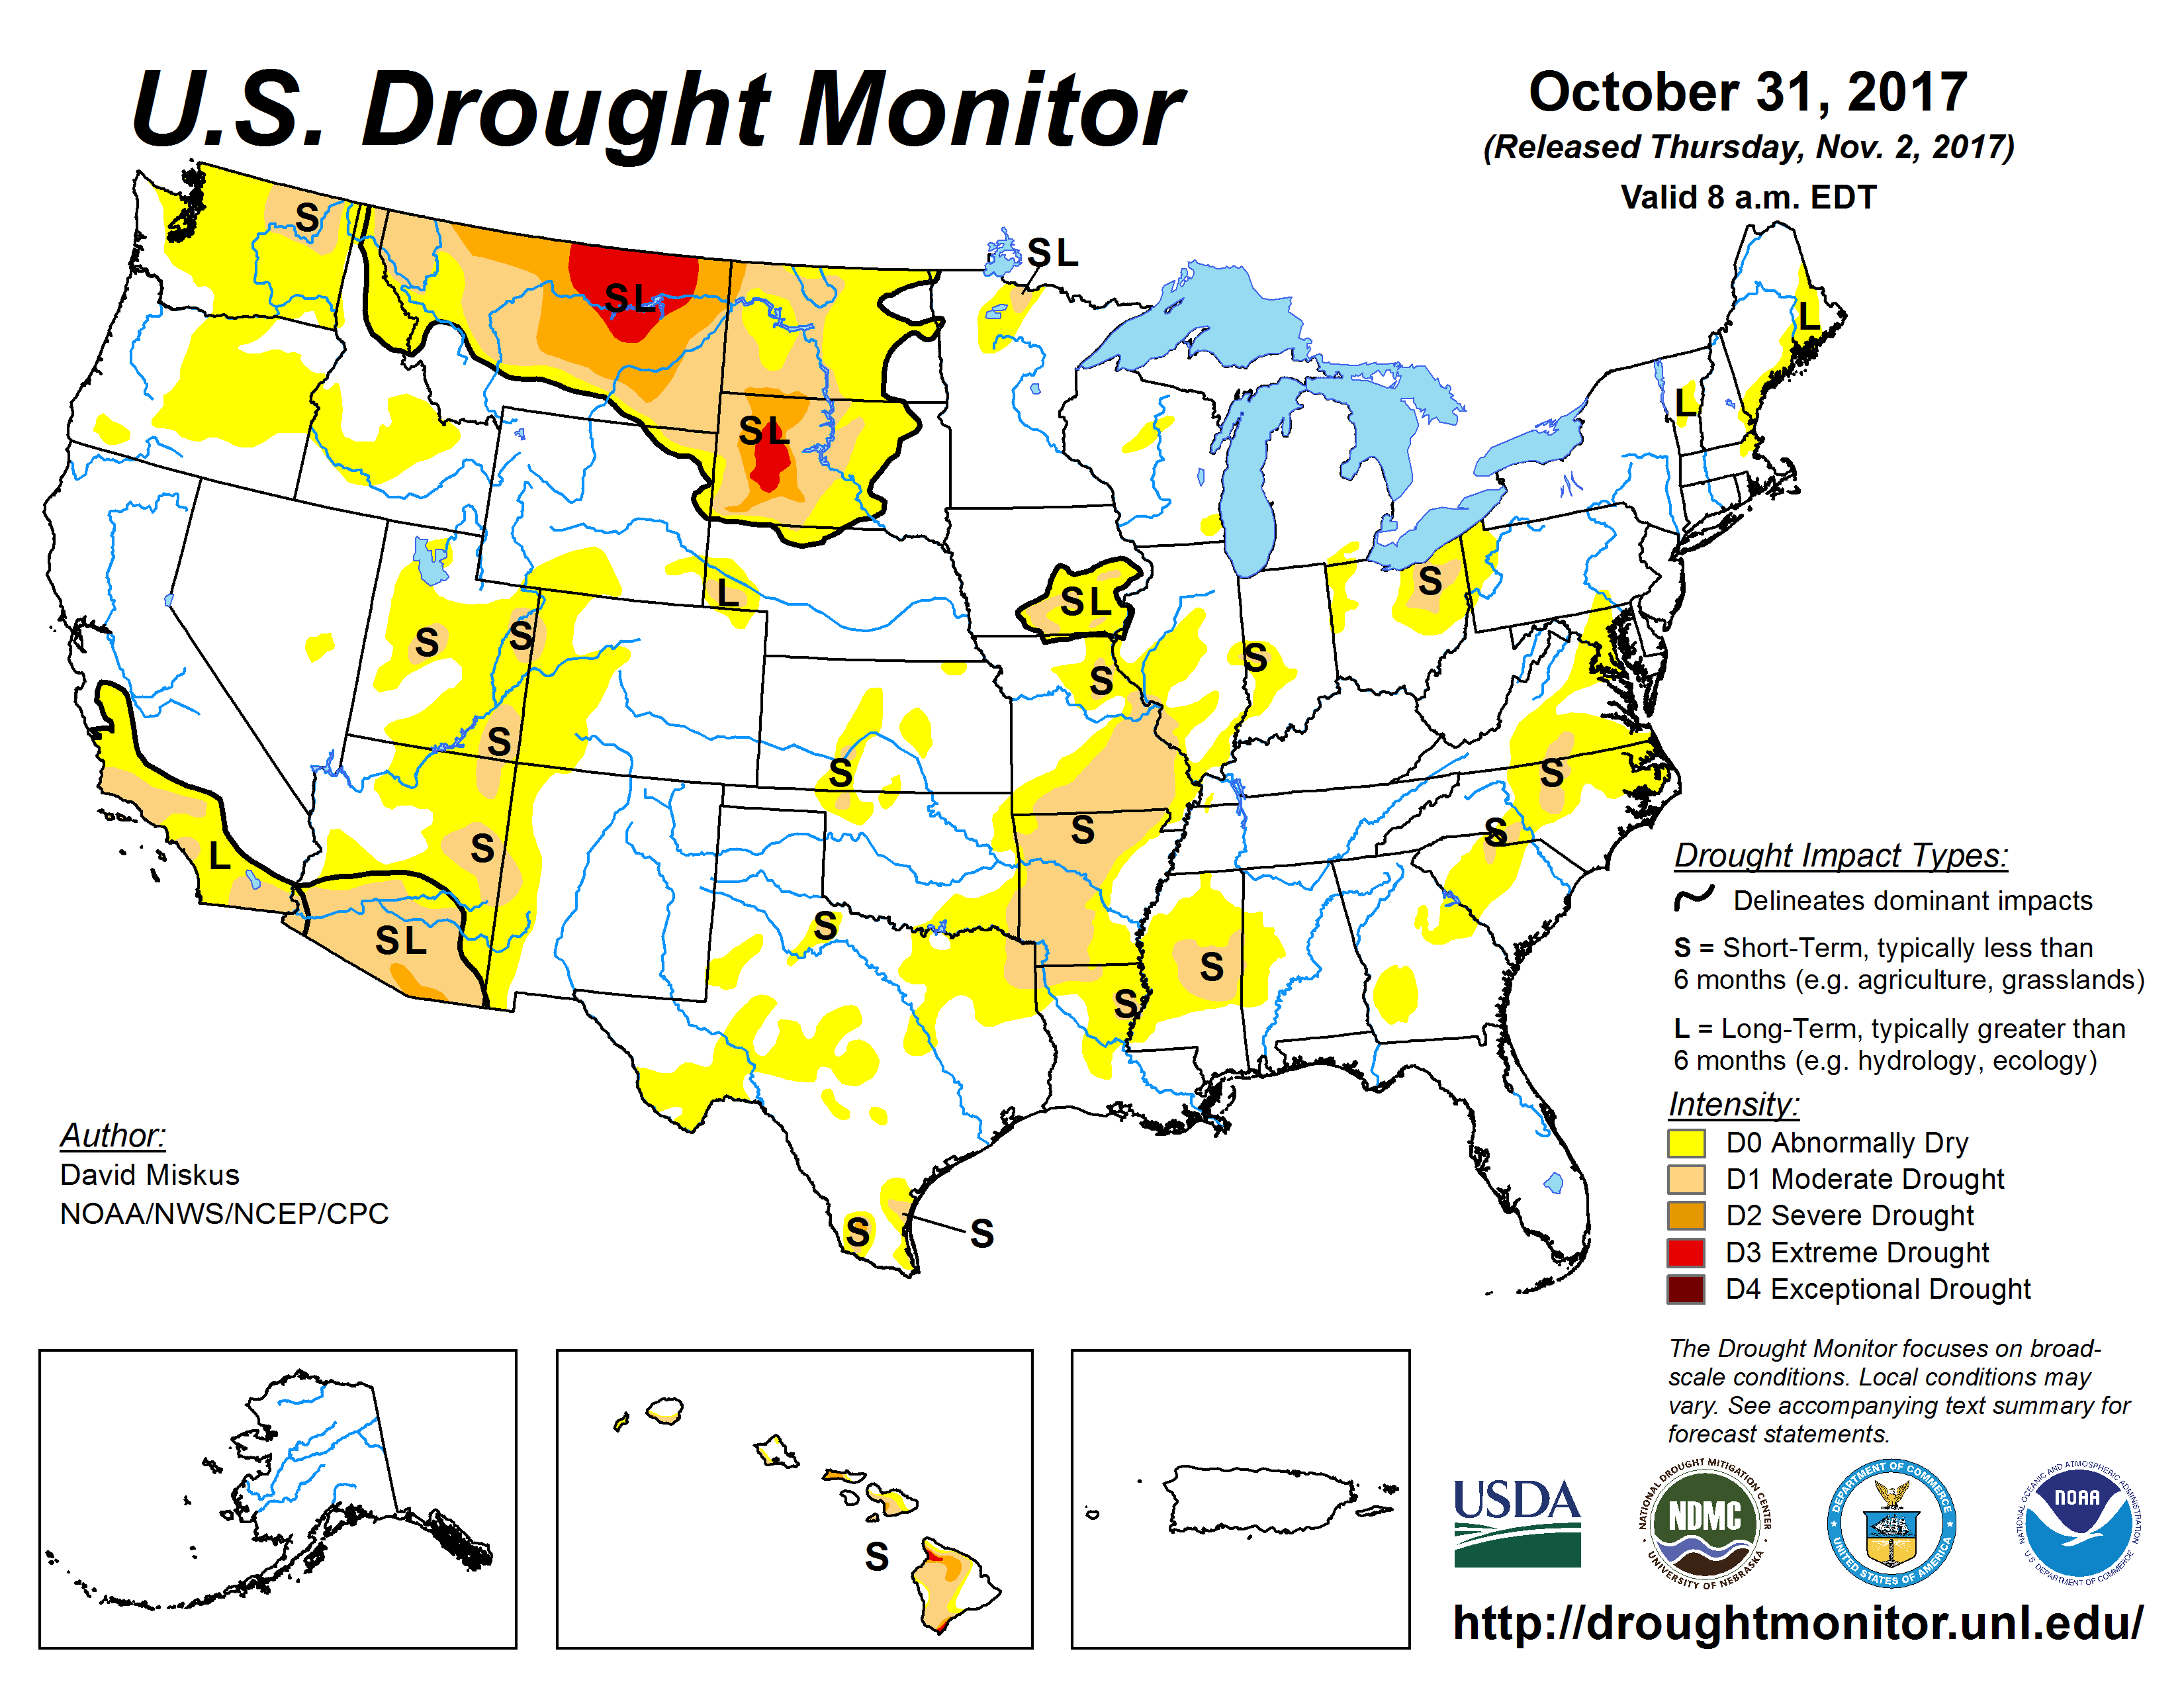
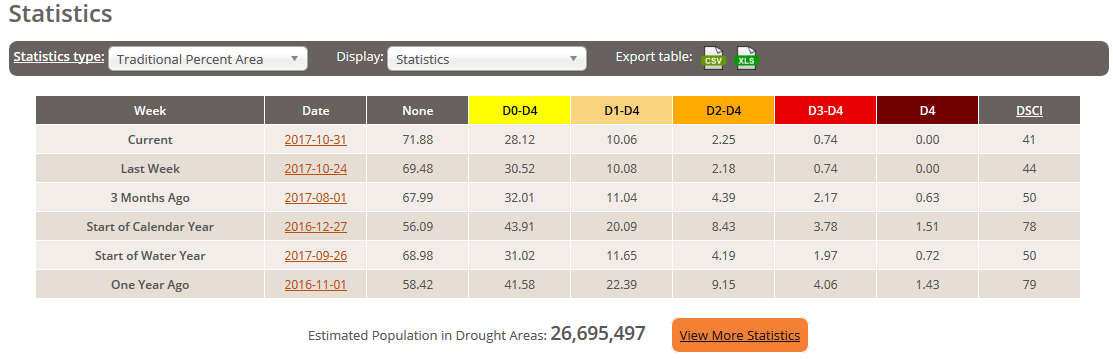
- The monthly precipitation anomaly pattern reflected the precipitation anomaly patterns of the three distinct periods, both on the wet and dry sides. The areas that were wetter than normal for at least one of the periods were wetter than normal for the month, and those areas that missed out on the precipitation for all three periods were quite dry for the month. Notably dry areas included the Southwest, where Arizona and Utah had the fifth driest October in the 1895-2017 record; parts of the northern Plains, where North Dakota ranked eleventh driest; the southern Plains to Lower Mississippi Valley; and parts of the coastal Southeast. Drought and abnormal dryness expanded in the Southwest, the Lower Mississippi Valley, and parts of Texas and the Southeast. With the storm track across the Pacific Northwest, from the central Plains to Great Lakes, and southern Appalachians to Northeast, drought and abnormal dryness contracted in these northern areas. Eight states had a top ten wet October, including Michigan which had the wettest October on record. A wetter-than-normal month in Hawaii helped contract drought there.
- Contraction outweighed expansion, so at the national level drought contracted from 14.4 percent of the CONUS at the end of September to 12.0 percent of the CONUS at the end of October (from 12.1 percent to 10.1 percent for all of the U.S.).
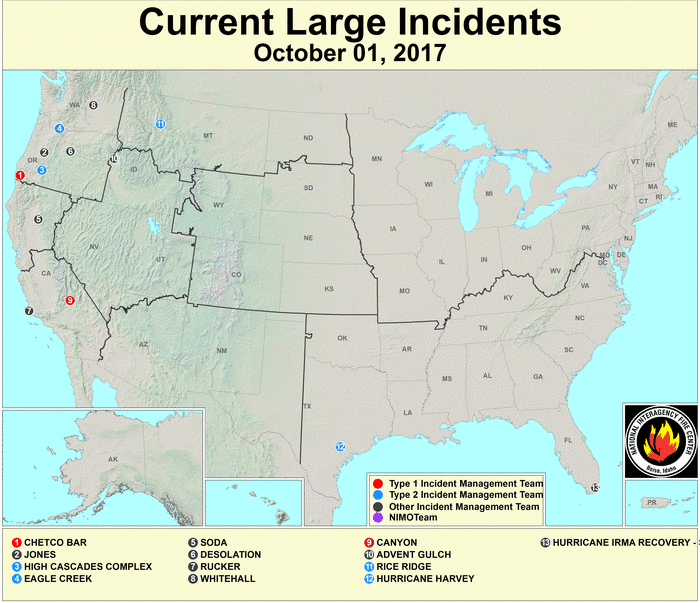
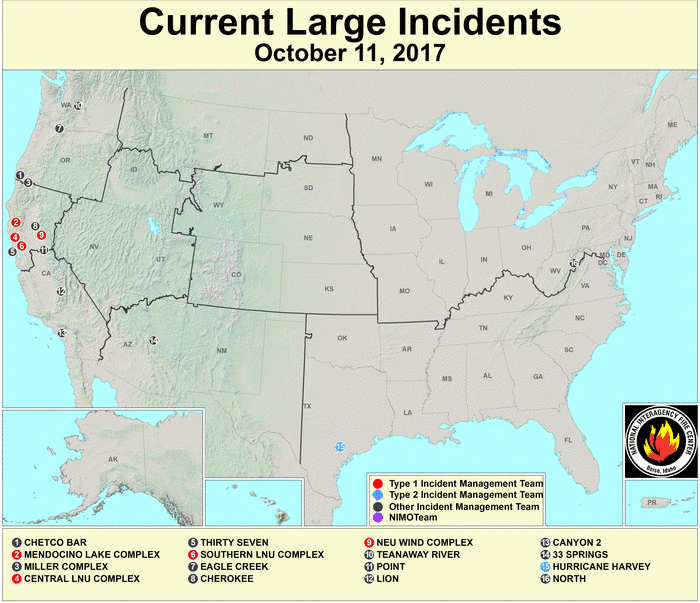
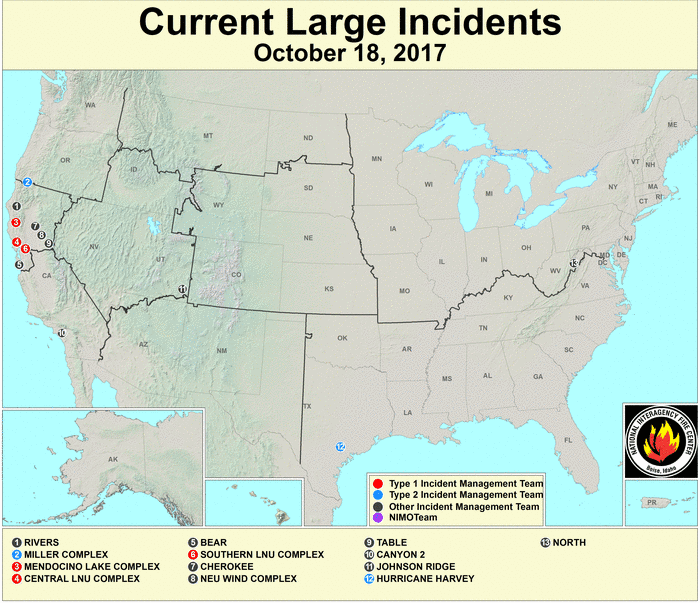
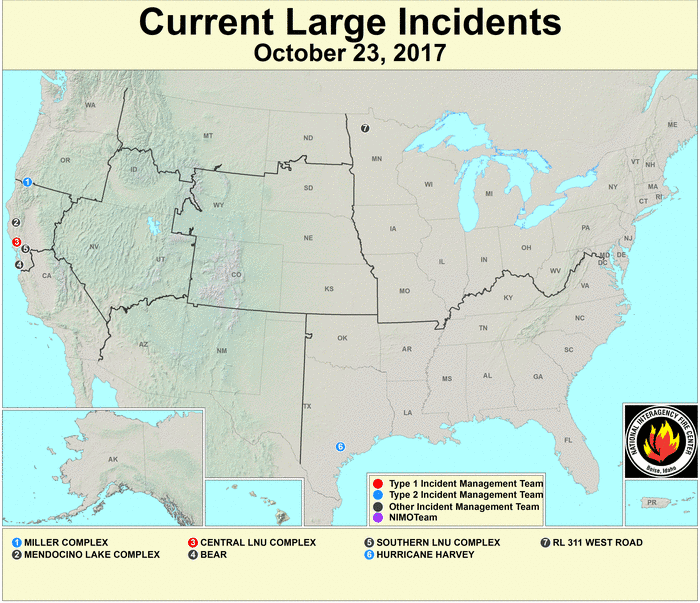
- The month began with several large wildfires burning across the Far West. Rains at mid-month helped extinguish most of the fires in the Pacific Northwest, but dry conditions in the Southwest contributed to expansion of fires in northern California. By the end of the month, only a few large wildfires were burning in California (wildfire maps for October 1, 11, 18, 23, 31).
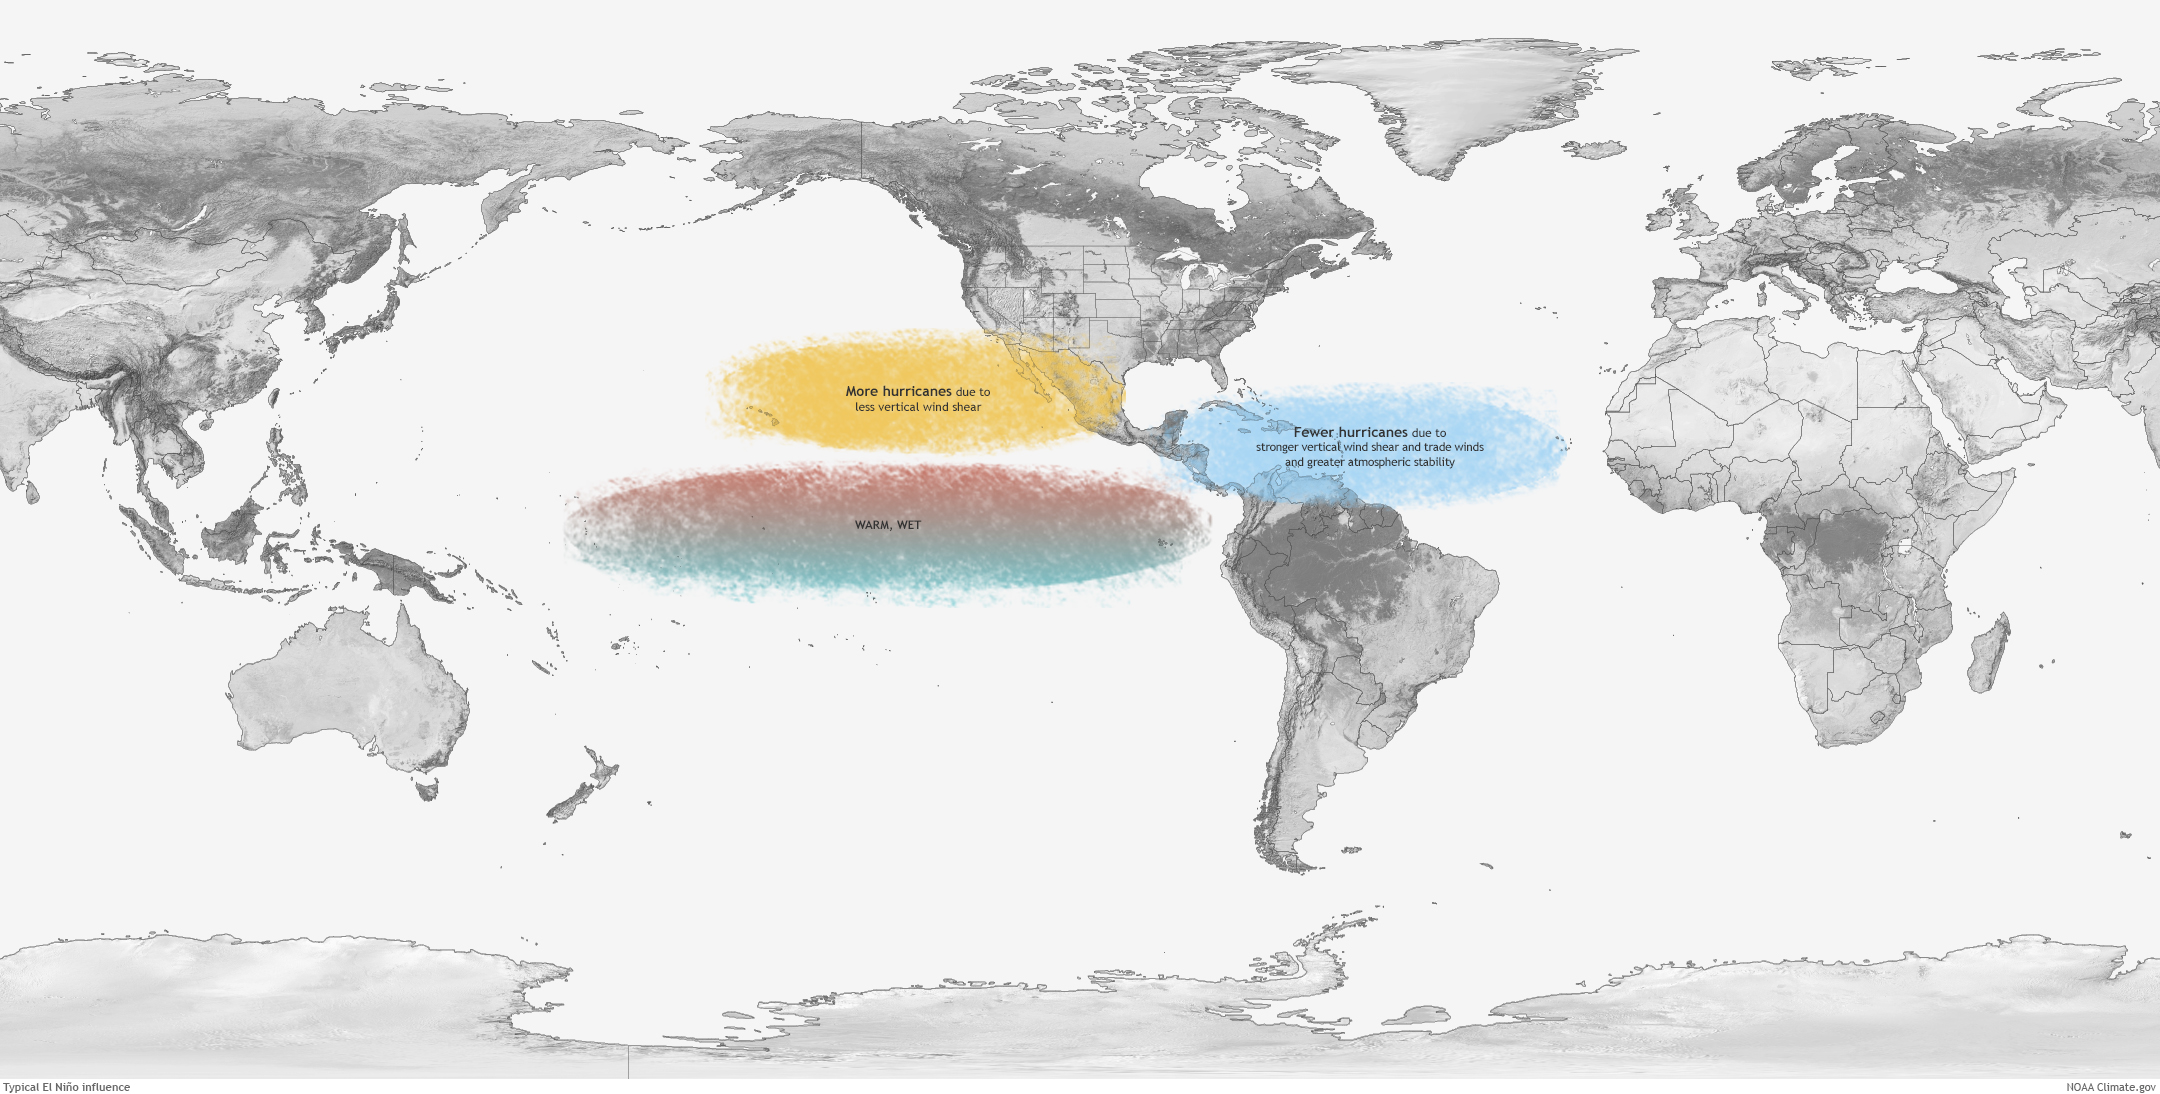
Typically tropical cyclone activity is enhanced in the Eastern North Pacific and inhibited in the North Atlantic during El Niños, and inhibited in the Eastern North Pacific and enhanced in the North Atlantic during La Niñas, due mostly to changes in vertical wind shear during the two extreme events. The relationship is unclear during ENSO-neutral events. The tropical Pacific Ocean entered into a weak La Niña state during October 2017. The Atlantic basin saw more active tropical cyclone activity than average while the East Pacific basin had near to slightly less than average tropical cyclone activity. But this is late in the season for both of these basins.
- The Atlantic hurricane season runs from June 1st through November 30th and three tropical systems (Hurricanes Nate and Ophelia, and Tropical Storm Philippe) were active in the North Atlantic during October. Two of the systems interacted with cold fronts and upper-level troughs over the eastern CONUS. Hurricane Nate formed early in the month in the western Caribbean and brushed Central America and Mexico before entering the Gulf of Mexico and taking aim at the Mississippi coast. After bringing rain to the Southeast, Nate's remnants were swept up in a cold front and rapidly moved to the northeast. Hurricane Ophelia developed at mid-month in the central North Atlantic and eventually made its way to the British Isles where it took aim at Ireland. Tropical Storm Philippe originated in the western Caribbean near the end of the month. It crossed Cuba and the southern tip of Florida before encountering a cold front along the eastern seaboard. Moisture from Philippe's remnants was drawn in to the frontal system and contributed soaking rains which alleviated drought and dryness in the Northeast.
- The Eastern North Pacific hurricane season runs from May 15th through November 30th and three tropical systems (Tropical Storms Ramon and Selma and Tropical Disturbance 91E) were active during October. Both Ramon and Selma formed in the southern portion of the region and were short-lived. Ramon formed early in the month and brushed southern Mexico before dissipating. Selma formed near the end of the month and brought rain to Central America when it came ashore at El Salvador. Tropical Disturbance 91E formed at mid-month well west of Mexico and lasted only a couple days before dissipating. All of these systems were too far south to interact with the circulation over the CONUS.
- No tropical cyclones formed in, or moved into, the Central North Pacific.
- Three named tropical systems (Typhoons Khanun, Lan, and Saola) were active in the western Tropical Pacific near the U.S.-Affiliated Pacific Islands (USAPI) in Micronesia, but (other than rain) none of them had any significant effect on the USAPI. A couple other tropical disturbances briefly appeared within USAPI waters but quickly dissipated before developing further. Khanun developed west of the USAPI and eventually made landfall over Southeast Asia. Lan spent several days in the Philippine Sea, just west of the USAPI, bringing waves and rain to Yap and Palau, before moving north towards Japan. Saola formed over western Micronesia, passing near the Marianas as a tropical storm. Saola intensified into a typhoon over the Philippine Sea before moving north and brushing Japan. Saola's remnants were swept up in the westerlies as an extratropical low, eventually contributing rain to parts of North America.
The Climate Extremes Index (CEI) aggregates temperature and precipitation extremes across space and time. During October 2017, the meridional circulation resulted in some extreme weather, but the flipping of the circulation during the month tended to dampen the effect of the extreme weather on the cumulative CEI. Several regions had top ten or near-top ten CEI components. Only the Northeast region — with its most extreme warm minimum temperature component, fifth most extreme warm maximum temperature component, and 19th most extreme 1-day precipitation component — ranked in the top ten category regionally, having the fifth most extreme October CEI in the 1910-2017 record. Even with the second most extreme 1-day precipitation component, fifth most extreme wet spell component, eighth most extreme days with precipitation component, and tenth most extreme warm minimum temperature component, the East North Central region had only the 16th most extreme October CEI. The Southwest region had the eighth most extreme days without precipitation component, and the Northwest region had the sixth most extreme 1-day precipitation component, but neither of these regions had a regional CEI that was even in the top 30 category. None of the national CEI components ranked in the top ten category, and the October CEI for the nation ranked only 34th most extreme out of 108 years.
 North America monthly upper-level circulation pattern and anomalies. The upper-level circulation pattern during October changed dominant modes several times during the month. During the first half of the month, it mostly consisted of a trough in the West and ridge in the East. During the middle third of the month, it mainly consisted of a more westerly or zonal flow with mostly above-normal height anomalies. During the last third of the month, it mainly consisted of a trough along the Mississippi Valley and ridges along the West Coast and from New England to the Canadian Maritime Provinces. When these contrasting patterns are averaged over the month, the pattern consists of a weak trough from central Canada into the central CONUS with positive height anomalies, or ridges, along the West and East Coasts. Of the circulation indices usually discussed on this page, the teleconnections for the PNA and EP-NP come closest to the October 2017 500-mb circulation anomalies over the CONUS. |
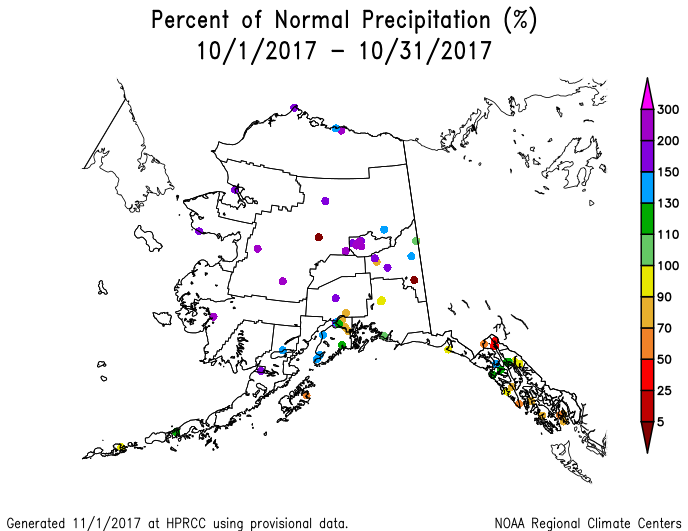
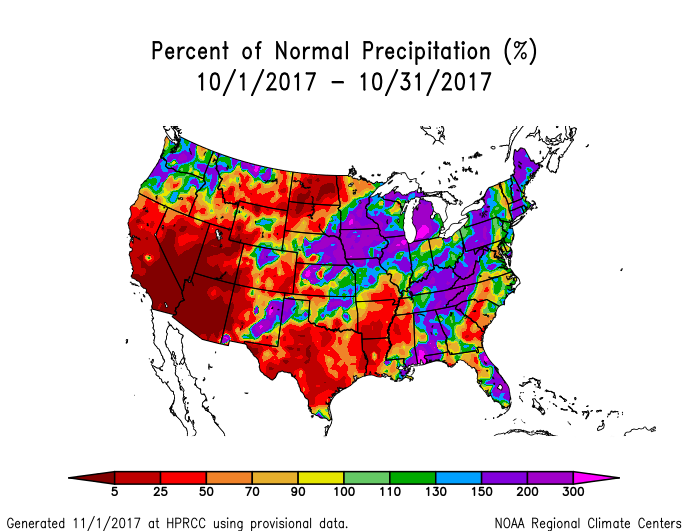 Map of monthly precipitation anomalies. The October precipitation anomaly pattern was driven largely by the precipitation along fronts and upper-level troughs. During the first half of the month, precipitation fell from the central Plains to Great Lakes, in the central Gulf of Mexico coast, and along the Appalachians. During the second half of the month, precipitation was above normal in the Pacific Northwest and in the eastern third of the CONUS. When the two halves of the month are combined, these areas were wetter than normal, while much of the Southwest, southern and northern Plains, Lower Mississippi Valley, and parts of the coastal Southeast were drier than normal. The month was wetter than normal across most of Alaska and Hawaii. |
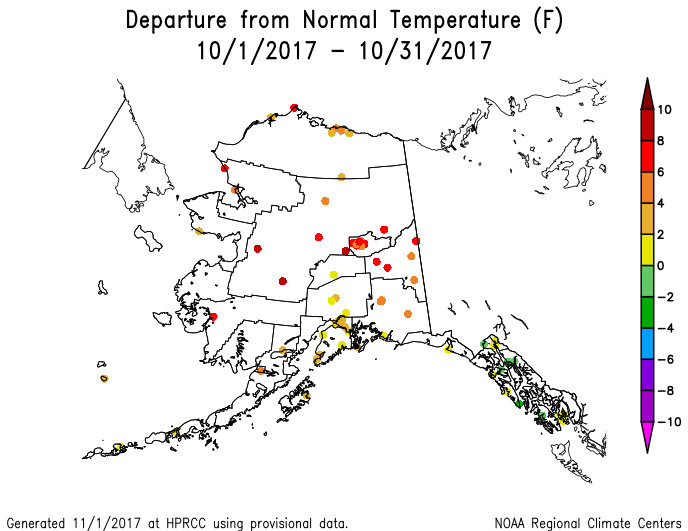
 Map of monthly temperature anomalies. The monthly temperature anomaly map represents a mixture of two dichotomous patterns. During the first half of the month, temperatures were much warmer than normal across the eastern half of the CONUS, beneath the predominant upper-level ridge, and much below normal across the West, beneath the predominant upper-level trough. The pattern shifted at mid-month, with troughs funneling cold fronts into the eastern CONUS which brought below-normal temperatures to the South, while above-normal temperatures dominated in the western and northern states. When averaged together, the monthly temperature anomaly pattern across the CONUS consisted of below-normal temperatures dominating in the Pacific Northwest to central Rockies and across parts of the southern Plains, with above-normal temperatures prevalent east of the Mississippi, especially in the Northeast, and in parts of the Southwest. Alaska was mostly warmer than normal for the month. |
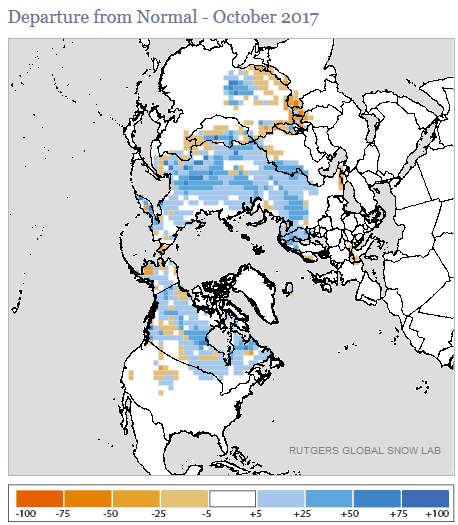
 Northern Hemisphere monthly upper-level circulation pattern and anomalies. Global Linkages: The upper-level (500-mb) circulation anomaly pattern over North America was part of a complex long-wave pattern that stretched across the Northern Hemisphere. East-west trough/ridge pairs (or couplets) and anomaly couplets could be found in the monthly maps, especially over Eurasia, North America, the North Atlantic, and the North Pacific; and North Atlantic/Western Europe, North Atlantic/North America, and North Pacific/North America. There were also significant differences in the upper-level circulation anomaly patterns at shorter time scales (first half of the month, middle third, and last third). The above-normal 500-mb heights were associated with upper-level ridging at the mid-latitudes; below-normal precipitation (over western Europe and northwest Siberia); above-normal surface temperatures over eastern North America, western Europe, and northwest Siberia; and warm SST anomalies in the North Atlantic and parts of the North Pacific. The areas of below-normal 500-mb heights were associated with upper-level troughing; near- to below-normal surface temperatures over central Canada and much of Russia; cool SST anomalies in parts of the western North Pacific; above-normal precipitation over central Canada, eastern Europe, western Russia, and eastern Siberia; and above-normal snow cover over much of Canada and Russia. Large parts of Asia and North America were near to cooler than normal. But with large parts of the continents still having warmer-than-normal temperatures, and large portions of the Atlantic and Pacific Oceans having warmer-than-normal sea surface temperatures, the October 2017 global temperature was still above normal. |
Atmospheric Drivers
Subtropical highs, and fronts and low pressure systems moving in the mid-latitude storm track flow, are influenced by the broadscale atmospheric circulation. The circulation of the atmosphere can be analyzed and categorized into specific patterns. The Tropics, especially the equatorial Pacific Ocean, provides abundant heat energy which largely drives the world's atmospheric and oceanic circulation. The following describes several of these modes or patterns of the atmospheric circulation, their drivers, the temperature and precipitation patterns (or teleconnections) associated with them, and their index values this month:
-
El Niño Southern Oscillation (ENSO)
- Description: Oceanic and atmospheric conditions in the tropical Pacific Ocean can influence weather across the globe. ENSO is characterized by two extreme modes: El Niño (warmer-than-normal sea surface temperature [SST] anomalies in the tropical Pacific) and La Niña (cooler-than-normal SST anomalies), with the absence of either of these modes termed "ENSO-neutral" conditions.
- Status: Weak La Niña conditions were present during October 2017 with near to below-average SSTs across most of the central and eastern equatorial Pacific Ocean.
- Teleconnections (influence on weather): To the extent teleconnections are known, the typical temperature and precipitation patterns associated with La Niña during October include above-normal temperatures from the central Plains to the Great Lakes; below-normal precipitation from eastern Texas to the Lower Mississippi Valley, from the Mid-Mississippi Valley to Great Lakes, Great Basin to central Rockies, Nebraska and South Dakota, and parts of the Southeast and Northeast; and above-normal precipitation along the Pacific Northwest coast and Mid-Atlantic coast.
- Comparison to Observed: The October 2017 temperature anomaly pattern matches the teleconnections for La Niña from the central Plains to Great Lakes (where there are warm teleconnections). The October 2017 precipitation anomaly pattern matches the teleconnections for La Niña in the West, Texas to Lower Mississippi Valley, and South Dakota, but not the Midwest and East.
-
Madden-Julian Oscillation (MJO)
- Description: The MJO is a tropical disturbance or "wave" that propagates eastward around the global tropics with a cycle on the order of 30-60 days. It is characterized by regions of enhanced and suppressed tropical rainfall. One of its indices is a phase diagram which illustrates the phase (1-8) and amplitude of the MJO on a daily basis. The MJO is categorized into eight "phases" depending on the pattern of the location and intensity of the regions of enhanced and suppressed tropical rainfall. The MJO can enter periods of little or no activity, when it becomes neutral or incoherent and has little influence on the weather. Overall, the MJO tends to be most active during ENSO-neutral years, and is often absent during moderate-to-strong El Niño and La Niña episodes.
- Status: The MJO Wheeler-Hendon index began the month inside the unit circle (i.e., was an incoherent signal), then moved strongly through phases 5, 6, and 7 before ending the month weakly in phase 8. Other aspects of the tropical ocean-atmosphere system (referred to in the CPC reports as the background or low frequency state, Kelvin and Rossby waves, and tropical cyclone activity) appeared to play a role in influencing the month's climate (especially Rossby waves) (MJO updates for October 9, 16, 23, and 30).
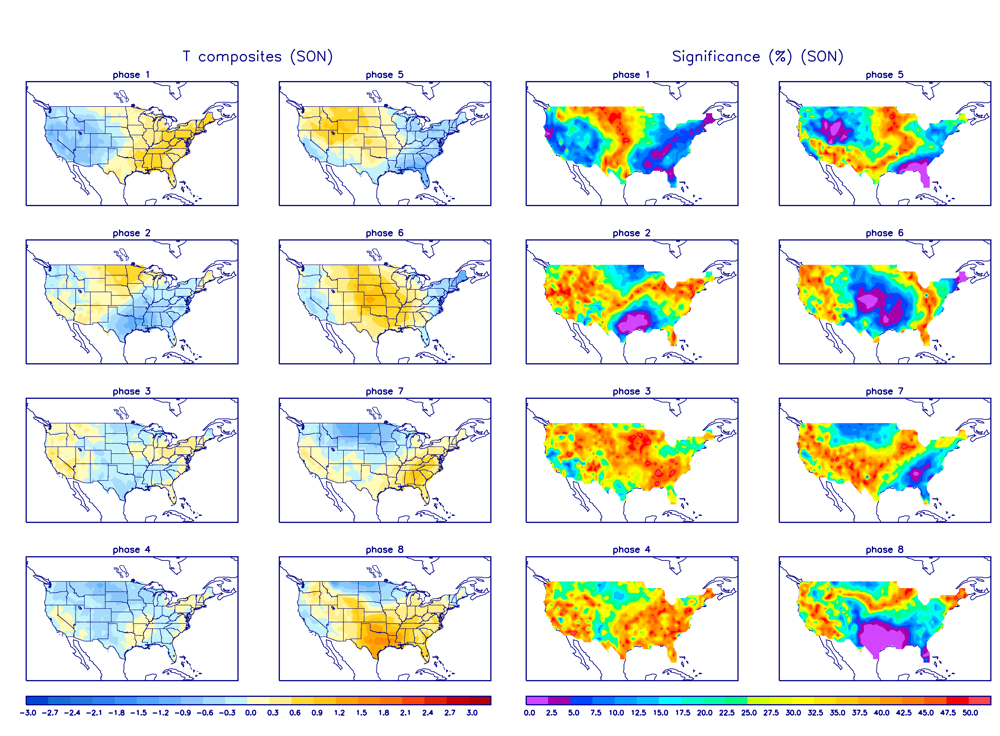
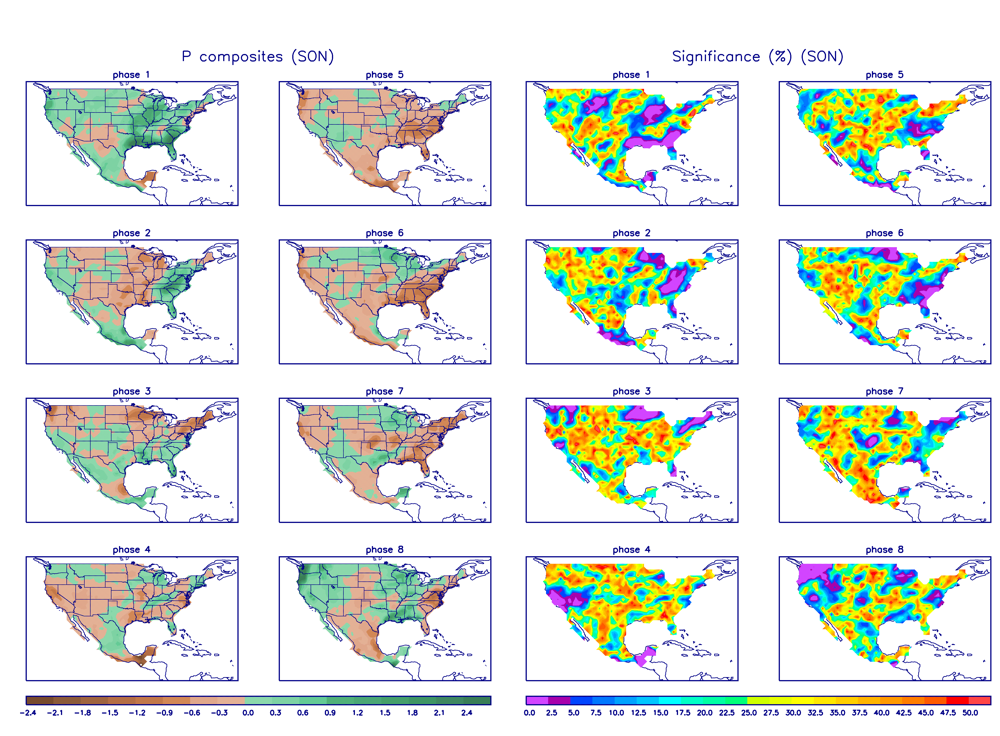
- Teleconnections (influence on weather): The MJO's temperature and precipitation teleconnections to U.S. weather depend on time of year and MJO phase. To the extent teleconnections are known, the October (September-November) teleconnections for temperature are shown here and for precipitation are shown here.
- Comparison to Observed: The MJO is transitory and can change phases (modes) within a month, so it is usually more closely related to weekly weather patterns than monthly. In the case of October 2017, the monthly temperature anomaly pattern bears little resemblance to the temperature teleconnection pattern for phases 5-7, although the third week of the month, when the MJO was in phases 5-6, has some similarities, especially the warmth from the Plains to Great Lakes. Likewise, the monthly precipitation anomaly pattern has little similarity, but the precipitation anomaly pattern for the third week of the month shows some similarity to the precipitation teleconnection pattern for phases 5-6, especially the dryness in the East.
- The Pacific/North American (PNA) pattern
- Description: The PNA teleconnection pattern is associated with strong fluctuations in the strength and location of the East Asian jet stream. PNA-related blocking of the jet stream flow in the Pacific can affect weather downstream over North America, especially the West and especially in the winter half of the year.
- Status: The daily PNA index was negative for the first half of the month and positive the second have, averaging weakly negative for the month as a whole. The 3-month-averaged index was slightly negative.
- Teleconnections (influence on weather): To the extent teleconnections are known, a negative PNA for this time of year (October on the quarterly teleconnection maps) is associated with below-normal temperatures across Alaska, the West Coast, and western Canada; above-normal temperatures across the southern Plains and Southeast; below-normal upper-level circulation anomalies over western North America; above-normal upper-level circulation anomalies from Texas to the East Coast; and above-normal precipitation in the Midwest (although the precipitation teleconnections are weak).
- Comparison to Observed: The October 2017 temperature, precipitation, and upper-level circulation anomaly patterns are a good match with the teleconnections for a negative PNA. However, when the month is divided in two according to the daily PNA index, the upper-level circulation anomaly patterns (first half of month, second half of month) and temperature anomaly patterns (first half of month, second half of month) are an even better match.
- The Arctic Oscillation (AO) pattern
- Description: The AO teleconnection pattern relates upper-level circulation over the Arctic to circulation features over the Northern Hemisphere mid-latitudes and is most active during the cold season.
- Status: The daily AO index was positive for the first half of the month and near zero the last half, averaging positive for the month. The 3-month-averaged index was positive.
- Teleconnections (influence on weather): To the extent teleconnections are known, a positive AO in October (September-November in the AO Composites table) is typically associated with dry conditions in the southern Plains to Lower Mississippi Valley, Northern California, and northern Plains to Northeast; wet conditions in western Washington state, eastern North Carolina, and the Florida peninsula; above-normal temperatures in the northern Plains; near-normal temperatures elsewhere across the CONUS; below-normal upper-level circulation anomalies over the Arctic Ocean extending into the North Atlantic; and above-normal upper-level circulation anomalies spanning both the North Pacific and North Atlantic Oceans and over eastern North America.
- Comparison to Observed: For the CONUS, the October 2017 monthly upper-level circulation anomaly pattern shows some agreement with the teleconnections for a positive AO over North America and the North Pacific, but not over the Arctic and North Atlantic Oceans. The monthly temperature anomaly pattern is a reasonable match in the Northern Plains, but not elsewhere; however, the temperature anomaly pattern for October 17-23 is a very good match. The precipitation anomaly pattern matches except in the Great Lakes and Northeast.
- The North Atlantic Oscillation (NAO) pattern
- Description: The NAO teleconnection pattern relates upper-level circulation over the North Atlantic Ocean to circulation features over the Northern Hemisphere mid-latitudes.
- Status: The daily NAO index was slightly positive during the first half of the month, slightly negative during the last half of the month, and averaged slightly positive for the month. The 3-month-averaged index was slightly negative.
- Teleconnections (influence on weather): To the extent teleconnections are known, a positive NAO during this time of year (October on the quarterly teleconnection maps) is associated with above-normal upper-level circulation anomalies over the eastern CONUS, extending across the North Atlantic to Western Europe; below-normal circulation anomalies over northern Canada to Greenland; and wetter-than-normal precipitation anomalies in the Ohio Valley, but the precipitation teleconnections are weak. There are no temperature teleconnections in the CONUS.
- Comparison to Observed: The October 2017 precipitation and upper-level circulation anomaly patterns match the teleconnections for a positive NAO over the CONUS, but the teleconnections are weak and the match may be a coincidence.
- The West Pacific (WP) pattern
- Description: The WP teleconnection pattern is a primary mode of low-frequency variability over the North Pacific and reflects zonal and meridional variations in the location and intensity of the (East Asian) jet stream in the western Pacific.
- Status: The monthly WP index was positive, but the three-month average WP index was negative.
- Teleconnections (influence on weather): To the extent teleconnections are known, a positive WP during this time of year (October on the quarterly teleconnection maps) is typically associated with above-normal temperatures from Alaska, across Canada, to the central Plains and Great Lakes; above-normal circulation anomalies over the north central CONUS to central Canada; below-normal circulation anomalies over the eastern North Pacific; above-normal circulation anomalies over the western North Pacific; below-normal circulation anomalies over eastern Siberia; and below-normal precipitation in the Pacific Northwest, western to south central Canada, the Great Lakes, and the Southeast.
- Comparison to Observed: The October 2017 monthly temperature anomaly pattern agrees with the teleconnections for a positive WP over Alaska, but not the rest of North America. The precipitation anomaly pattern is opposite the teleconnections across North America. The upper-level circulation anomaly pattern agrees over eastern Siberia the western North Pacific, but is opposite the teleconnections over North America and the eastern North Pacific.
- The East Pacific-North Pacific (EP-NP) pattern
- Description: The EP-NP teleconnection pattern relates SST and upper-level circulation patterns (geopotential height anomalies) over the eastern and northern Pacific to temperature, precipitation, and circulation anomalies downstream over North America. Its influence during the winter is not as strong as during the other three seasons.
- Status: North Pacific SSTs mostly continued cooling during October. They were still warmer than normal across most of the North Pacific, but the geographical occurrence of the changes tended to make the cooler anomalies less cool and the warmer anomalies less warm. A large band of cooler-than-normal SSTs extended across the equatorial Pacific from South America to the International Date Line (basically most of the ENSO regions). The North Atlantic High (Bermuda High) and North Pacific High were evident on the average sea level pressure (SLP) field map. The SLP anomaly field indicated that the North Pacific High was stronger than normal for this time of year and the North Atlantic High was stronger in the western North Atlantic (off the North American coast) and in the eastern North Atlantic (along the European coast and over western Europe). The maps also suggested that the North Pacific's Aleutian Low was weaker than normal and shifted to the north, and the North Atlantic's Icelandic Low was stronger than normal. The October 2017 monthly EP-NP index was negative, as was the 3-month running mean.
- Teleconnections (influence on weather): To the extent teleconnections are known, a negative EP-NP index this time of year (October on the quarterly teleconnection maps) is typically associated with warmer-than-normal temperatures across the CONUS from the Great Plains to East Coast (except the Southeast) and across central to eastern Canada; below-normal temperatures over Alaska; below-normal upper-level circulation anomalies (weaker upper-level ridge) over Alaska and western Canada; and above-normal upper-level circulation anomalies across central to eastern North America (weaker upper-level trough) and over the central North Pacific. The precipitation teleconnections are weak but suggest wetter-than-normal conditions over the Pacific Northwest.
- Comparison to Observed: The October 2017 upper-level circulation anomaly pattern is similar to the teleconnections for a negative EP-NP over eastern North America, but not over western North America. The agreement is a little better over western North America during the first half of the month. The temperature anomaly pattern agrees over the CONUS, but is opposite over Alaska. The precipitation anomaly pattern has some agreement where the few teleconnections exist (over the Pacific Northwest).
Examination of the available circulation indices and their teleconnection patterns, and comparison to observed October 2017 monthly temperature, precipitation, and circulation anomaly patterns, suggest that it was difficult to trace the weather over the CONUS in October to one specific atmospheric driver. Rather, the weather was influenced by most if not all of the drivers to some degree. The PNA had the best match for temperature, precipitation, and upper-level circulation, both on a monthly basis and especially when the month was broken down into halves matching specific circulation regimes. The monthly upper-level circulation anomaly pattern was best explained by a combination of the EP-NP and PNA teleconnections. The AO and NAO upper-level circulation teleconnections have some agreement over the CONUS, but that may be a coincidence since there is little agreement in other parts of the world. The PNA teleconnections best explained the temperature anomaly patterns for the first and second halves of the month, although the MJO teleconnections matched the mid-month pattern. The temperature anomaly pattern over the CONUS, for the month as a whole, was best explained by the EP-NP teleconnections, while the WP teleconnections were the only ones that were remotely close to the observed anomaly pattern in Alaska. The temperature teleconnections for AO and La Niña also matched the observed anomaly patterns where teleconnections exist, but the AO similarity may have been a coincidence. No teleconnection pattern perfectly matched the observed precipitation anomaly pattern, but there seemed to be elements of several, including La Niña, MJO, PNA, AO, NAO, and EP-NP.
This month illustrates several things. First, it illustrates how the weather and climate anomaly patterns are influenced by atmospheric drivers (or modes of atmospheric variability) originating in the Pacific Ocean. Second, it demonstrates how the anomaly patterns can result from a combination of many drivers. Third, it shows the importance of selecting an appropriate time scale to examine and how signals can be masked when averaging over a monthly time scale.