Note: This Synoptic Discussion describes recent weather events and climate anomalies in relation to the phenomena that cause the weather. These phenomena include the jet stream, fronts and low pressure systems that bring precipitation, high pressure systems that bring dry weather, and the mechanisms which control these features — such as El Niño, La Niña, and other oceanic and atmospheric drivers (PNA, NAO, AO, and others). The report may contain more technical language than other components of the State of the Climate series.
Summary
The atmosphere was in an ENSO-neutral state during August 2016. The weather over the contiguous United States (CONUS) this month was dominated by a complex interplay between subtropical high pressure systems, jet stream weather systems, and tropical cyclone rainfall. Troughs in the jet stream flow funneled cold fronts into the western and central U.S., giving the Rockies to Great Plains region a colder-than-normal month, while the Bermuda High and North Pacific High kept the West Coast and the U.S. east of the Mississippi warmer than normal. Much of the West was drier than normal due to the North Pacific High and a northwesterly jet stream flow, with the dry weather being a factor in the development of numerous large wildfires across the West. The Bermuda High kept the Southeast to Mid-Atlantic Coast drier than normal, but rain from slow-moving cold fronts and tropical systems made for a wetter-than-normal month from the Southern Plains to Great Lakes. The fronts and upper-level troughs provided the dynamics that triggered severe weather, resulting in an above-average number of tornadoes for the month. Drought expanded in some areas and contracted in others, with the overall national drought footprint shrinking to about 19.5 percent of the CONUS. The upper-level circulation and temperature anomaly patterns suggested the atmospheric drivers originating in the North Atlantic and North Pacific had the greatest influence on the month's weather. See below for details.
Synoptic Discussion
 Animation of daily upper-level circulation for the month.
|
 Animation of daily surface fronts and pressure systems for the month.
|
In the Northern Hemisphere, August marks the end of climatological summer which is the time of year when solar heating forces the jet stream and circumpolar vortex to contract northward. Polar air masses can still influence the weather over the CONUS, but they are not as cold as in the winter months. The warm, dry subtropical high pressure belt normally dominates the weather as it shifts northward, with warm southerly air masses moving into the CONUS more frequently.
This was mostly the case during August 2016. The North Atlantic High (also known as the Bermuda High) and a stronger-than-normal North Pacific High dominated the weather along the West and East coasts of the CONUS, resulting in a warmer- and drier-than-normal month in those regions. Upper-level troughs in the jet stream flow frequently intensified ("deepened") as they moved across the West, dipping further south in the Great Plains and dragging cold fronts behind them, resulting in below-normal temperatures in these regions. Downstream upper-level ridging aided the Bermuda High in keeping temperatures warmer than normal east of the Mississippi River, with eight states in the Northeast having a record-warm August.
The fronts would stall out as the troughs bumped into the North Atlantic High. The southerly flow along the eastern edge of upper-level troughs and frequency of cold fronts stalling out along the Mississippi to Ohio Valleys, combined with the passage of tropical systems from the Gulf of Mexico, resulted in enhanced Gulf of Mexico moisture across the eastern half of the CONUS. This moisture was wrung out of the atmosphere by these fronts, troughs, and tropical cyclones, resulting in above-normal August precipitation from the Southern Plains to Great Lakes, and the second wettest August, nationwide, in the 1895-2016 record.
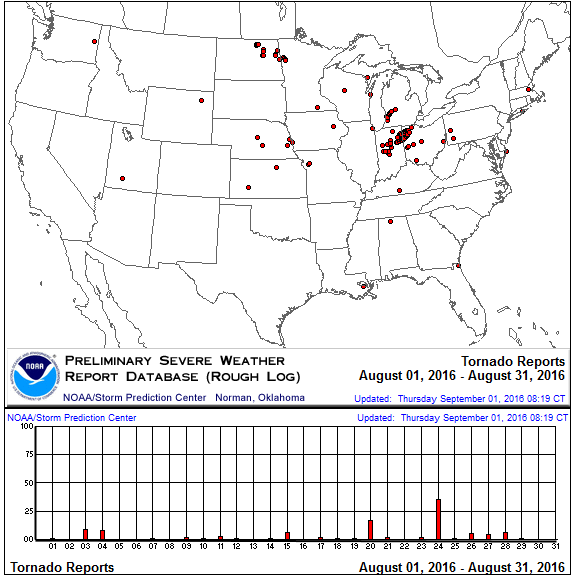
The fronts and upper-level dynamics associated with the troughs provided a trigger for severe weather. According to preliminary data, 110 tornadoes occurred during August 2016, which is above the August average of 83. Most occurred in the Central to Northern Plains and Midwest in association with the fronts and low pressure systems along the storm track.
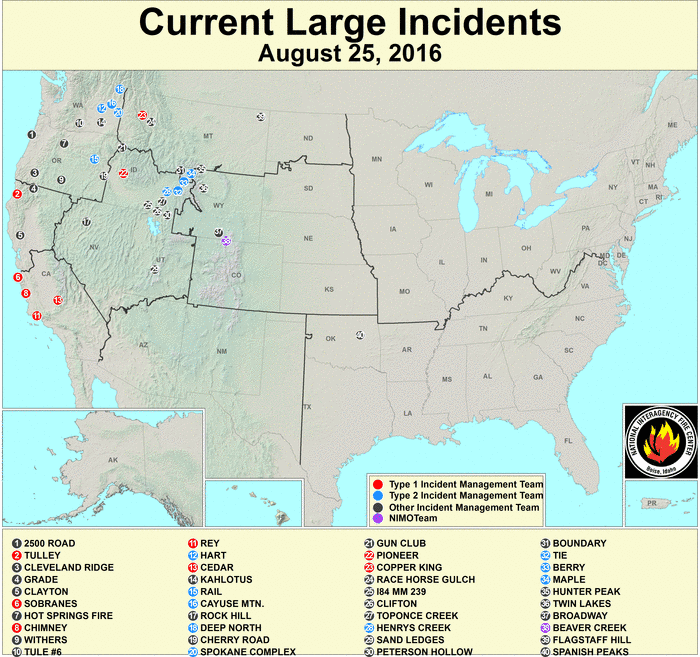
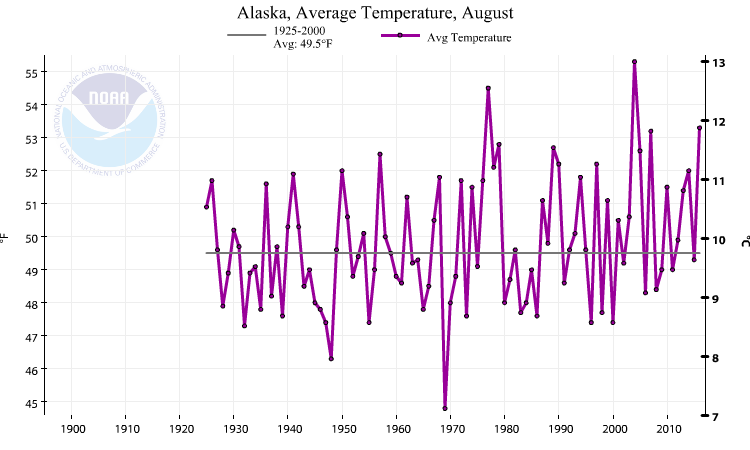
The North Pacific High, in combination with the predominantly northwesterly flow on the west end of the upper-level troughs, kept much of the western CONUS drier than normal. The dry weather was a factor in the development of numerous large wildfires across the West throughout the month (wildfire maps for August 8, 15, 18, 22, 25, 29, 31). Above-normal monsoon rainfall helped to minimize the occurrence of wildfires in the Southwest. Upper-level ridging, in association with the North Pacific High, produced a southerly flow which funneled moist and warmer-than-normal air into Alaska, giving the state the third warmest and 22nd wettest August in its 1925-2016 record.
The stronger-than-normal North Pacific High over the eastern North Pacific helped to deflect away from the CONUS most of the tropical cyclones which developed in the Pacific. Six named tropical cyclones (Hurricanes Lester and Madeline and Tropical Storms Howard, Ivette, Javier, and Kay) formed in the eastern tropical Pacific during August. All but Javier were steered westward by the North Pacific High's steering currents. Tropical Storm Javier crawled north along Baja California before dissipating, but some of its moisture helped feed monsoon showers over the U.S. Southwest. Hurricane Madeline brushed Hawaii by the end of the month, helping give the state a wetter-than-normal August.
With the Pacific Ocean in an ENSO-neutral state, wind shear over the Atlantic Ocean decreased which normally enhances the development of tropical systems. During August 2016, four named tropical cyclones (Hurricanes Earl and Gaston, and Tropical Storms Fiona and Hermine) developed in the North Atlantic, along with two tropical disturbances which didn't develop into named storms. The subtropical high pressure system, which dominated the weather over the southern CONUS during much of August, interacted with these systems differently, depending on each system.
- Hurricane Earl originated over the Caribbean early in the month and was deflected by the subtropical high pressure system's steering currents across Mexico and away from the CONUS.
- Tropical Storm Fiona and Hurricane Gaston developed in the central North Atlantic and were steered away from the CONUS.
- Tropical Depression 8 formed in the western North Atlantic and brushed the North Carolina coast before being steered by the jet stream and a cold front away from the CONUS and further into the North Atlantic.
- A tropical disturbance developed early in the month in the northeastern Gulf of Mexico and impacted northern Florida. It formed beneath a part of the North Atlantic High which had few steering currents, so the disturbance slowly meandered westward along the Gulf coast, finally reaching Louisiana the week of August 14th where it dropped heavy flooding rains before being absorbed into a cold front.
- Another tropical disturbance, which developed over the central Atlantic the week of August 21, was steered by the North Atlantic High westward across the Lesser Antilles and then across the Greater Antilles. It reached the Gulf of Mexico, where the upper-level steering currents were weak, by the end of the month. It slowly turned north, as a front and upper-level trough moved across the eastern U.S., and intensified, reaching Tropical Storm status, on August 31st. It became Hurricane Hermine on September 1st and came ashore in northern Florida, joining with the cold front to bring heavy rain to the coastal Southeast states.
Four tropical cyclones (Tropical Storms Omais, Conson, Chanthu, and Mindulle) and one tropical depression (T.D. 14W) formed near, or affected, the U.S. Affiliated Pacific Islands (USAPI) in the western Pacific during August. Mindulle later intensified to typhoon strength after it had left the USAPI vicinity.
The subtropical highs allowed warmer tropical-type air masses to cover the CONUS more often than cooler polar air masses. As a result, August ended up with 4,826 record warm daily high (1,149) and low (3,677) temperature records. This was about three times the 1,622 record cold daily high (1,110) and low (512) temperature records that were associated with the air masses behind the cold fronts. Nationally, August 2016 ranked as the 17th warmest August in the 1895-2016 record. The REDTI (Residential Energy Demand Temperature Index) for August 2016 ranked second highest in the 122-year record for August, due to much-warmer-than-normal temperatures which increased cooling demand in the heavily-populated East Coast, Great Lakes, Southeast, and West Coast regions.
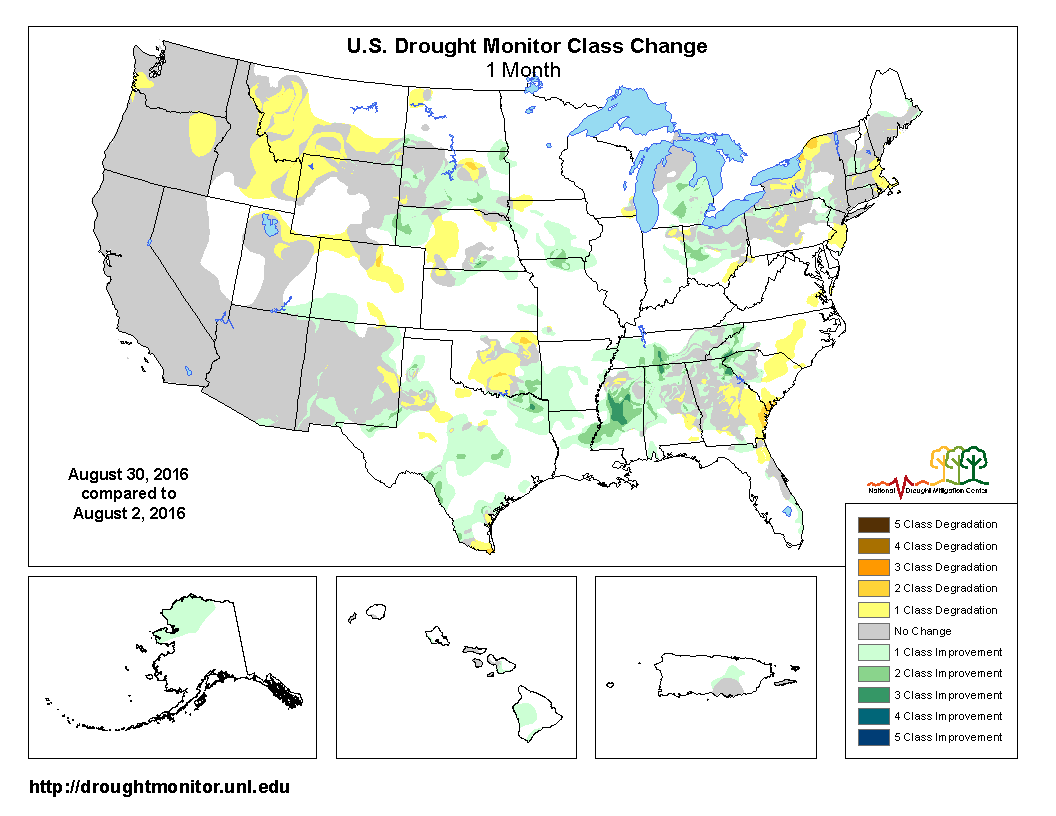
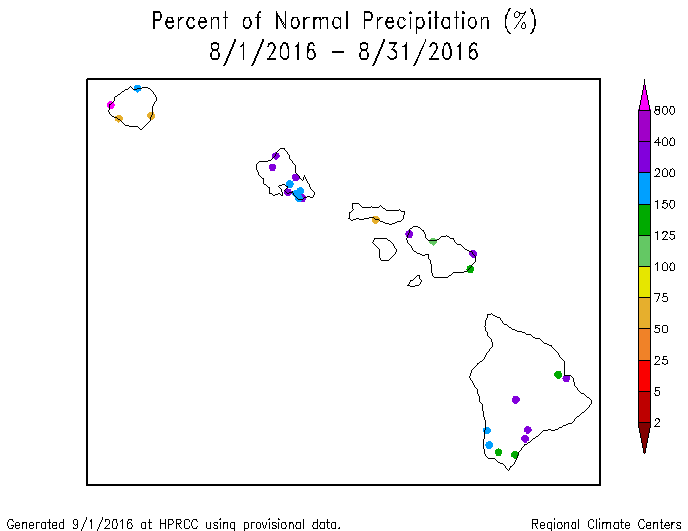
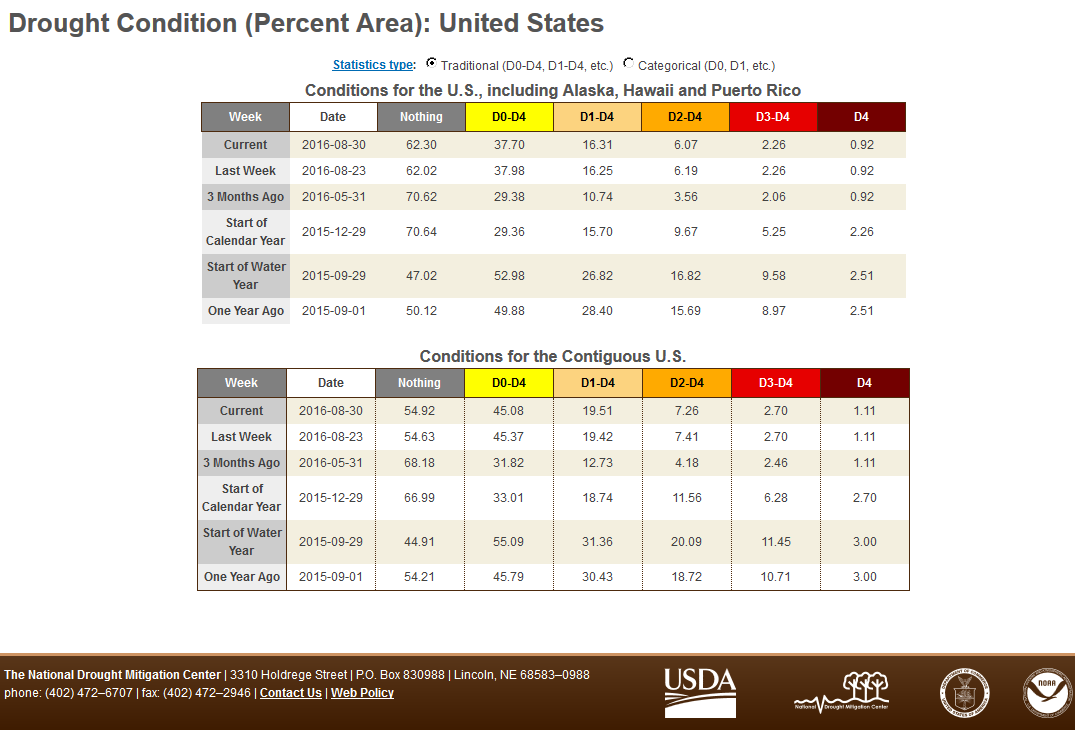
With precipitation reduced by the subtropical highs, and above-normal temperatures enhancing evapotranspiration, especially in the East, drought and abnormal dryness expanded in parts of the Northern Rockies and Pacific Northwest and contracted in Hawaii, due in part to rains from Hurricane Madeline. There were areas of drought expansion and nearby contraction in the Central and Southern Plains, Southeast, and Northeast. When precipitation is averaged across the CONUS, August 2016 ranked as the second wettest August in the 1895-2016 record. Drought contraction outweighed drought expansion, so the national moderate-to-exceptional drought footprint decreased across the CONUS from 21.1 percent at the end of July to 19.5 percent at the end of August (from 17.7 percent to 16.3 percent for all of the U.S.).
The Climate Extremes Index (CEI) aggregates temperature and precipitation extremes across space and time. Although temperature and precipitation extremes occurred during the month in many areas, only one region had a CEI that ranked in the top ten category. The Northeast region had the most extreme August CEI in the 1910-2016 record due to the most extreme warm minimum and third most extreme warm maximum temperature components, and second most extreme 1-day precipitation component. When aggregated across the nation, August 2016 had the second most extreme days with precipitation component, eighth most extreme 1-day precipitation component, and sixth most extreme warm minimum temperature component, but the other national components ranked low, with the August 2016 national CEI ranking as only the 29th most extreme CEI in the 107-year record.
 North America monthly upper-level circulation pattern and anomalies. The upper-level circulation pattern, averaged for the month, consisted of below-normal upper-level (500-mb) height anomalies centered over the Southwest, resulting from troughs frequently moving across and deepening over the West. Above-normal heights dominated over the eastern CONUS and along the West coast extending into the northeastern North Pacific. Of the circulation indices usually discussed on this page, the teleconnections aggregated for a negative NAO, negative WP, and negative PT most closely match the August 2016 500-mb circulation anomalies. |
 Map of monthly precipitation anomalies. August 2016 was drier than normal across much of the West, parts of the East Coast, southeastern Puerto Rico, and parts of Alaska. The month was wetter than normal from the Southern Plains to Great Lakes, much of the Southwest and Central to Northern Plains, most of the Gulf of Mexico coast, most of Hawaii, western and northern Puerto Rico, and parts of Alaska. |
 Map of monthly temperature anomalies. August 2016 temperatures were warmer than normal east of the Mississippi, along the immediate West Coast, and in Alaska. The month was cooler than normal from the interior West to the Great Plains. |
 Northern Hemisphere monthly upper-level circulation pattern and anomalies. Global Linkages: The upper-level (500-mb) circulation anomaly pattern over North America was part of a complex long-wave pattern that stretched across the Northern Hemisphere. There were several regional wiggles, or troughs and ridges, in the monthly average pattern, but positive height anomalies (ridges) seemed to dominate. The most notable below-normal height departures (troughs) occurred over parts of the North Atlantic and North Pacific. The most notable above-normal height departures (ridges) occurred over North America, western Europe, central Eurasia, and the northern North Pacific and adjacent eastern Siberia. The above-normal 500-mb heights were associated with upper-level ridging at the mid-latitudes; below-normal precipitation over Eurasia; and above-normal surface temperatures over the continents and oceans. The few areas of below-normal 500-mb heights were associated with upper-level troughing and near- to below-normal surface temperatures over north central Asia and the North Pacific and North Atlantic Oceans. With most of the continents having warmer-than-normal temperatures, and large portions of the Atlantic and Pacific Oceans having warmer-than-normal sea surface temperatures, the August 2016 global temperature was well above normal. |
Atmospheric Drivers
Subtropical highs, and fronts and low pressure systems moving in the mid-latitude storm track flow, are influenced by the broadscale atmospheric circulation. The circulation of the atmosphere can be analyzed and categorized into specific patterns. The Tropics, especially the equatorial Pacific Ocean, provides abundant heat energy which largely drives the world's atmospheric and oceanic circulation. The following describes several of these modes or patterns of the atmospheric circulation, their drivers, the temperature and precipitation patterns (or teleconnections) associated with them, and their index values this month:
-
El Niño Southern Oscillation (ENSO)
- Description: Oceanic and atmospheric conditions in the tropical Pacific Ocean can influence weather across the globe. ENSO is characterized by two extreme modes: El Niño (warmer-than-normal sea surface temperature [SST] anomalies in the tropical Pacific) and La Niña (cooler-than-normal SST anomalies), with the absence of either of these modes termed "ENSO-neutral" conditions.
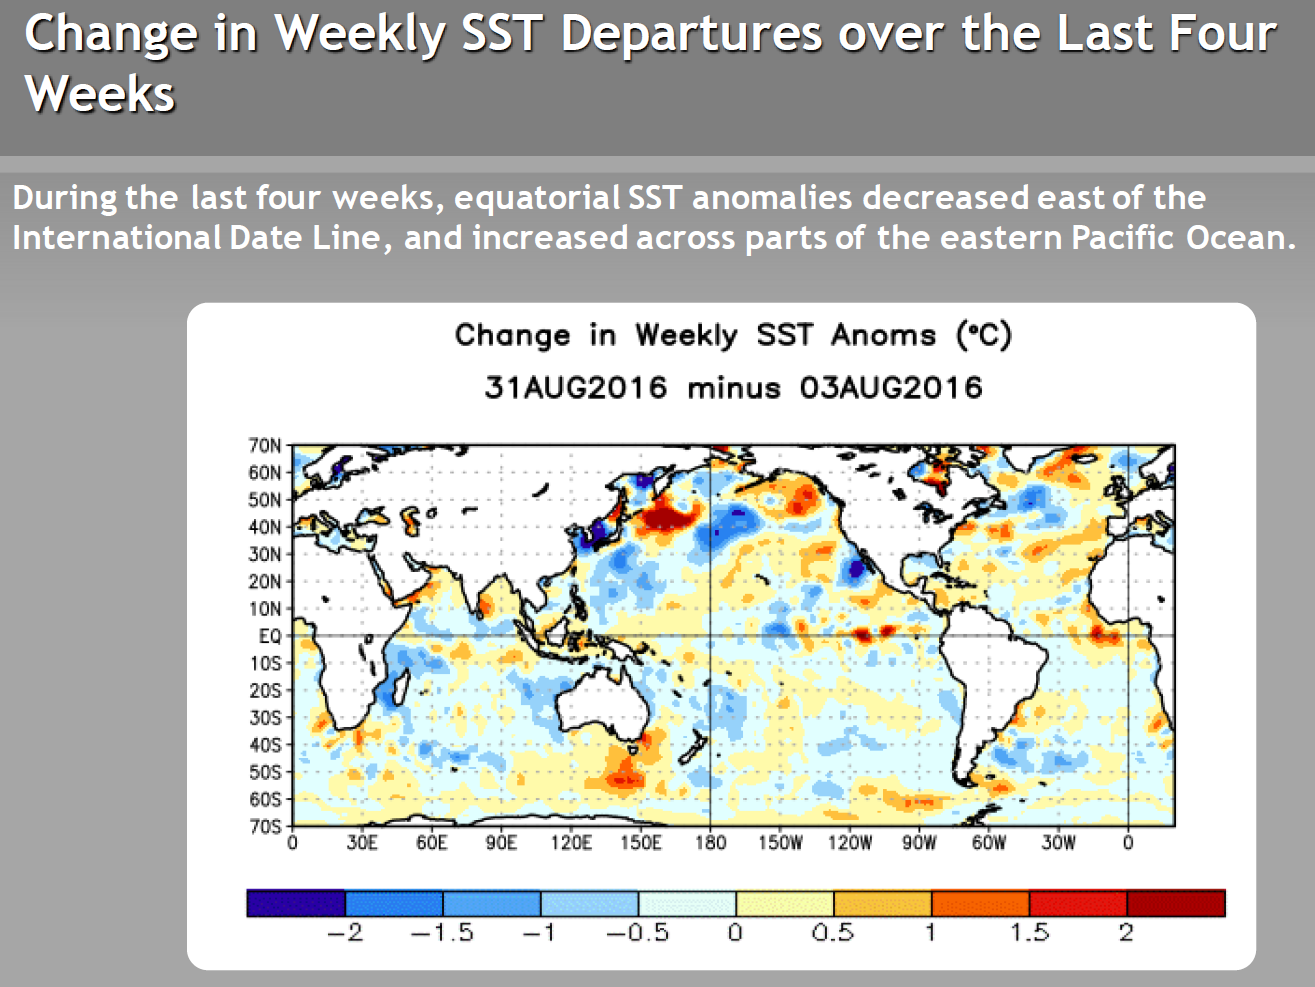
- Status: During August 2016, ENSO-neutral conditions continued as equatorial SSTs were near or below average in the east-central and eastern equatorial Pacific.
- Teleconnections (influence on weather): The NWS CPC has no teleconnections for ENSO-neutral conditions.
- Comparison to Observed: Overall the August 2016 temperature and precipitation anomaly patterns do not match those associated with La Niña or El Niño.
-
Madden-Julian Oscillation (MJO)
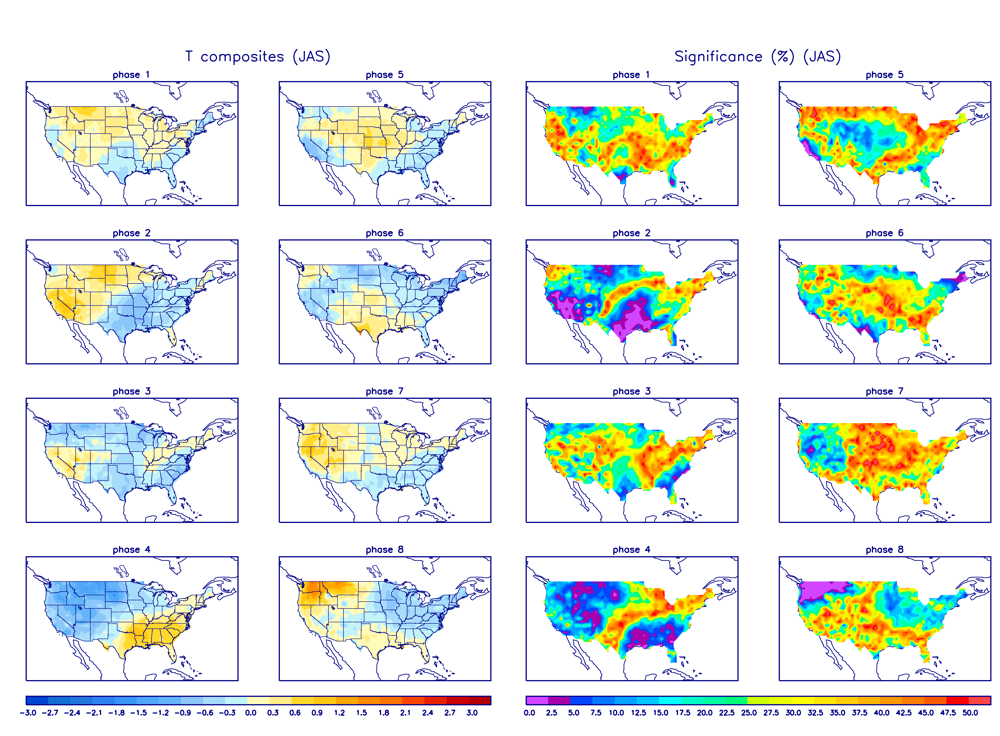
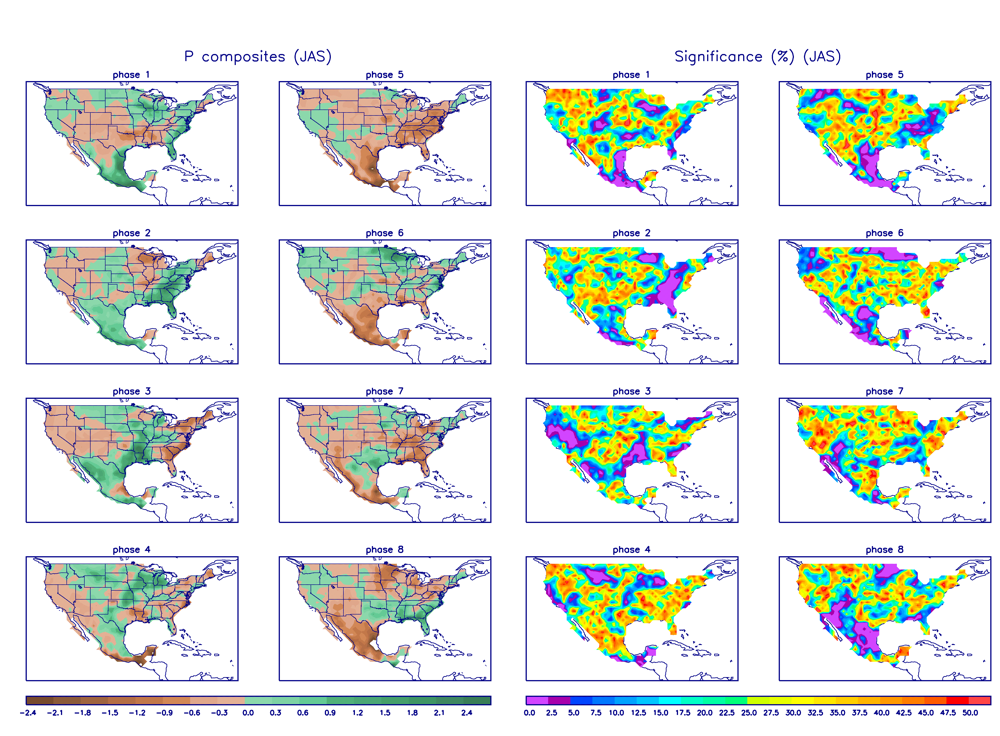
- Description: The MJO is a tropical disturbance or "wave" that propagates eastward around the global tropics with a cycle on the order of 30-60 days. It is characterized by regions of enhanced and suppressed tropical rainfall. One of its indices is a phase diagram which illustrates the phase (1-8) and amplitude of the MJO on a daily basis. The MJO is categorized into eight "phases" depending on the pattern of the location and intensity of the regions of enhanced and suppressed tropical rainfall. The MJO can enter periods of little or no activity, when it becomes neutral or incoherent and has little influence on the weather. Overall, the MJO tends to be most active during ENSO-neutral years, and is often absent during moderate-to-strong El Niño and La Niña episodes.
- Status: The MJO index began the month incoherent, then weakly transitioned into phases 5 and 6, spending most of the month in phase 6, before ending the month incoherent. Other modes of coherent subseasonal tropical variability, including Rossby wave activity, influenced the tropical Pacific and global climate, especially the development of tropical cyclones in the western Pacific. These Rossby waves, tropical cyclones, and the monsoon trough in the western North Pacific may have masked the influence of the MJO (MJO updates for August 8, 15, 22, 29, and September 5).
- Teleconnections (influence on weather): The MJO's temperature and precipitation teleconnections to U.S. weather depend on time of year and MJO phase. To the extent teleconnections are known, the August (July-September) teleconnections for temperature are shown here and for precipitation are shown here.
- Comparison to Observed: The MJO is transitory and can change phases (modes) within a month, so it is more closely related to weekly weather patterns than monthly. In the case of August 2016, the MJO index spent most of the month in phase 6. The weekly temperature and precipitation anomaly patterns generally don't match the teleconnections for phase 6, nor do the monthly temperature and precipitation anomaly patterns.
- The Pacific/North American (PNA) pattern
- Description: The PNA teleconnection pattern is associated with strong fluctuations in the strength and location of the East Asian jet stream. PNA-related blocking of the jet stream flow in the Pacific can affect weather downstream over North America, especially the West and especially in the winter half of the year.
- Status: The daily PNA index was negative for much of the month, then turned positive, averaging negative for the month as a whole. The 3-month-averaged index was near zero but slightly negative.
- Teleconnections (influence on weather): To the extent teleconnections are known, there is very little correlation for a negative PNA for this time of year (July on the quarterly teleconnection maps) has few teleconnections for on the precipitation, temperature, and upper-level circulation teleconnection maps.
- Comparison to Observed: The August 2016 precipitation, temperature, and upper-level circulation anomaly patterns have little to compare to (few correlations over the CONUS), but there is little agreement where the correlations exist.
- The Arctic Oscillation (AO) pattern
- Description: The AO teleconnection pattern relates upper-level circulation over the Arctic to circulation features over the Northern Hemisphere mid-latitudes and is most active during the cold season.
- Status: The daily AO index oscillated above zero throughout the month, averaging positive for the month. The 3-month-averaged index was positive.
- Teleconnections (influence on weather): To the extent teleconnections are known, a positive AO in August (July-September) is typically associated with dry conditions in the Southern Plains and from the Midwest to New England; wet conditions in the Coastal Southeast; above-normal temperatures in the Northern Plains; and upper-level circulation anomalies which are above normal across the North Pacific, North Atlantic, and eastern Canada, and below normal across the north polar regions.
- Comparison to Observed: The August 2016 upper-level circulation anomaly pattern shows some agreement over eastern Canada and parts of the North Pacific, but not elsewhere. The August 2016 monthly temperature anomaly pattern shows no agreement, and the precipitation anomaly pattern is largely opposite that expected with a positive AO.
- The North Atlantic Oscillation (NAO) pattern
- Description: The NAO teleconnection pattern relates upper-level circulation over the North Atlantic Ocean to circulation features over the Northern Hemisphere mid-latitudes.
- Status: The daily NAO index was mostly negative, averaging negative for the month. The 3-month-averaged index was also negative.
- Teleconnections (influence on weather): To the extent teleconnections are known, a negative NAO during August (July on the quarterly teleconnection maps) is associated with below-normal temperatures in the Northern Rockies to Northern Plains; above-normal temperatures from the Southern Plains to Southeast; below-normal upper-level circulation anomalies over much of the West to Great Lakes, and from the North Atlantic to Western Europe; and above-normal upper-level circulation anomalies along the coastal Southeast, in the northeastern North Pacific, and over Greenland. The precipitation teleconnections are very weak, with wetter-than-normal anomalies in the Northern High Plains and Mid-Mississippi Valley, and drier-than-normal conditions in parts of the Southern Plains.
- Comparison to Observed: The August 2016 upper-level circulation anomaly pattern is a good match with that expected with a negative NAO in most areas, except over the eastern CONUS where the anomalies appear shifted. There is some agreement with the August 2016 temperature anomaly pattern, again with the pattern shifted somewhat. The August 2016 precipitation anomaly pattern mostly disagrees with those expected with a negative NAO where teleconnections exist.
- The West Pacific (WP) pattern
- Description: The WP teleconnection pattern is a primary mode of low-frequency variability over the North Pacific and reflects zonal and meridional variations in the location and intensity of the (East Asian) jet stream in the western Pacific.
- Status: The monthly WP index was slightly negative and the three-month average WP index was negative.
- Teleconnections (influence on weather): To the extent teleconnections are known, a negative WP during August (July on the quarterly teleconnection maps) is typically associated with above-normal temperatures in the Southwest, Mid- and Upper-Mississippi Valley to East Coast, and eastern Canada; below-normal temperatures in northwest Canada; below-normal circulation anomalies over western Canada; and above-normal circulation anomalies over eastern Canada, most of the eastern CONUS, eastern Siberia, and over the North Pacific from Hawaii to California-Nevada. There are no precipitation teleconnections in the CONUS.
- Comparison to Observed: The August 2016 monthly temperature anomaly pattern agrees with that expected with a negative WP over the CONUS, and the upper-level circulation anomaly pattern agrees over the CONUS and much of the North Pacific. The precipitation anomaly pattern has no teleconnections over the CONUS to compare to.
- The Pacific Transition (PT) pattern
- Description: The PT teleconnection pattern relates upper-level circulation over the central subtropical North Pacific to circulation features over North America. It is a significant factor in the earth's circulation during August and September.
- Status: The PT index was negative during August.
- Teleconnections (influence on weather): To the extent teleconnections are known, a negative PT is typically associated with colder-than-normal temperatures for the western CONUS and western Canada, warmer-than-normal temperatures for the eastern CONUS, and wetter-than-normal conditions in the Midwest, Alaska, and parts of the Pacific Northwest to Northern Plains. The upper-level circulation anomalies for a negative PT are above-normal 500-mb geopotential heights over the eastern third of the CONUS into the North Atlantic, above-normal heights over the northeastern Pacific (including the Gulf of Alaska), and below-normal heights over the western half of the CONUS into south central Canada.
- Observed: The August 2016 upper-level circulation anomaly pattern shows good agreement with that expected with a negative PT. The August 2016 monthly temperature anomaly pattern agrees, but seems slightly shifted, and the precipitation anomaly pattern agrees where teleconnections exist, except in the Pacific Northwest.
- The East Pacific-North Pacific (EP-NP) pattern
- Description: The EP-NP teleconnection pattern relates SST and upper-level circulation patterns (geopotential height anomalies) over the eastern and northern Pacific to temperature, precipitation, and circulation anomalies downstream over North America. Its influence during the winter is not as strong as during the other three seasons.
- Status: There were areas of warming SSTs and areas of cooling SSTs in the North Pacific over the last month, but the overall pattern of SST anomalies changed little in August compared to July. The SSTs were warmer than normal across the far northern North Pacific, and from the Mexican coast to Indonesia, and cooler than normal in a band between these two warmer-than-normal regions and along the central to eastern equatorial Pacific. Sea level pressure was above normal across much of the far northern North Pacific, coincident with the above-normal SSTs, indicating a stronger-than-normal North Pacific High. The August 2016 monthly EP-NP index and 3-month running mean were slightly negative.
- Teleconnections (influence on weather): To the extent teleconnections are known, a negative EP-NP index during August (July on the quarterly teleconnection maps) is typically associated with warmer-than-normal temperatures across central to eastern Canada and across the CONUS from the Central Rockies to Great Lakes; below-normal upper-level circulation anomalies (weaker upper-level ridge) over Alaska and western Canada; and above-normal upper-level circulation anomalies (weaker upper-level trough) from the Central Rockies (in the CONUS) to Hudson Bay in eastern Canada, and over the central North Pacific. The precipitation teleconnections are weak but show below-normal precipitation in Montana and Iowa.
- Comparison to Observed: The August 2016 upper-level circulation, temperature, and precipitation anomaly patterns show little agreement to the teleconnections.
Examination of the available circulation indices and their teleconnection patterns, and comparison to observed August 2016 temperature, precipitation, and circulation anomaly patterns, suggest that the weather over the CONUS in August was traced mostly to atmospheric drivers originating over the North Pacific and North Atlantic. The tropical Pacific Ocean was in an ENSO-neutral state. Rossby waves, tropical cyclones, and the monsoon trough in the western North Pacific may have masked the influence of the MJO. The daily values for the PNA transitioned from negative to positive during the month and the AO daily index was only slightly positive. The North Pacific High was stronger than normal, thus displacing and weakening the Aleutian Low, which is not normally as active during the summer as in the winter. The EP-NP index was weak. The NAO and PT indices had reasonably strong values, and the NAO, PT, and WP had the best correlations with the observed anomaly patterns. This is the case for the observed temperature anomaly pattern and especially true for the upper-level circulation anomaly pattern. When the teleconnections for the NAO, PT, and WP indices are examined collectively, they match the observed anomaly patterns very well, suggesting the drivers behind these indices influenced this month's weather over the CONUS. The poor teleconnections for precipitation reflect the random nature of summertime convection.
This month illustrates how the weather and climate anomaly patterns can be strongly influenced by atmospheric drivers (or modes of atmospheric variability) originating in the North Atlantic and North Pacific Oceans, with the Bermuda and North Pacific subtropical highs playing an important role.