Note: This Synoptic Discussion describes recent weather events and climate anomalies in relation to the phenomena that cause the weather. These phenomena include the jet stream, fronts and low pressure systems that bring precipitation, high pressure systems that bring dry weather, and the mechanisms which control these features — such as El Niño, La Niña, and other oceanic and atmospheric drivers (PNA, NAO, AO, and others). The report may contain more technical language than other components of the State of the Climate series.
Summary
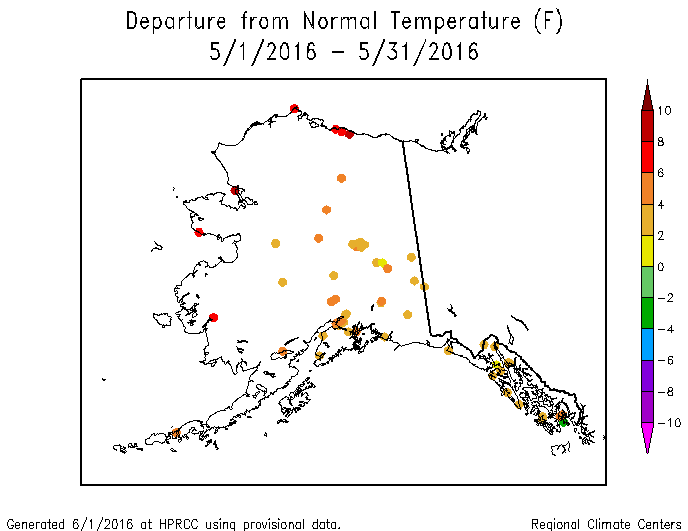
The El Niño dissipated during May 2016. A continued stronger-than-normal Aleutian Low energized the upper-level circulation pattern over the contiguous United States (CONUS). An upper-level ridge across western North America gave Alaska, the Pacific Northwest, and much of Canada warmer-than-normal temperatures, while upper-level troughs spun off from the Aleutian Low and undercut the ridge, bringing cooler-than-normal weather to much of the CONUS. The troughs also brought wetter-than-normal weather to parts of the West, Plains, and Southeast, contracting drought and abnormal dryness. They also triggered severe weather in parts of the country east of the Rockies. The upper-level circulation, temperature, and precipitation anomaly patterns suggest that the weather and climate of May 2016 were the result of a combination of atmospheric drivers originating over the Atlantic and Pacific Oceans. See below for details.
Synoptic Discussion
 Animation of daily upper-level circulation for the month.
|
 Animation of daily surface fronts and pressure systems for the month.
|
In the Northern Hemisphere, May marks the end of climatological spring which is the time of year when solar heating increases with the rising sun angle. This increase in solar heating makes arctic air masses not as cold as they are in winter, contracts the circumpolar vortex, and forces the jet stream northward. Polar air masses influence the weather over the contiguous U.S. (CONUS) less, and the warm, dry subtropical high pressure belts influence the weather more.
During May 2016, the upper-level circulation reflected this battle between the subtropical high pressure systems and the circumpolar vortex. High pressure ridging dominated much of North America, resulting in above-normal 500-mb height anomalies that stretched across Alaska, the Pacific Northwest, and most of Canada. But, as in previous months, the Aleutian Low was stronger than normal, contributing to below-normal 500-mb heights over the north central North Pacific. Low pressure troughs and energy centers spun off the Aleutian Low and undercut the North American ridge, creating large upper-level low pressure systems which moved across the CONUS. These frequently slowed or got cut off from the jet stream flow, resulting in near- to below-normal 500-mb heights over the CONUS.
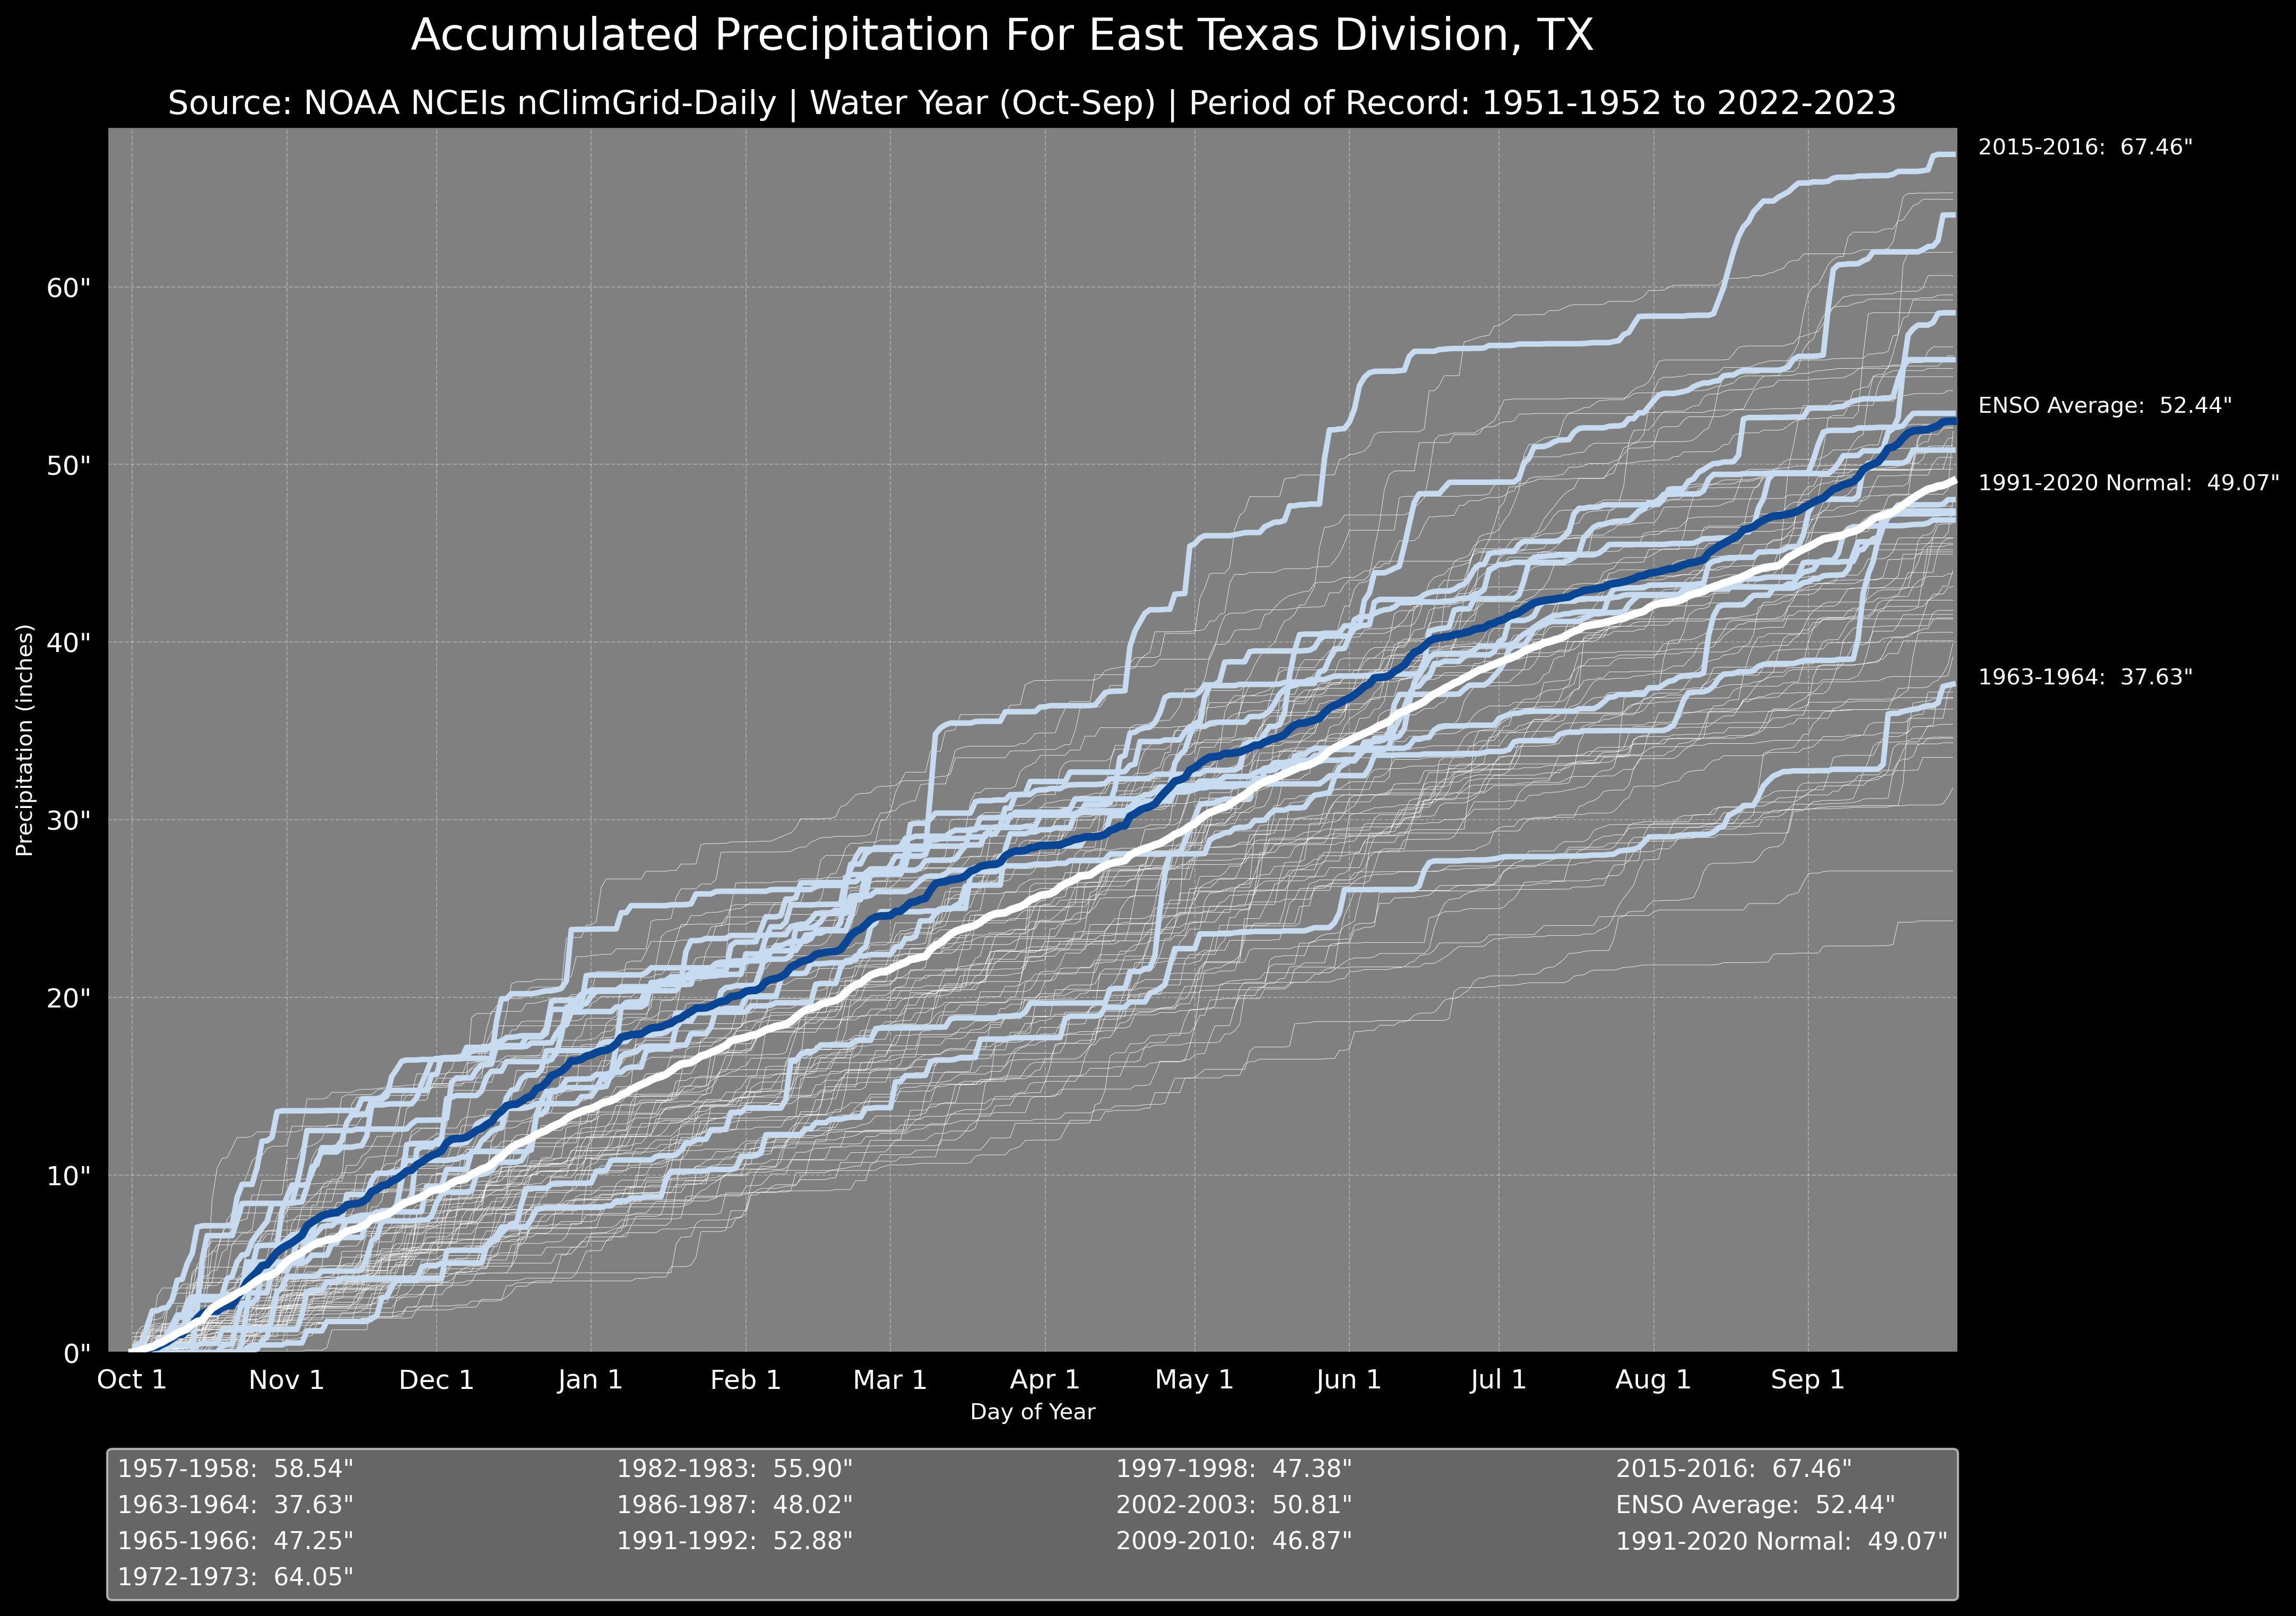
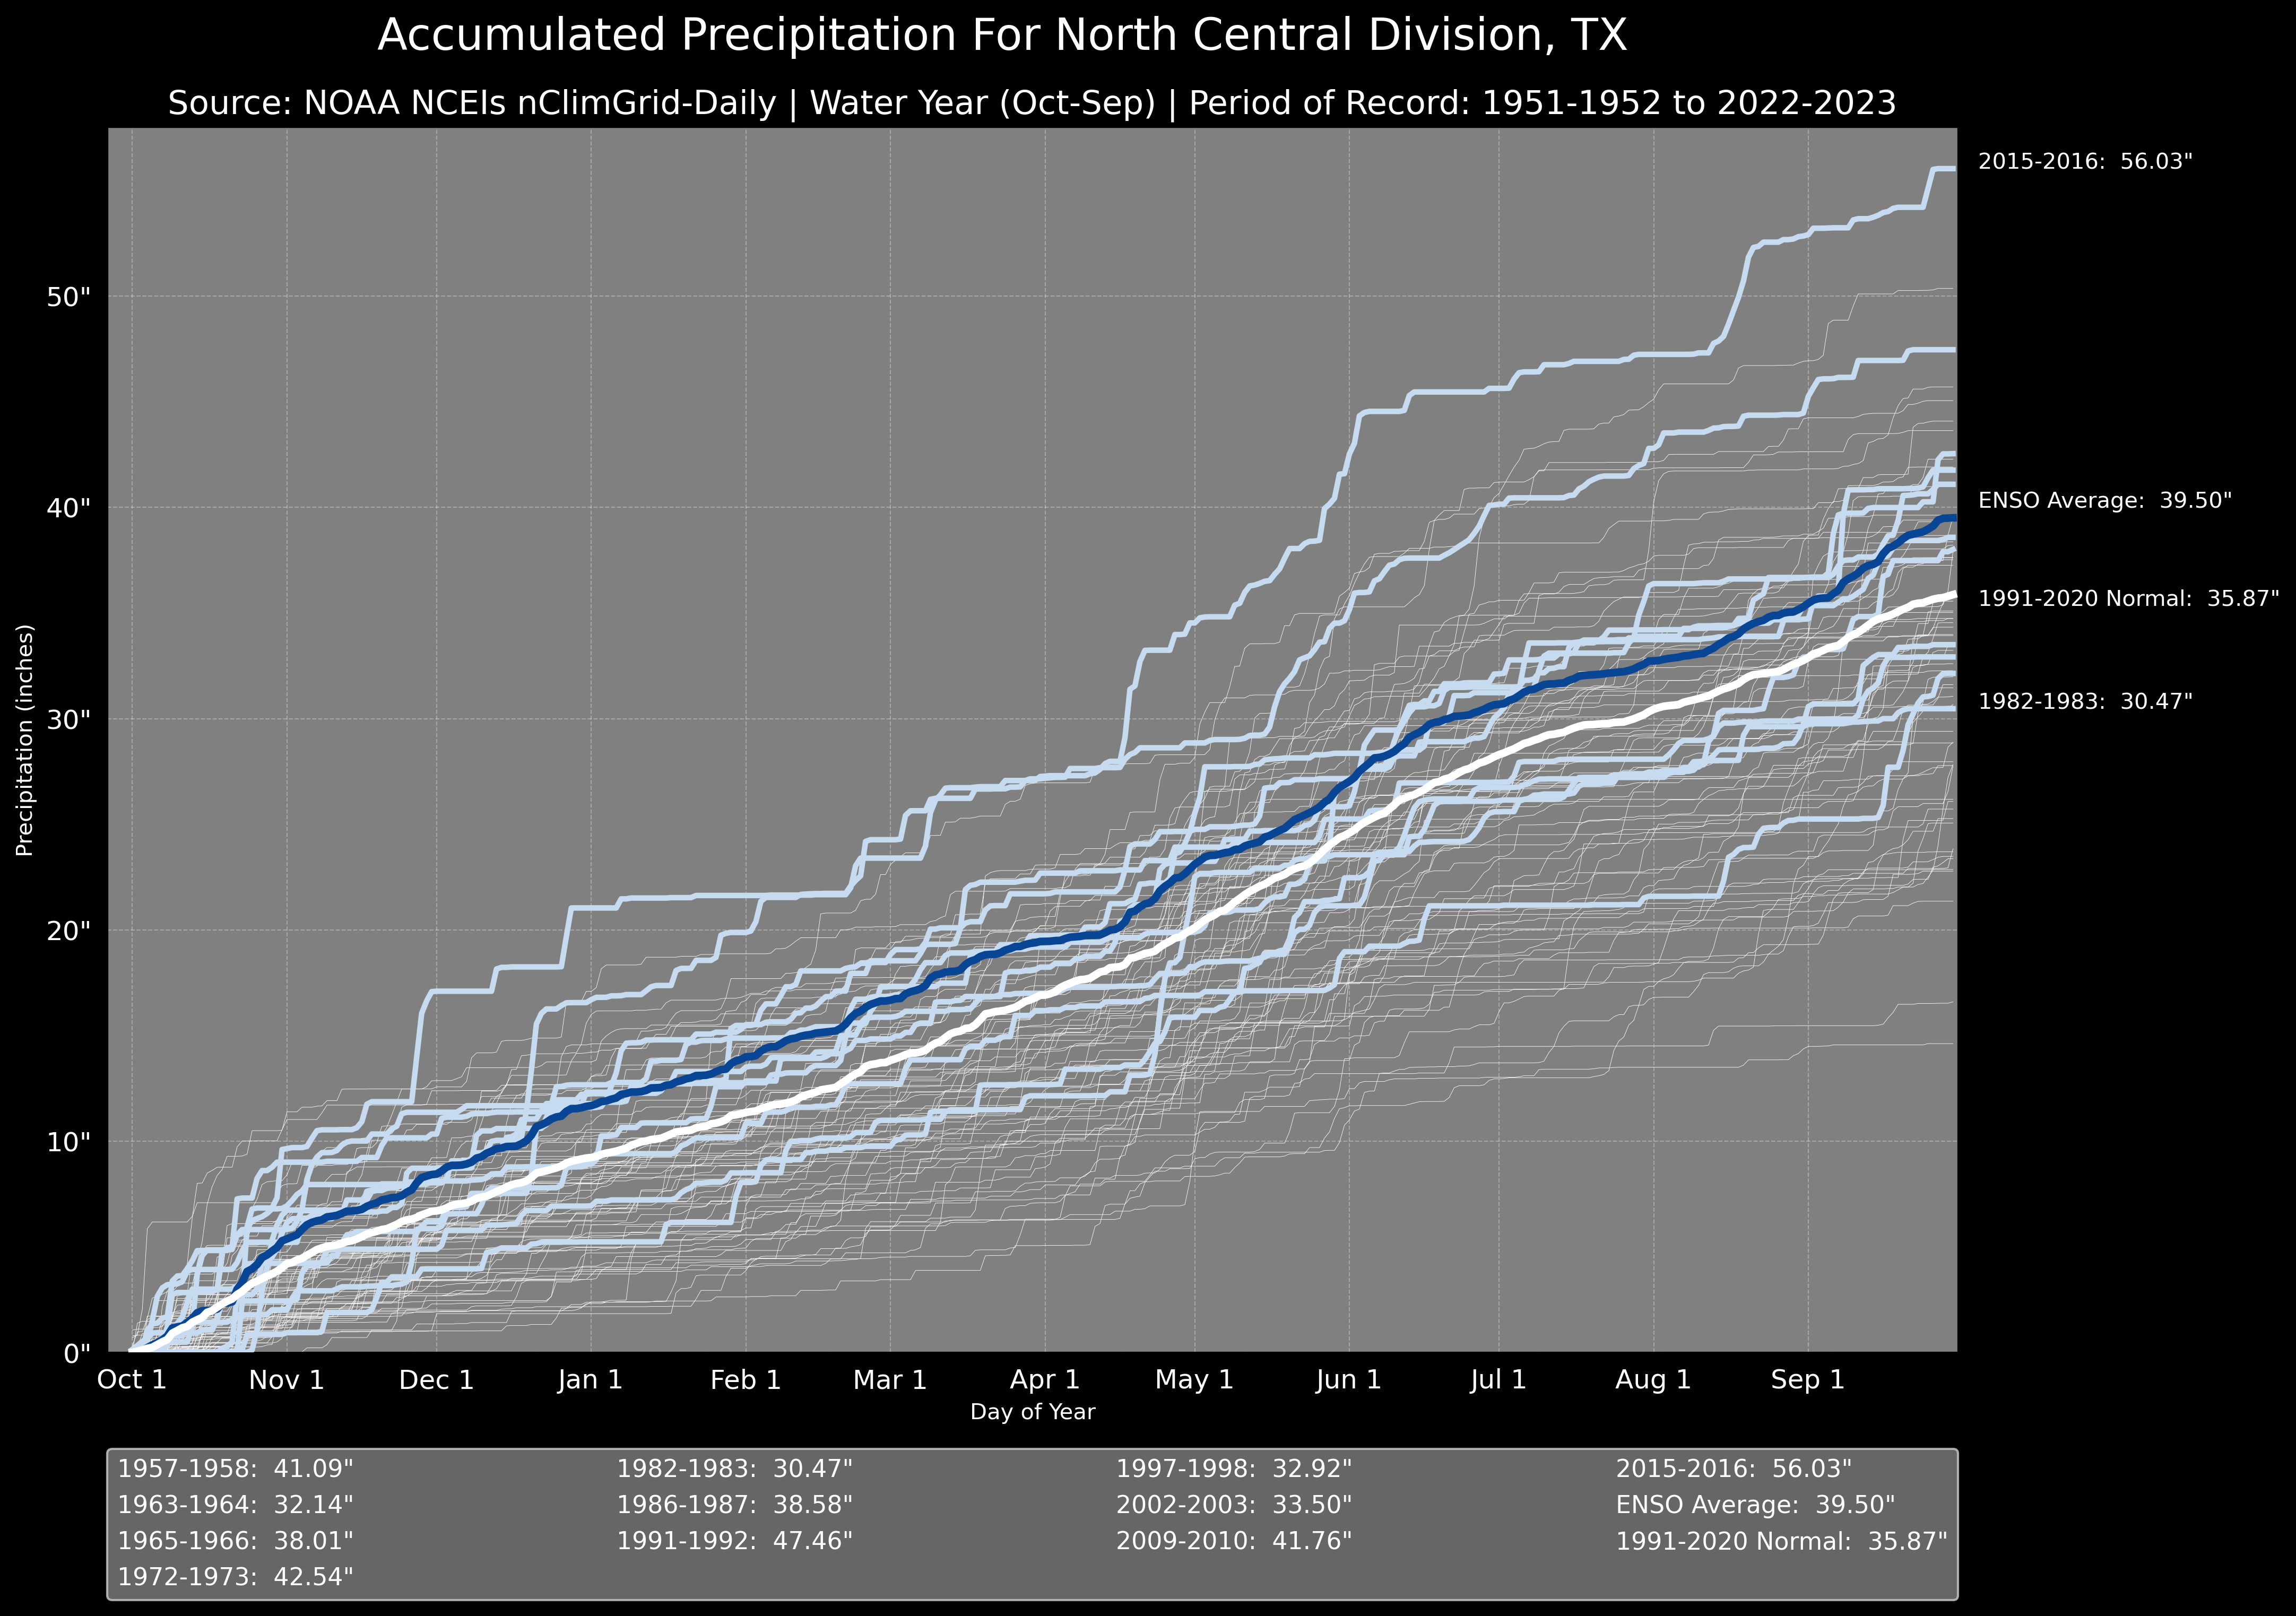
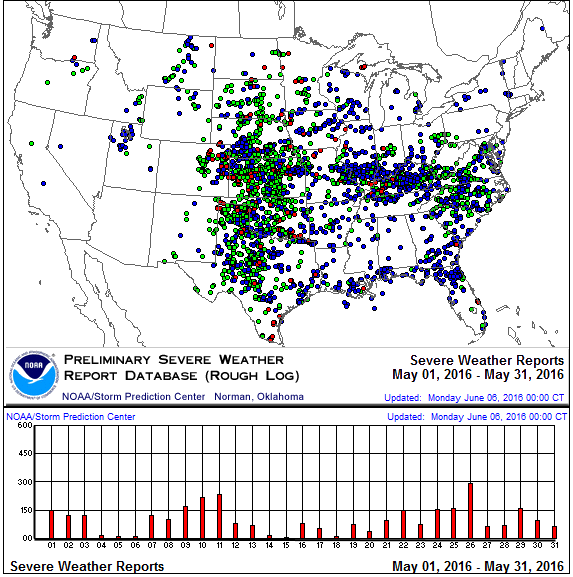
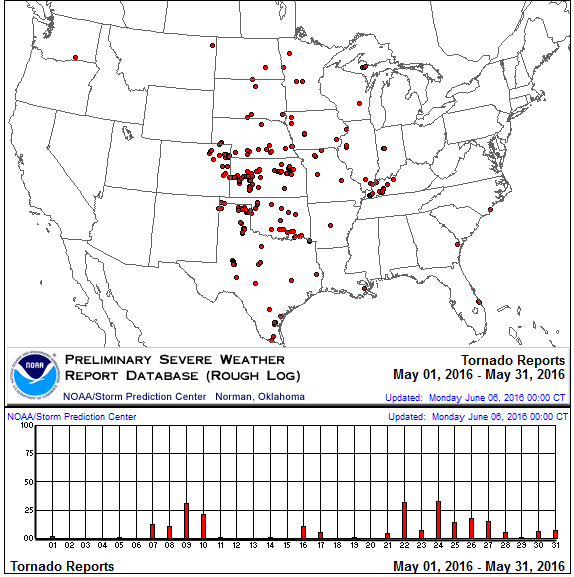
As the upper-level troughs and lows crept across the western CONUS, their Pacific moisture contributed to above-normal precipitation over parts of the West, especially in the Southwest. The southerly circulation along their eastern edge funneled Gulf of Mexico moisture into the Great Plains, bringing above-normal precipitation to parts of the Plains, including flooding rains over large sections of Texas. Parts of eastern and north central Texas have received record precipitation for the water year-to-date (since October 1, 2015). Some of the upper troughs intensified and slowed down as they moved over the eastern third of the CONUS, bringing above-normal precipitation to the southern to Mid-Atlantic coast. Tropical Storm Bonnie contributed some of this precipitation near the end of the month. The upper-level dynamics associated with the troughs and lows, especially along their eastern edge, supported the development of severe weather east of the Rockies, with 239 tornadoes (according to preliminary reports) occurring. Ridging from the Bermuda High (which is also known as the North Atlantic High) competed with the upper-level lows to help keep the tornado count slightly below the May average of 276 tornadoes.
The Aleutian Low directed many Pacific storm systems into western North America, but the upper-level ridging inhibited precipitation in the coastal areas of the CONUS, resulting in below-normal precipitation. Likewise, the upper-level dynamics (descending air) associated with the Bermuda High helped to inhibit precipitation in parts of the Deep South, where the month was drier than average.
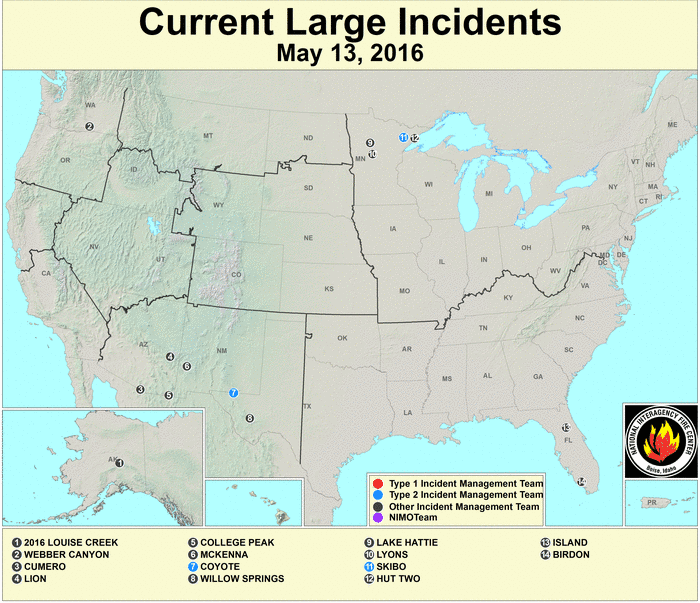
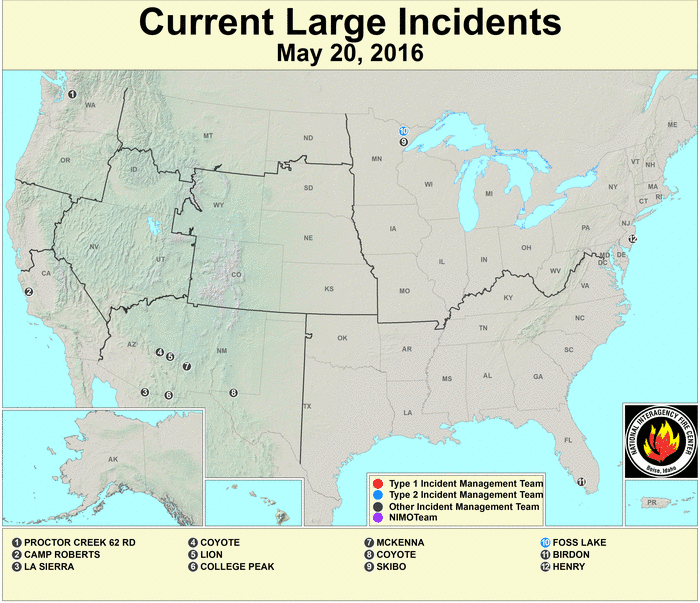
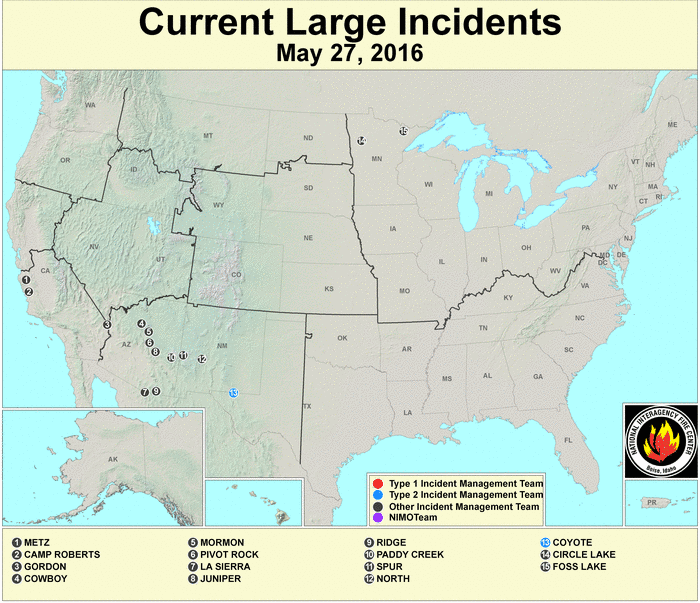
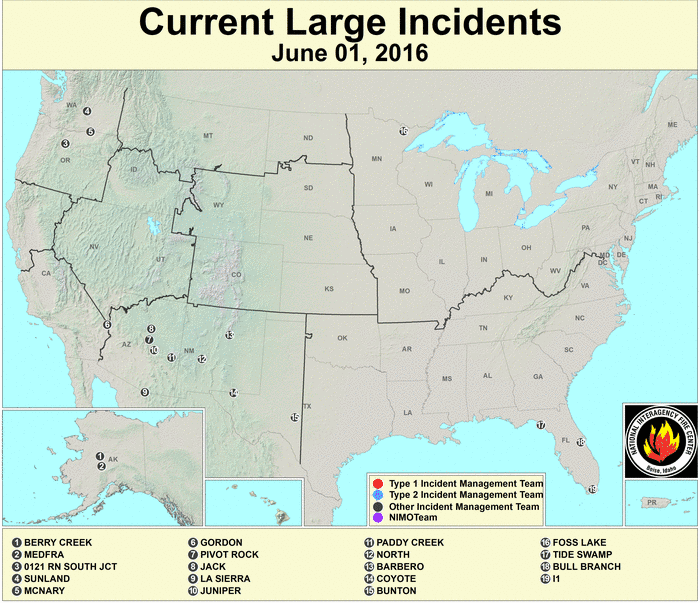
Drier-than-normal weather for much of the last six months set the stage for development of large wildfires in the Southwest. In spite of May rains, several wildfires developed this month (wildfire maps for May 13, 20, 27, June 1).
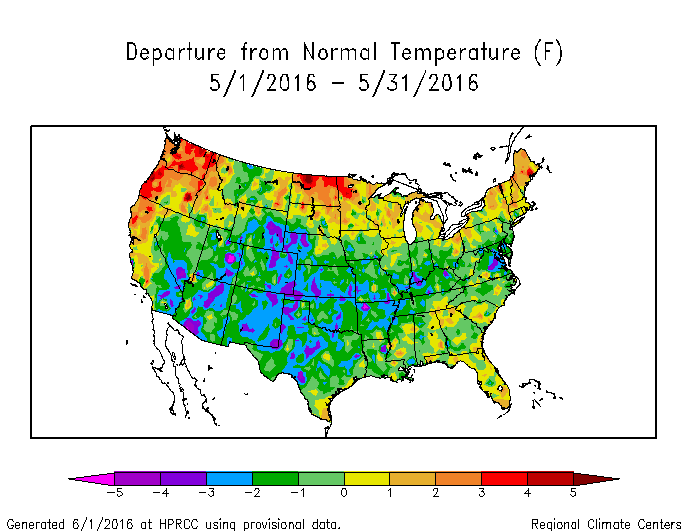
The upper-level troughs that dominated the jet stream flow funneled cooler and drier Canadian air masses into the CONUS, especially during the middle of the month (temperature anomaly maps for weeks 1, 2, 3, 4, 5) (precipitation anomaly maps for weeks 1, 2, 3, 4, 5). This resulted in cooler-than-normal monthly temperatures from the Southwest to Mid-Atlantic States. Upper-level ridging kept the Pacific Northwest and extreme northern Plains warmer than normal.
With the competition between ridges and troughs, and frequent passage of frontal systems, May ended up with 2,122 record warm daily high (771) and low (1,351) temperature records, which is about the same as the 2,061 record cold daily high (1,547) and low (514) temperature records. Nationally, May 2016 ranked as the 62nd coolest May in the 1895-2016 record. The REDTI (Residential Energy Demand Temperature Index) for May 2016 ranked 25th lowest in the 122-year record for May, illustrating how the cooler-than-normal temperatures reduced heating demand across much of the CONUS during this transition season.
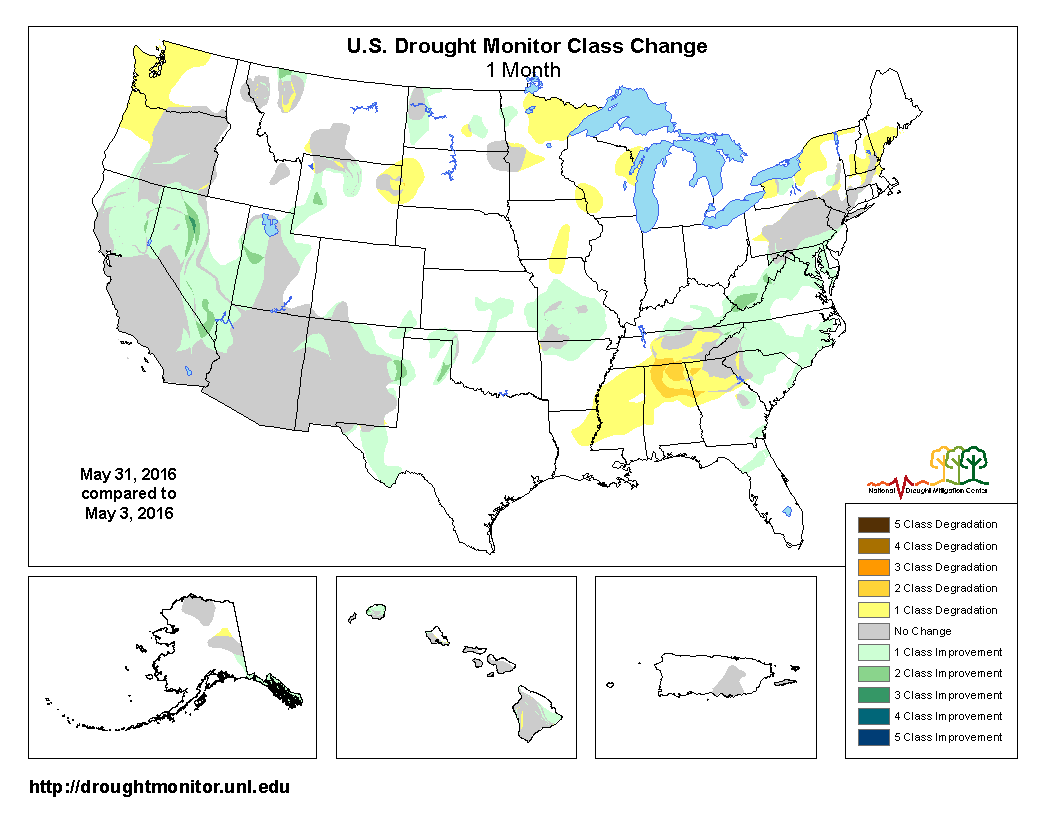
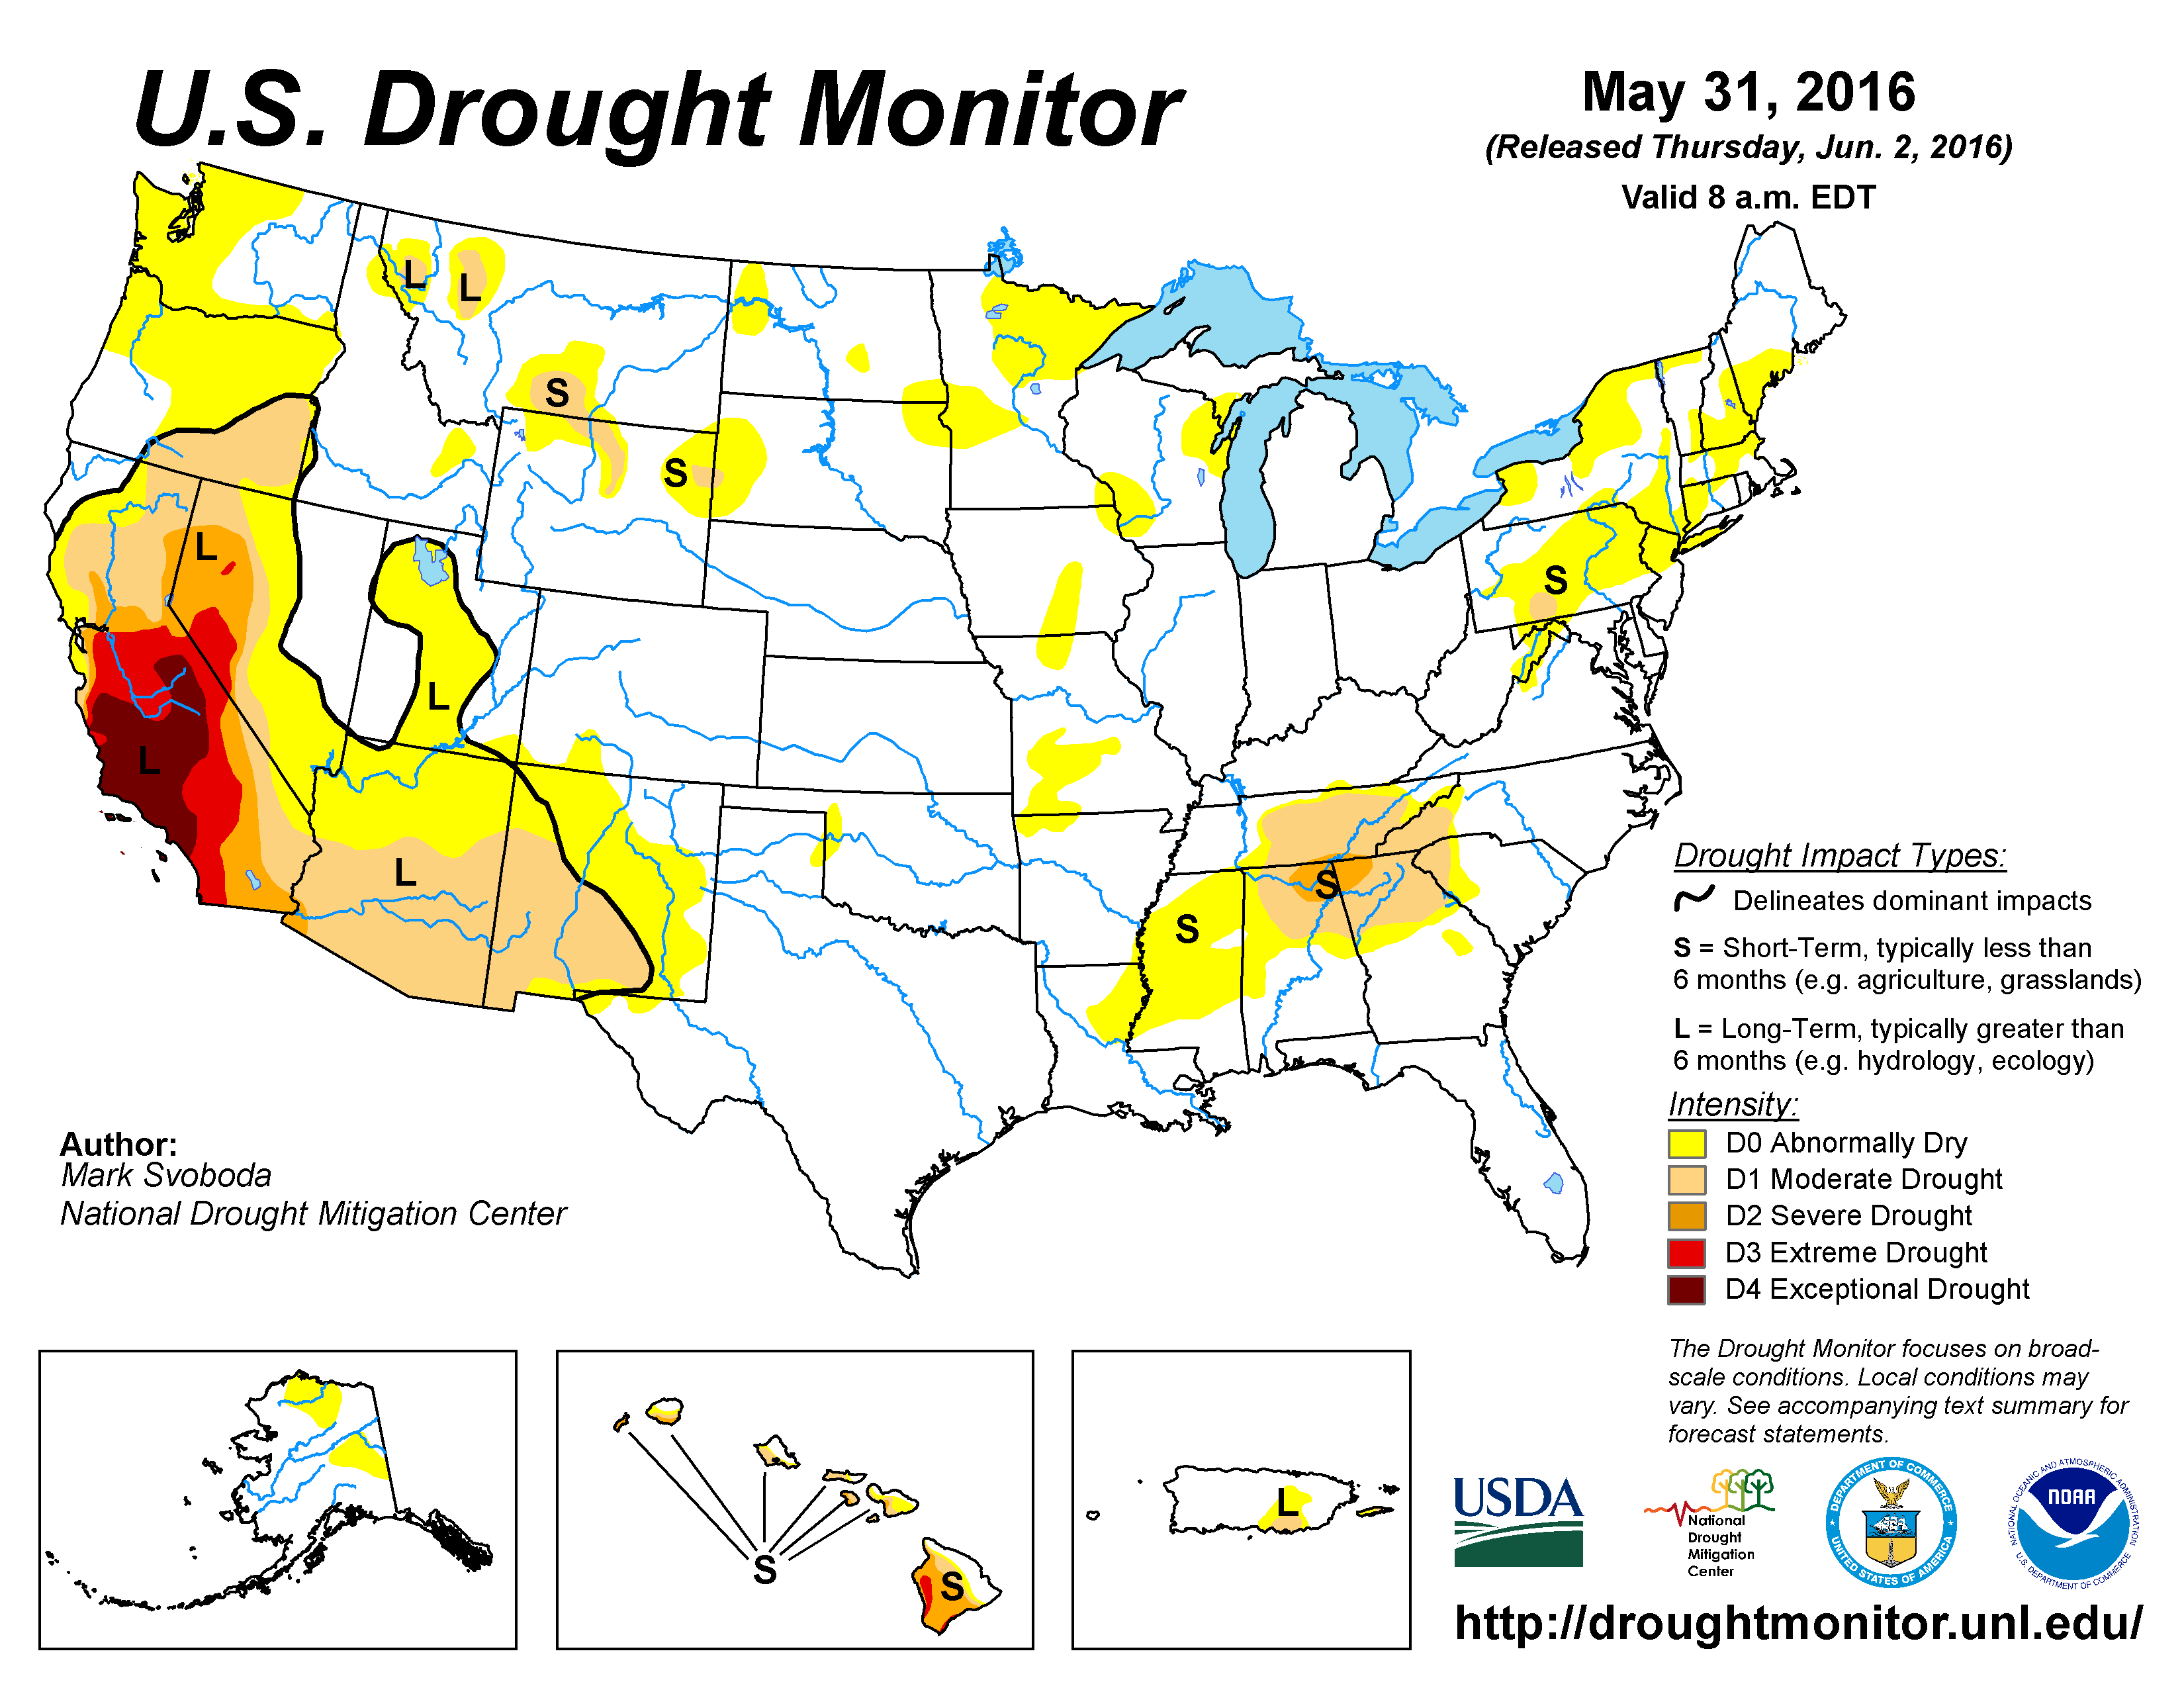
Nationally, the mix of abnormally wet and abnormally dry areas ranked May 2016 as the 45th wettest May on record. The wet conditions in the Great Plains, West, and coastal Southeast to Mid-Atlantic helped contract drought and abnormally dry areas in those regions. But the drier-than-normal weather expanded drought and abnormally dry areas in parts of the Deep South, coastal Northwest, and Northeast. Drought contracted slightly in the Hawaiian Islands, but El Niño-induced severe to extreme drought continued to affect much of the U.S.-Affiliated Pacific Islands. Overall, the national moderate-to-exceptional drought footprint shrank to 10.7 percent of the U.S. as a whole, and 12.7 percent of the CONUS.
The Climate Extremes Index (CEI) aggregates temperature and precipitation extremes across space and time. Although temperature and precipitation extremes occurred at times during the month in some areas, the duration and extent of the extremes were not large enough to significantly affect the CEI components for most regions. The Northwest region had the fifth most extreme 1-day precipitation component and sixth most extreme warm minimum temperature component, and the West region had the seventh most extreme warm minimum temperature component. But the other components were not as extreme, so the May 2016 regional CEI ranks were only 29th highest for the Northwest and 65th highest for the West out of 107 years. When aggregated across the nation, May 2016 had the ninth least extreme national May CEI on record
 North America monthly upper-level circulation pattern and anomalies. The upper-level circulation pattern, averaged for the month, consisted of a dominant ridge with above-normal height anomalies over Alaska and most of Canada, extending into the Pacific Northwest. Troughs and ridges migrating through the jet stream flow varied the pattern throughout the month, with frequent troughs and cutoff lows resulting in a near- to below-normal 500-mb height anomaly pattern for the month across most of the CONUS. |
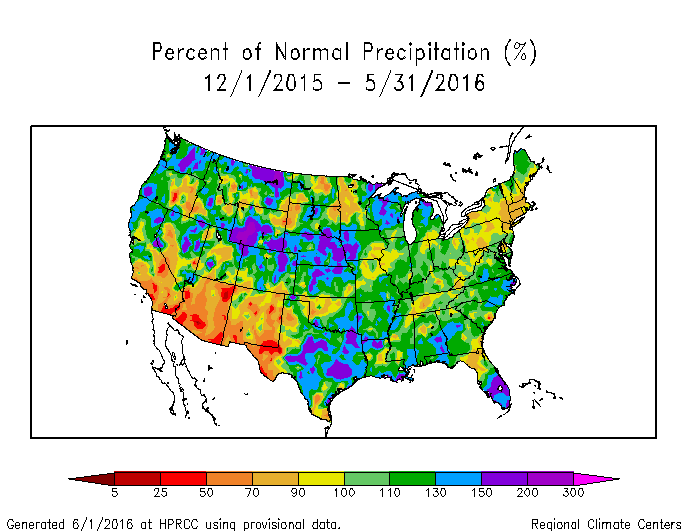
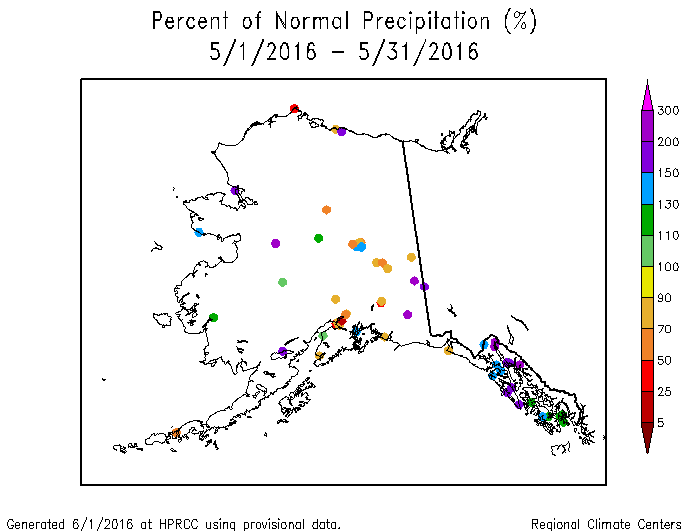
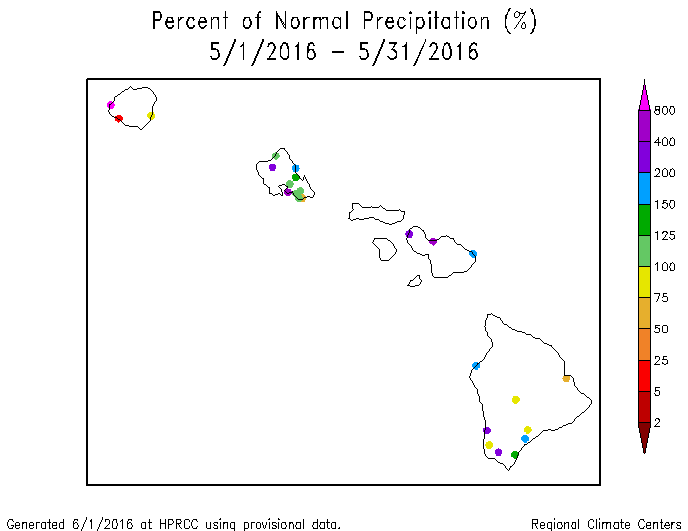
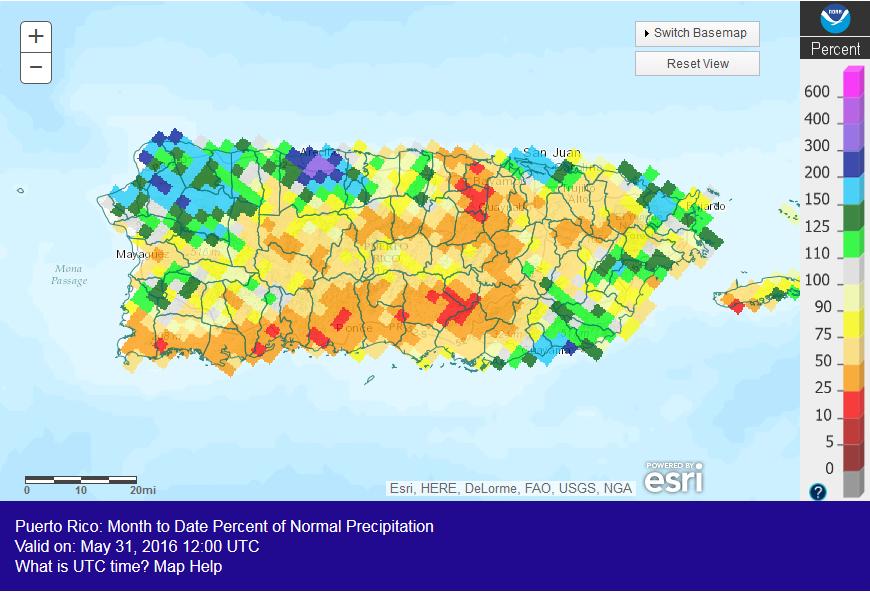
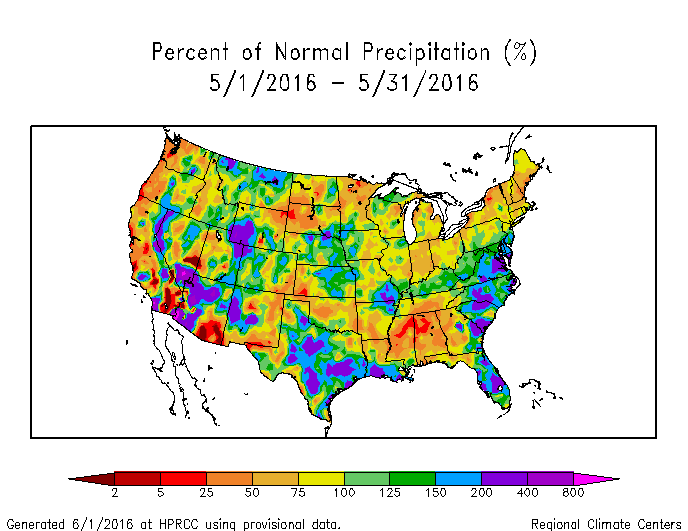 Map of monthly precipitation anomalies. May 2016 had wetter-than-normal areas in Alaska, Hawaii, the western CONUS, Plains, and coastal Southeast to Mid-Atlantic regions. It was drier than normal along the West Coast and other parts of the West; much of Puerto Rico, the Deep South, and Northeast; and parts of the Plains, Midwest, and Alaska. |
Northern Hemisphere monthly upper-level circulation pattern and anomalies.
Atmospheric Drivers
Subtropical highs, and fronts and low pressure systems moving in the mid-latitude storm track flow, are influenced by the broadscale atmospheric circulation. The circulation of the atmosphere can be analyzed and categorized into specific patterns. The Tropics, especially the equatorial Pacific Ocean, provides abundant heat energy which largely drives the world's atmospheric and oceanic circulation. The following describes several of these modes or patterns of the atmospheric circulation, their drivers, the temperature and precipitation patterns (or teleconnections) associated with them, and their index values this month:
-
El Niño Southern Oscillation (ENSO)
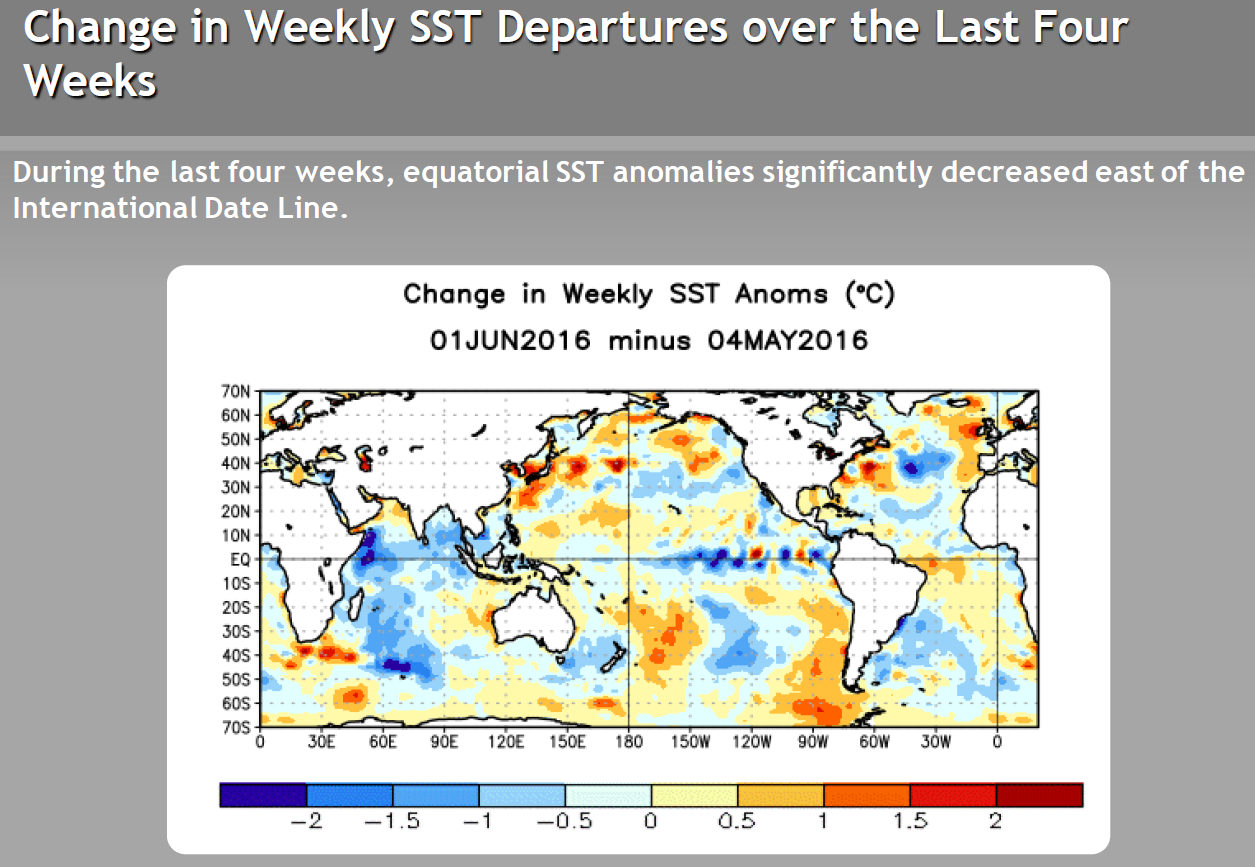
- Description: Oceanic and atmospheric conditions in the tropical Pacific Ocean can influence weather across the globe. ENSO is characterized by two extreme modes: El Niño (warmer-than-normal sea surface temperature [SST] anomalies in the tropical Pacific) and La Niña (cooler-than-normal SST anomalies), with the absence of either of these modes termed "ENSO-neutral" conditions.
- Status: During May 2016, El Niño conditions dissipated and ENSO-neutral conditions returned as above-average SSTs continued across only the western equatorial Pacific and SSTs were near zero across the central to eastern Pacific. Also, atmospheric anomalies over the tropical Pacific Ocean were also consistent with ENSO-neutral conditions.
- Teleconnections (influence on weather): The NWS CPC has no teleconnections for ENSO-neutral conditions.
- Comparison to Observed: However, the May 2016 precipitation anomaly pattern agrees in many parts of the country where teleconnections exist with an El Niño, except the Deep South and Central Plains. The temperature anomaly pattern agrees over much of the Southwest to Southern Plains but is opposite to that expected historically with an El Niño in the extreme Northern Plains to northern New England. The May temperature anomaly pattern does not agree with that expected for a La Niña, but the May precipitation anomaly pattern agrees in some areas.
-
Madden-Julian Oscillation (MJO)
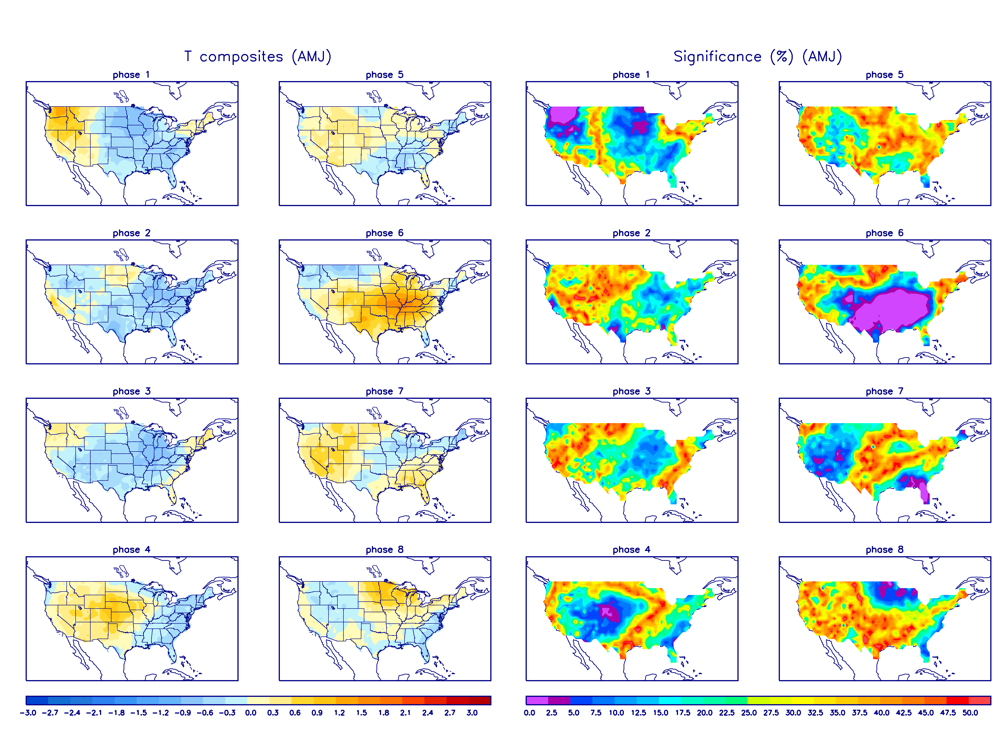
- Description: The MJO is a tropical disturbance or "wave" that propagates eastward around the global tropics with a cycle on the order of 30-60 days. It is characterized by regions of enhanced and suppressed tropical rainfall. One of its indices is a phase diagram which illustrates the phase (1-8) and amplitude of the MJO on a daily basis. The MJO is categorized into eight "phases" depending on the pattern of the location and intensity of the regions of enhanced and suppressed tropical rainfall. The MJO can enter periods of little or no activity, when it becomes neutral or incoherent and has little influence on the weather. Overall, the MJO tends to be most active during ENSO-neutral years, and is often absent during moderate-to-strong El Niño and La Niña episodes.
- Status: The MJO index began the month weakly in phase 2, transitioned into phases 3 and 4 during the month, then became incoherent during the last week of May. Other modes of coherent subseasonal tropical variability, including lingering effects from the dissipating background El Niño state and Rossby wave activity, influenced the tropical Pacific and global climate (MJO updates for May 9, 16, 23, and 30).
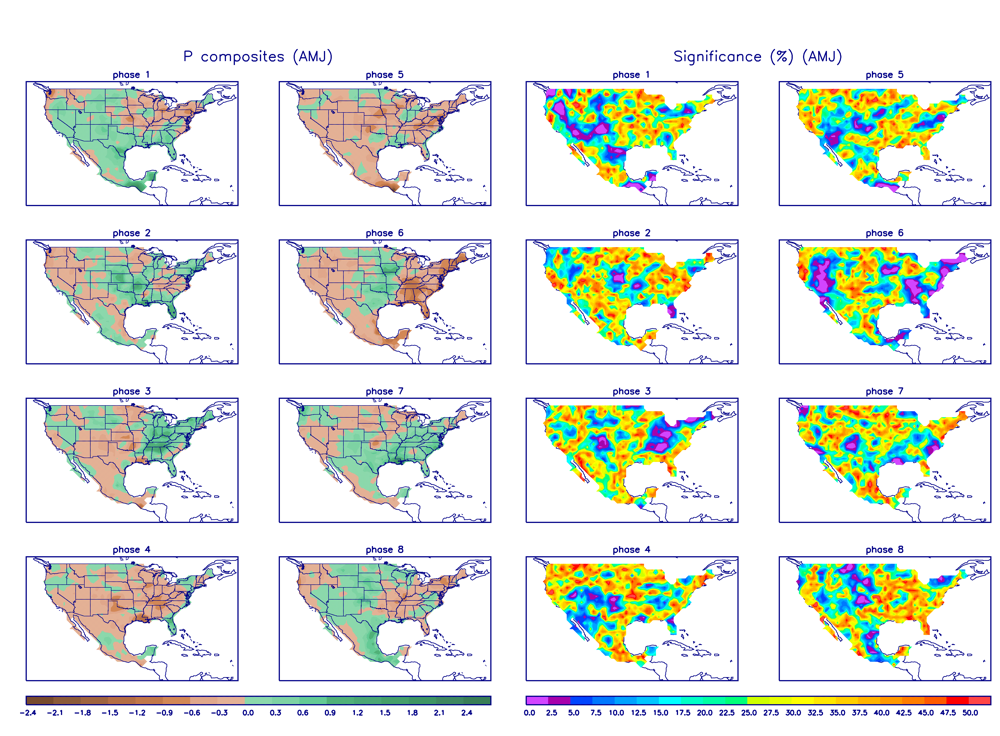
- Teleconnections (influence on weather): The MJO's temperature and precipitation teleconnections to U.S. weather depend on time of year and MJO phase. To the extent teleconnections are known, the May (April-June) teleconnections for temperature are shown here and for precipitation are shown here.
- Comparison to Observed: The MJO is transitory and can change phases (modes) within a month, so it is more closely related to weekly weather patterns than monthly. In the case of May 2016, the weekly temperature anomaly patterns don't match the teleconnections for the corresponding MJO phases, but the monthly temperature anomaly pattern does match the teleconnections for MJO phase 3. There is no agreement between the weekly precipitation anomaly patterns and the corresponding teleconnection patterns. The monthly precipitation pattern of patchy anomalies generally does not match the teleconnection patterns for phases 2-4.
- The Pacific/North American (PNA) pattern
- Description: The PNA teleconnection pattern is associated with strong fluctuations in the strength and location of the East Asian jet stream. PNA-related blocking of the jet stream flow in the Pacific can affect weather downstream over North America, especially the West and especially in the winter half of the year.
- Status: The daily PNA index began the month positive, then turned negative, then ended the month positive, averaging negative for the month as a whole. The 3-month-averaged index was near zero.
- Teleconnections (influence on weather): To the extent teleconnections are known, a negative PNA for this time of year (April on the teleconnection maps) is correlated with below-normal temperatures across Alaska and Canada extending into the Pacific Northwest; above-normal temperature anomalies from the southern Plains to Southeast;; above-normal precipitation in the western Great Lakes; below-normal precipitation in Colorado and Kansas; near-normal (low correlation) for the rest of the CONUS and Alaska; below-normal upper-level circulation anomalies over most of Canada and the northwestern CONUS; and above-normal circulation anomalies over the Southern Plains to East Coast and over the North Pacific.
- Comparison to Observed: The May 2016 temperature, precipitation, and upper-level circulation anomaly patterns are mostly opposite those expected with a negative PNA.
- The Arctic Oscillation (AO) pattern
- Description: The AO teleconnection pattern relates upper-level circulation over the Arctic to circulation features over the Northern Hemisphere mid-latitudes and is most active during the cold season.
- Status: The daily AO index oscillated between positive and negative throughout the month, averaging near zero for the month. The 3-month-averaged index was slightly negative.
- Teleconnections (influence on weather): To the extent teleconnections are known, a near-zero (neutral) AO in May (April-June) is typically associated with dry conditions from Texas to Mississippi; wet conditions in the Midwest; near-normal temperatures across most of the CONUS (little correlation); and upper-level circulation anomalies which are near normal across the Northern Hemisphere (i.e., no teleconnections).
- Comparison to Observed: The May 2016 monthly temperature, precipitation, and upper-level circulation anomaly patterns do not match those expected with a neutral AO.
- The North Atlantic Oscillation (NAO) pattern
- Description: The NAO teleconnection pattern relates upper-level circulation over the North Atlantic Ocean to circulation features over the Northern Hemisphere mid-latitudes.
- Status: The daily NAO index oscillated between near zero to slightly negative throughout the month, averaging negative for the month. The 3-month-averaged index was positive.
- Teleconnections (influence on weather): To the extent teleconnections are known, a negative NAO during May (April on the teleconnection maps) is associated with below-normal temperature and upper-level circulation anomalies over most of the CONUS. The precipitation teleconnections are very weak, with wetter-than-normal anomalies in northern California to Nevada, the Central Plains, and Southeast.
- Comparison to Observed: The May 2016 temperature and upper-level circulation anomaly patterns agree with those expected with a negative NAO across most of the CONUS. In fact, the upper-level circulation anomaly pattern agrees across the North Atlantic and Greenland where the strongest teleconnections exist. The precipitation anomaly pattern has few teleconnections, but they agree in the Central Plains and along the coastal Southeast.
- The West Pacific (WP) pattern
- Description: The WP teleconnection pattern is a primary mode of low-frequency variability over the North Pacific and reflects zonal and meridional variations in the location and intensity of the (East Asian) jet stream in the western Pacific.
- Status: The monthly WP index was positive while the three-month average WP index was near zero.
- Teleconnections (influence on weather): To the extent teleconnections are known, a positive WP during May (April on the maps) is typically associated with below-normal temperatures in the Southwest; above-normal temperatures from the Mid-Mississippi Valley to northwest Canada; below-normal precipitation in Washington (although there are few other teleconnections); below-normal circulation anomalies over the Southwest; and above-normal circulation anomalies over the Northern Plains into southwest Canada.
- Comparison to Observed: The May 2016 monthly temperature and upper-level circulation anomaly patterns generally agree with those expected with a positive WP where teleconnections exist, especially in the Southwest and Northern Plains. The precipitation anomaly pattern has few teleconnections, but agrees where the teleconnections exist.
- The East Pacific-North Pacific (EP-NP) pattern
- Description: The EP-NP teleconnection pattern relates SST and upper-level circulation patterns (geopotential height anomalies) over the eastern and northern Pacific to temperature, precipitation, and circulation anomalies downstream over North America. Its influence during the winter is not as strong as during the other three seasons.
- Status: The colder-than-normal SST anomaly pattern in the north central portion of the North Pacific continued during May 2016, with some warming occurring along its eastern edge since April. The warmer-than-normal ring along its southern, eastern, and northeastern edges continued with some cooling in areas off the western North America coast. The cooler-than-normal SST anomalies in the north central North Pacific were roughly located beneath the stronger-than-normal Aleutian Low, and the warmer-than-normal SST anomalies along the North American coast roughly coincided with the upper-level ridging across the Pacific Northwest to western Canada and adjacent North Pacific. The May monthly EP-NP index was slightly positive and the 3-month running mean was positive.
- Teleconnections (influence on weather): To the extent teleconnections are known, a positive EP-NP index during May (April on the maps) is typically associated with cooler-than-normal temperatures across central to eastern Canada and across the CONUS east of the Rockies, and warmer-than-normal temperatures across Alaska and the extreme West Coast of the CONUS; above-normal upper-level circulation anomalies (stronger upper-level ridge) over Alaska to the western CONUS, and below-normal upper-level circulation anomalies (stronger upper-level trough) over eastern Canada and the adjacent CONUS. The precipitation teleconnections are weak but show little agreement where the teleconnections exist.
- Comparison to Observed: The May 2016 upper-level circulation anomaly pattern agrees with the teleconnections expected with a positive EP-NP over Alaska and western Canada, but not over the rest of North America. The temperature anomaly pattern agrees over the CONUS where teleconnections exist, but that may be a coincidence. The precipitation anomaly pattern shows little agreement to the few teleconnections to compare to.
Examination of the available circulation indices and their teleconnection patterns, and comparison to observed May 2016 temperature, precipitation, and circulation anomaly patterns, suggest that the weather over the CONUS in May reflected influences from Atlantic and Pacific atmospheric drivers. Energy can propagate through the atmosphere at long time scales. Frequently, after the initial trigger for an atmospheric anomaly has died down, the energy it generated will continue to move through the atmosphere for some time afterwards. Although the El Niño has dissipated, the atmosphere was still energetic with energy and moisture flowing through the mid-latitudes. This energy was reflected in a stronger-than-normal Aleutian Low over the north central North Pacific which was reflected by below-normal upper-level height anomalies in the area. The active Aleutian Low contributed to an active jet stream and numerous Pacific weather systems. These weather systems and their storm tracks gave above-normal precipitation to some parts of the CONUS that normally expect it during an El Niño. The May temperature anomaly pattern reflected a combination of the teleconnections associated with the NAO and WP, suggesting the combined influence of the drivers behind these indices. The AO and EP-NP indices were weak or near zero, and the MJO and PNA teleconnections showed little agreement with the May anomaly patterns, indicating those drivers had little influence on the monthly climate, or their influence was overwhelmed by the other drivers.
This month illustrates how the weather and climate anomaly patterns can reflect the combined influence of atmospheric drivers (or modes of atmospheric variability) from several regions — the Atlantic and North Pacific.