Note: This Synoptic Discussion describes recent weather events and climate anomalies in relation to the phenomena that cause the weather. These phenomena include the jet stream, fronts and low pressure systems that bring precipitation, high pressure systems that bring dry weather, and the mechanisms which control these features — such as El Niño, La Niña, and other oceanic and atmospheric drivers (PNA, NAO, AO, and others). The report may contain more technical language than other components of the State of the Climate series.
Summary
August 2015 was characterized by an active upper-level circulation pattern over the contiguous United States (CONUS), with several troughs and ridges moving in the jet stream flow. El Niño-enhanced convection triggered tropical cyclones over the eastern equatorial Pacific, but the circulation pattern prevented much of this moisture from entering the Southwest. Several tropical systems developed in the Atlantic, but El Niño-enhanced shear inhibited their progress as they approached the Caribbean. Fronts and weather systems moving in the jet stream flow brought areas of above-normal precipitation to parts of the CONUS, along with below-normal temperatures east of the Rockies, but most areas in the CONUS were drier than normal. Warmer- and generally drier-than-normal weather dominated much of the West, where numerous large wildfires became widespread. High pressure ridging, which inhibited the development of rain-producing systems, also inhibited the occurrence of severe weather, with a smaller-than-average number of tornadoes reported. As a result, drought expanded or intensified across the CONUS and in Puerto Rico, but contracted slightly in Alaska and Hawaii where precipitation was above normal. Nationwide, the month was drier and warmer than normal. The upper-level circulation, temperature, and precipitation anomaly patterns suggest that the weather and climate of August 2015 were the result of influences from multiple atmospheric drivers originating over the North Atlantic and Arctic oceans, with the El Niño playing an important role. See below for details.
Synoptic Discussion
 |
 |
In the Northern Hemisphere, August is near the end of climatological summer, which is the time of year when solar heating forces the jet stream and circumpolar vortex to contract poleward. Polar air masses can still influence the weather, but they are not as cold as in cold-season months. The warm, dry subtropical high pressure belt normally dominates the weather as it shifts northward, with warm southerly air masses moving into the contiguous United States (CONUS) more frequently.
During August 2015, the North Pacific and North Atlantic subtropical high pressure centers extended across the southern half of the CONUS, but their influence was tempered by an active upper-level circulation. Several short-wave troughs and ridges migrated through the jet stream flow on a daily basis, while long-wave troughs and ridges also migrated through at a longer, roughly weekly, time scale. Warmer-than-normal air masses accompanied the upper-level ridges, while cold fronts and low pressure systems were dragged along at the surface by the upper-level troughs, bringing areas of precipitation and cooler-than-normal air. This competition between the North Atlantic (also known as the Bermuda High) and North Pacific High pressure centers in the south and the jet stream and its troughs and ridges in the north kept most anomalous weather patterns from becoming fixed and widespread.
The oceanic and atmospheric conditions associated with El Niño enhanced tropical cyclone activity in the eastern and central equatorial Pacific Ocean, while inhibiting tropical cyclones in the Atlantic and Caribbean. Five hurricanes (Guillermo, Hilda, Ignacio, Jimena, Kilo) formed off the coast of Mexico and moved toward Hawaii during August, with the steering currents in the atmosphere generally deflecting their moisture away from the western CONUS. Meanwhile, four systems (Tropical Storm Molave, Hurricane Loke, and Typhoons Atsani and Goni) threatened the tropical islands in the central Pacific. In the Atlantic, Hurricane Danny was severely weakened by El Niño-related vertical wind shear and dry mid-tropospheric air by the time it reached the Caribbean. Tropical Storm Erika survived the regions of vertical shear, but did not bring enough rain to Puerto Rico to have much effect on the drought there.
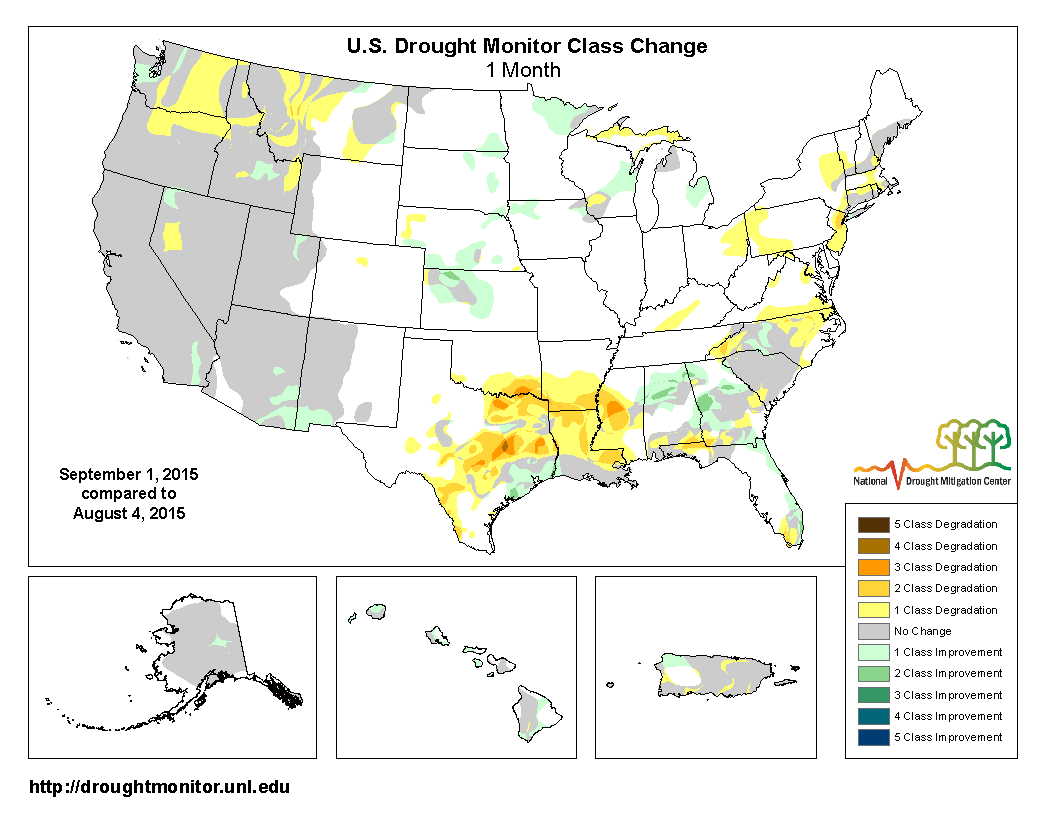
With the dominance of subtropical high pressure systems, and lack of tropical cyclone rainfall, the Southern Plains to Southeast were generally warmer- and drier-than-normal for the month. Drought and abnormal dryness rapidly expanded in the Southern Plains to Lower Mississippi Valley. Above-normal precipitation fell with showers and thunderstorms along frontal boundaries from the Northern Plains to parts of the Southeast, bringing localized relief from drought. The cool fronts also brought below-normal monthly temperatures to a large area from the Central and Northern Plains to the Mid-Atlantic Coast. But with the subtropical highs cutting off their Gulf of Mexico moisture source, these cool air masses were dry, so August averaged drier than normal for much of the Ohio Valley, Mid-Atlantic, and Northeast regions where drought and abnormal dryness expanded or developed.
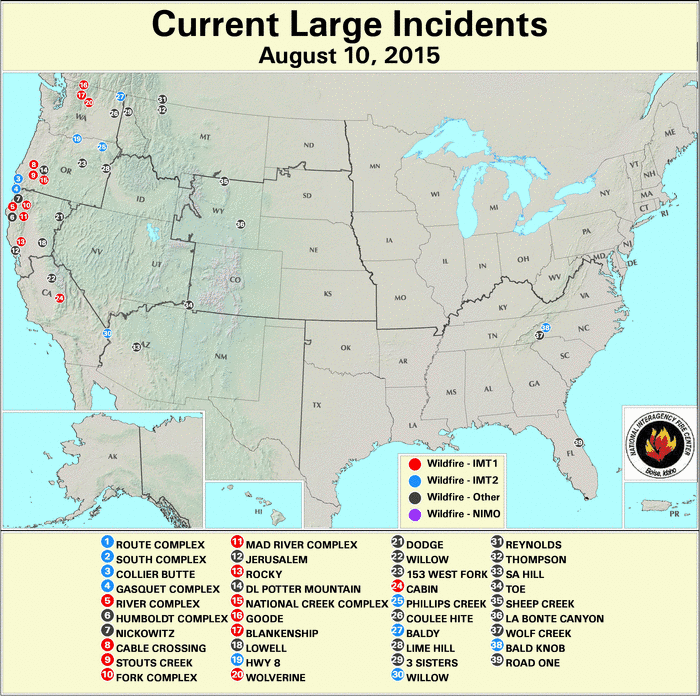
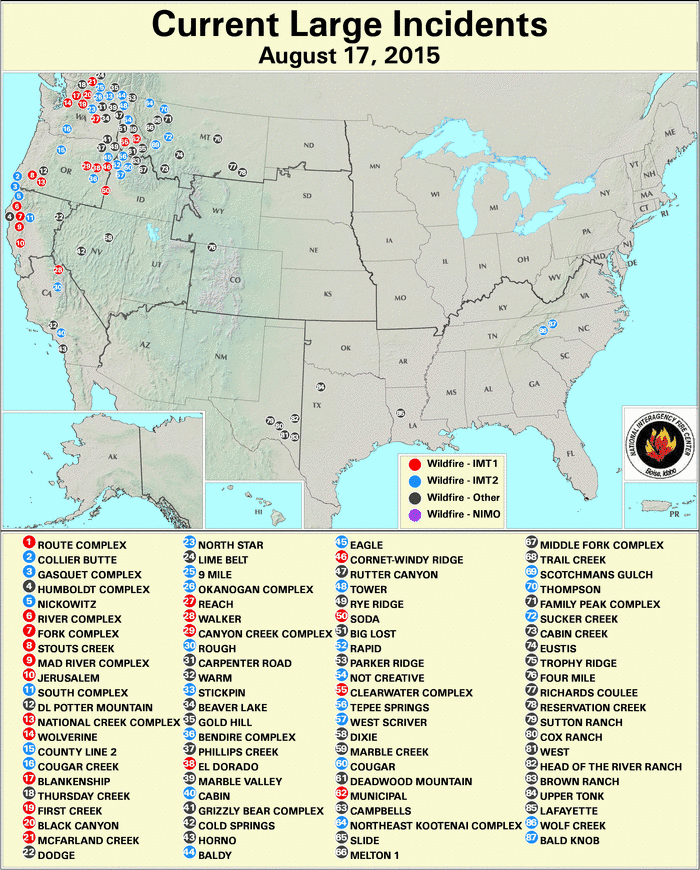
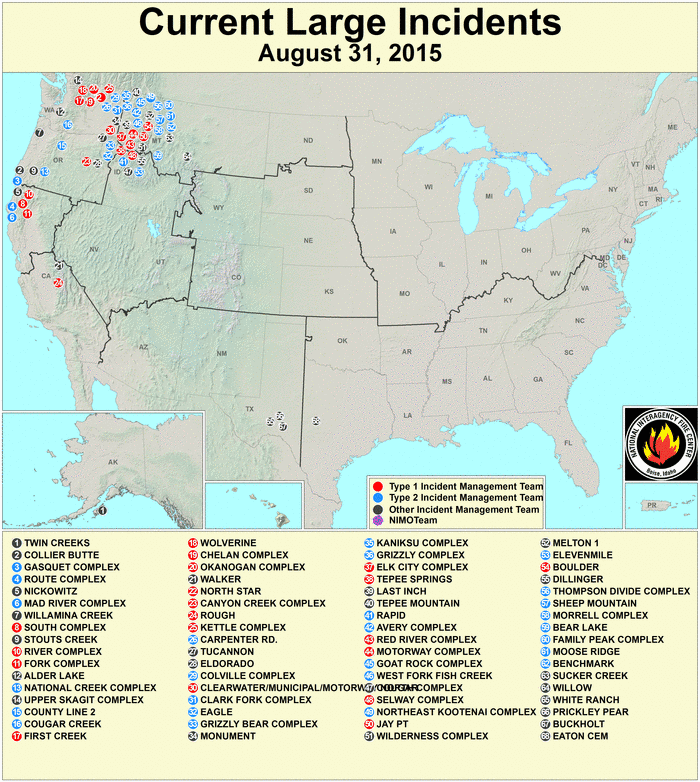
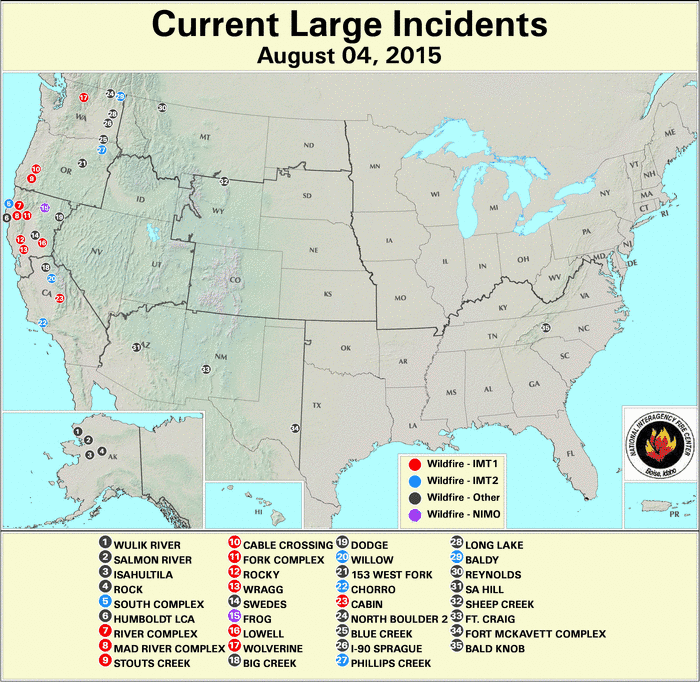
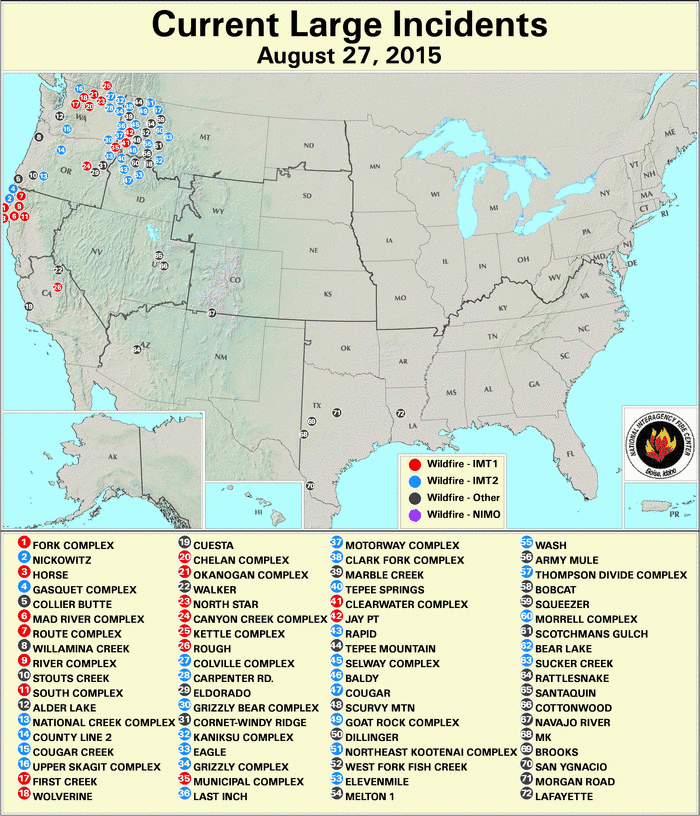
The generally warmer-than-normal and snow-less winter and spring along the West Coast and in the Pacific Northwest set the stage for an active summer wildfire season. With persistently warmer- (weeks 1, 2, 3, 4) and drier- (weeks 1, 2, 3, 4) than-normal weather during August, and windy conditions brought by the passage of generally dry troughs and cold fronts, numerous large wildfires developed and became widespread, especially in the Northwest (maps for August 4, 10, 17, 27, 31). The warm and dry weather intensified and expanded drought in the Pacific Northwest and into the High Plains of Montana.
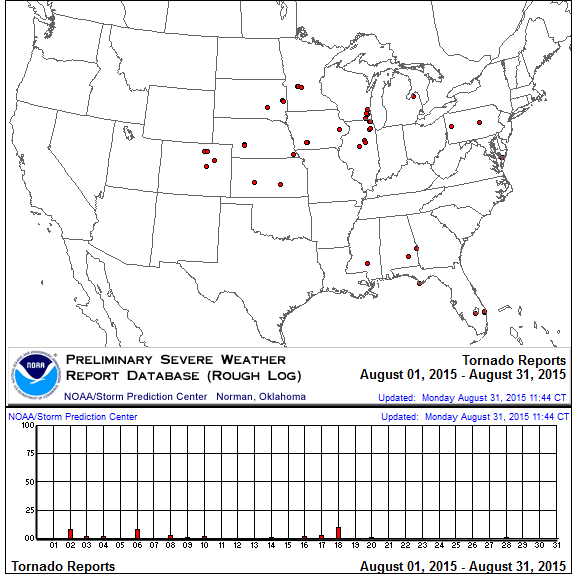
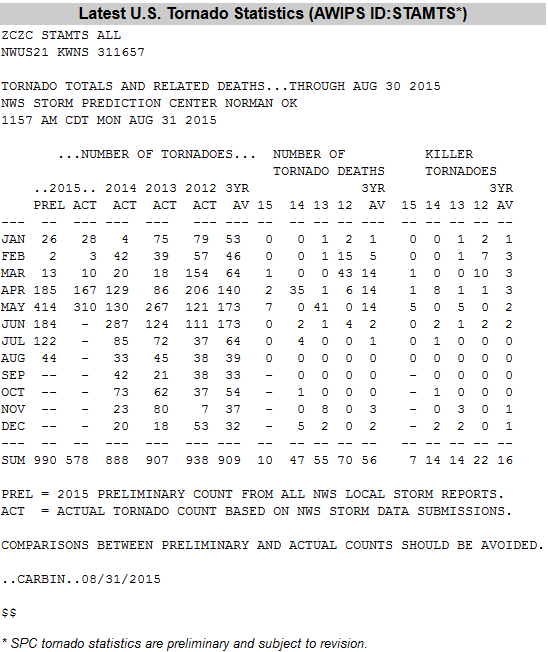
With subsiding air associated with the subtropical highs generally inhibiting convection and frontal rains in the southern CONUS, showers and thunderstorms were more localized and severe weather was reduced. Several tornadoes were triggered along the storm track from the Central Plains to Midwest, but only 44 tornadoes occurred nationwide (according to preliminary reports), which is well below the August average of 83.
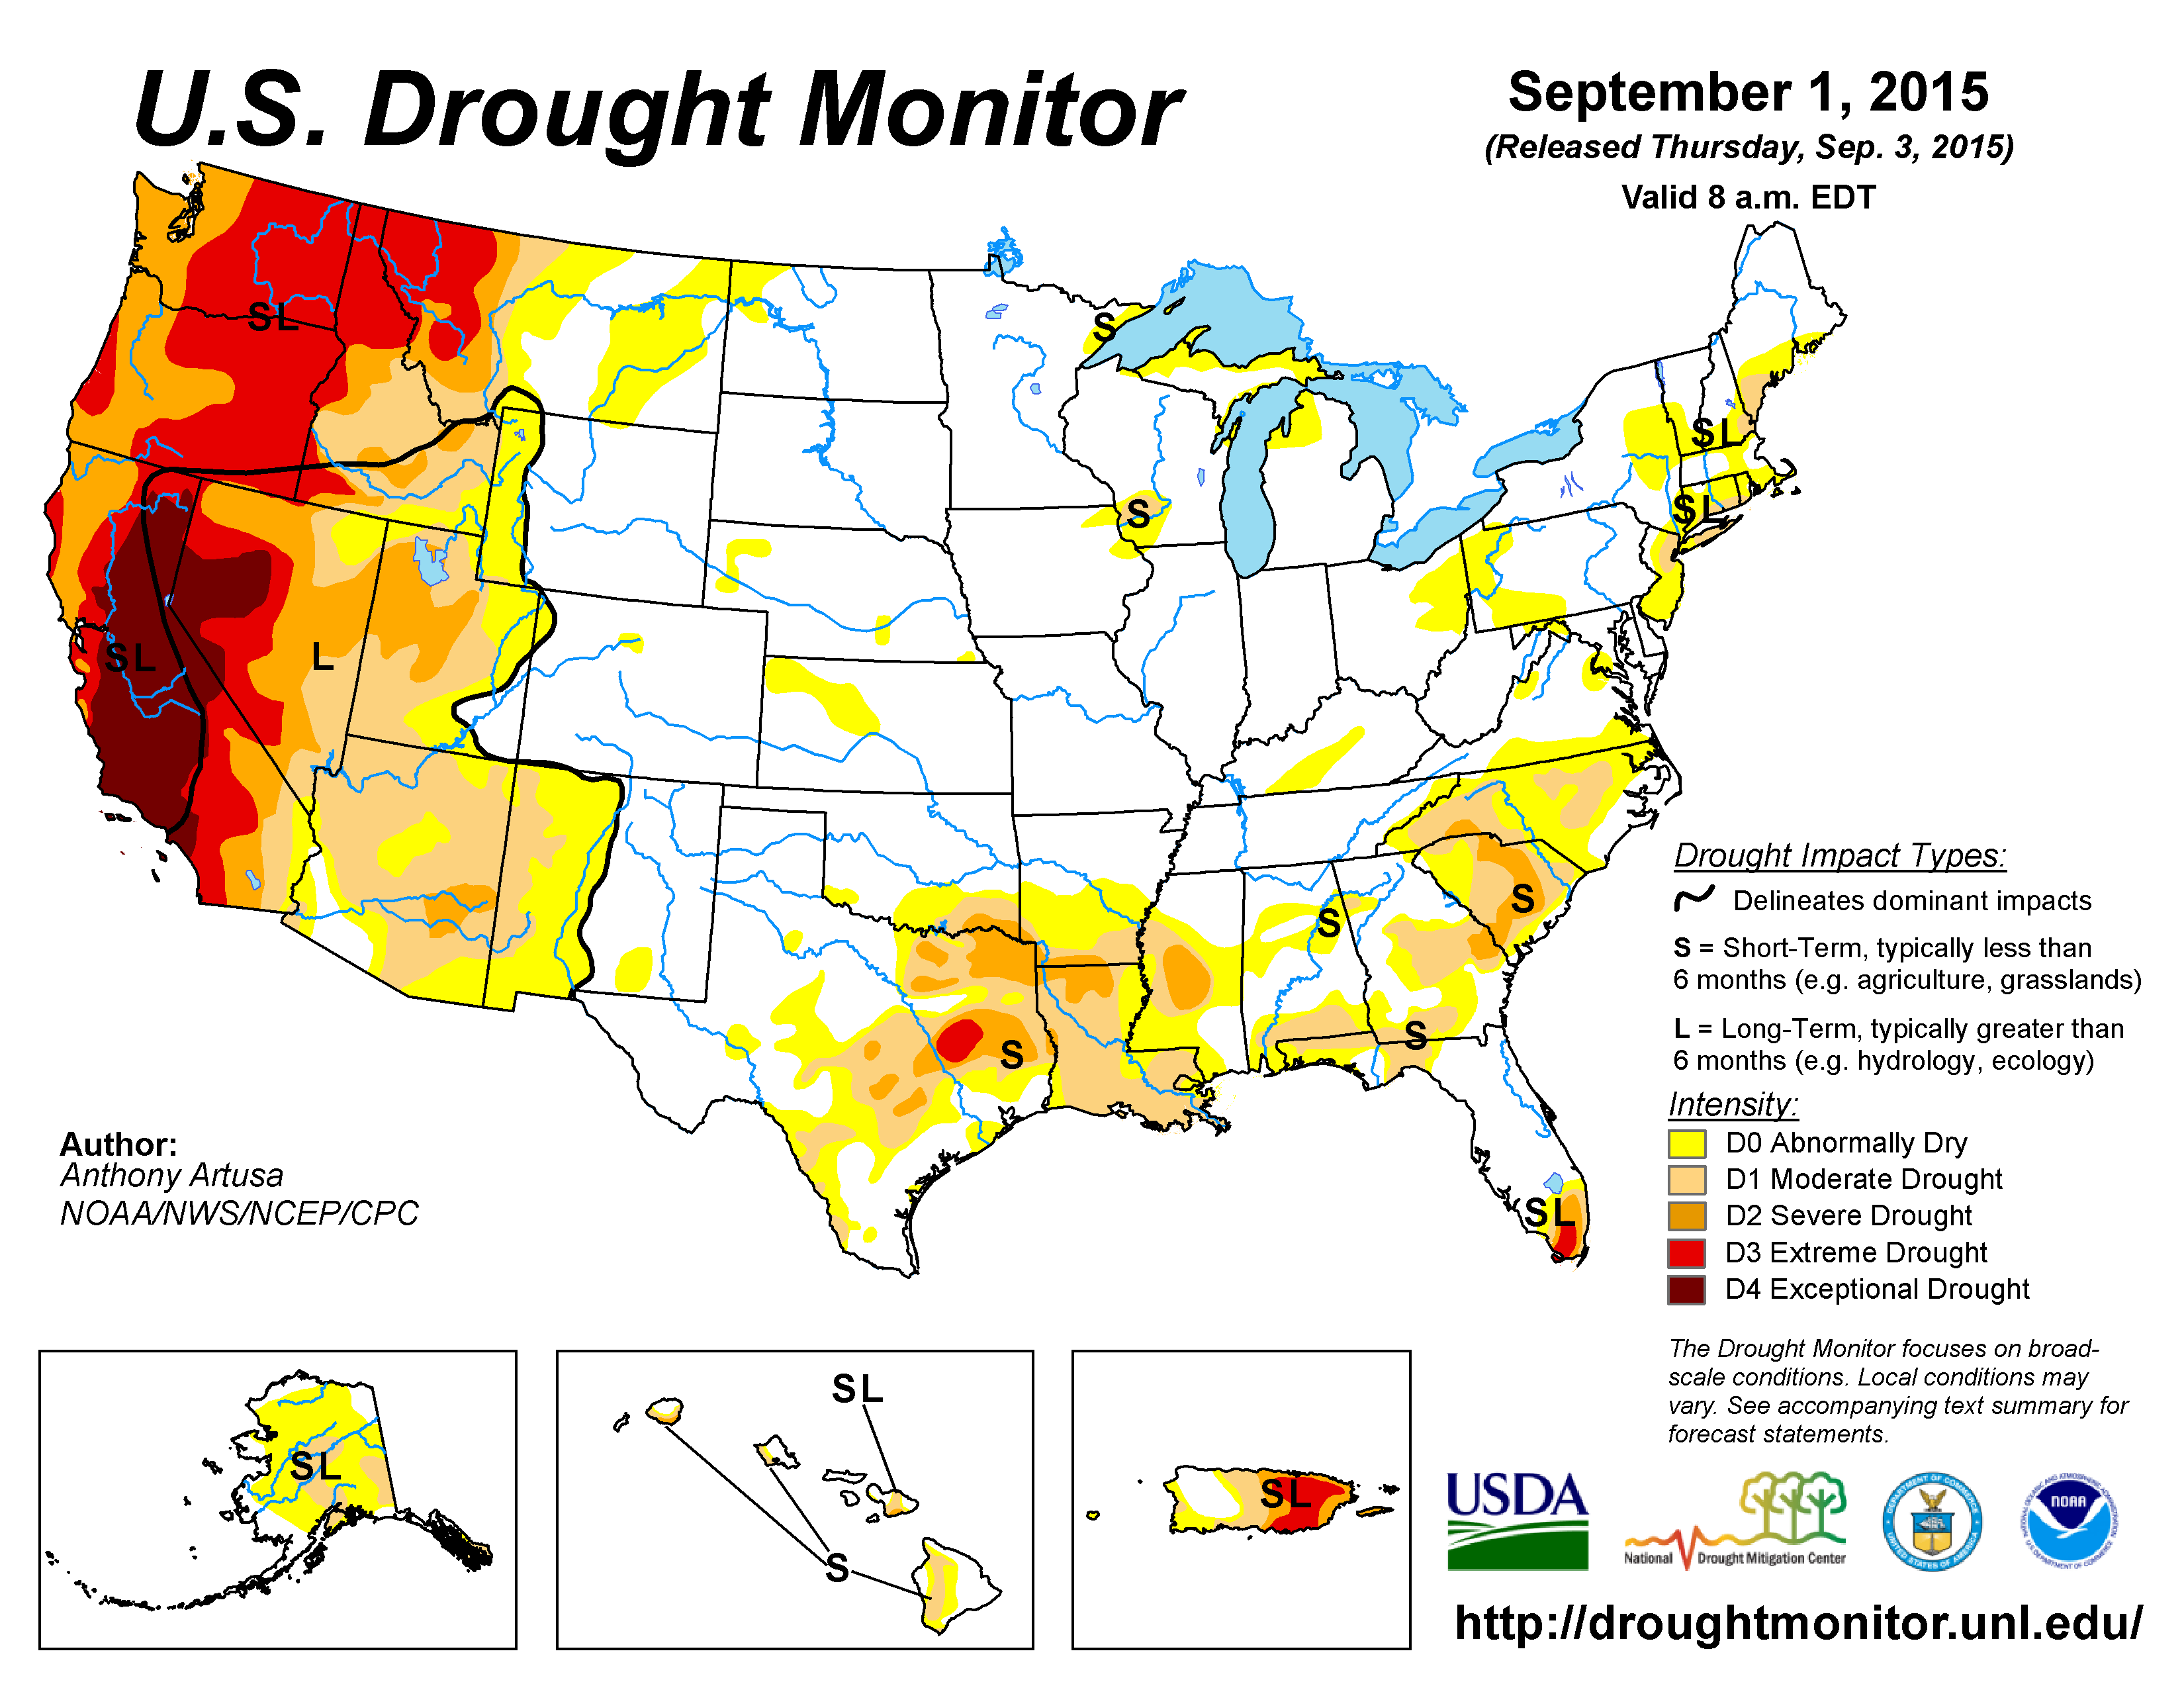
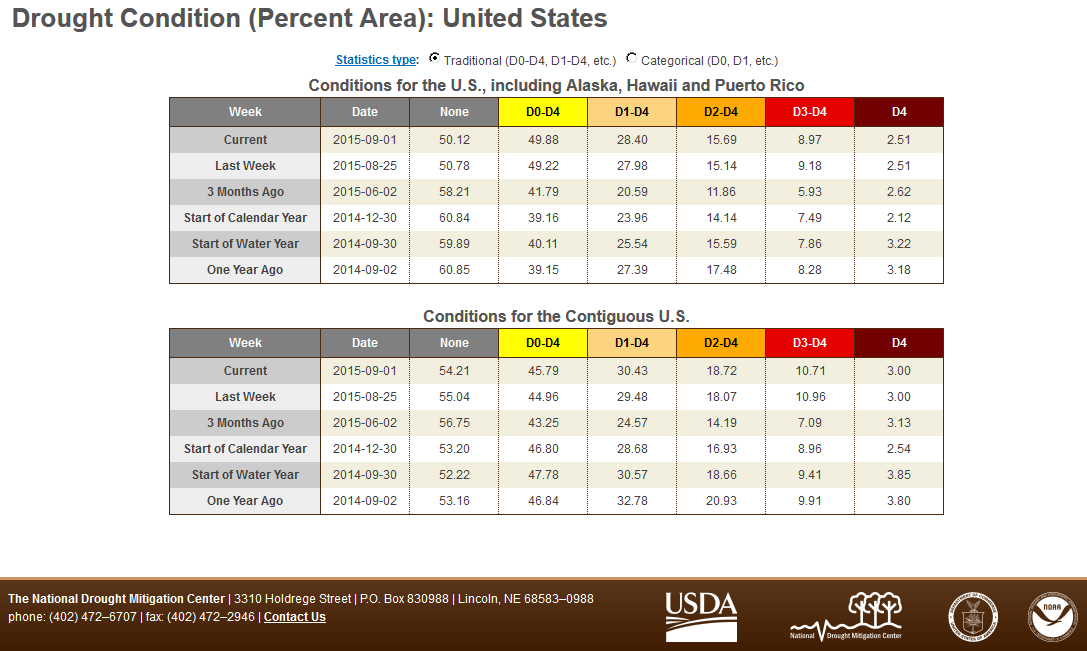
When the regional variations of temperature and precipitation anomalies are averaged together across the CONUS, August 2015 ranked as the 28th driest and 31st warmest August in the 121-year record. The rain mostly fell in areas that were not in drought, so the national drought footprint expanded, with 30.4 percent of the CONUS experiencing moderate to exceptional drought at the end of August, compared to 27.1 percent at the end of July. Record warmth won out over record cold temperatures. By the end of the month, there were 3,675 record warm daily high (1,442) and low (2,233) temperature records, which is about two and a half times the 1,498 record cold daily high (985) and low (513) temperature records. The REDTI (Residential Energy Demand Temperature Index) for August 2015 ranked 25th highest for August, illustrating how the unusually cool temperatures in the heavily-populated areas of the Midwest decreased cooling demands, tempering the effects of the well-above-normal temperatures in the West, Northeast, and Gulf of Mexico coast.
 North America monthly upper-level circulation pattern and anomalies. The movement of troughs and ridges in the jet stream flow and their interaction with the North Pacific and North Atlantic subtropical highs resulted in a 500-mb height anomaly pattern for the month that was mostly flat across the CONUS, with few areas of significantly above- or below-normal anomalies. There was a small area of positive 500-mb height anomalies over the southwestern CONUS and northwest Mexico, and a small area of negative anomalies over the Great Lakes. But significant anomalies occurred within the month. During the first ten days of August, above-normal 500-mb heights from the subtropical highs are evident over the Southern Plains, with the associated hot and dry weather, while below-normal heights from upper-level troughs characterized the Southwest and adjacent Pacific Ocean, as well as the Northeast and southeastern Canada. During August 11-15, the subtropical highs and ridging in the jet stream flow resulted in above-normal heights dominating much of the country, with warmer- and drier-than-normal weather. As the troughs and ridges migrated through the jet stream flow, the 500-mb anomaly pattern for August 17-20 flipped so that below-normal height anomalies dominated the central part of the country, bringing cooler- and wetter-than-normal weather to the central CONUS. The jet stream flow shifted to a long-wave ridge/trough pattern during August 23-28. Above-normal 500-mb heights and warmer-than-normal weather blanketed the West, while below-normal 500-mb heights and cooler-than-normal weather held sway east of the Rockies. This ridge west/trough east circulation pattern blocked moisture sources and inhibited precipitation, so the week was drier than normal across most of the country. The monthly 500-mb height anomaly pattern was more pronounced at higher latitudes. Southwestern Alaska was dominated by above-normal heights with warmer- and drier-than-normal weather, while areas further east were dominated by the opposite conditions. |
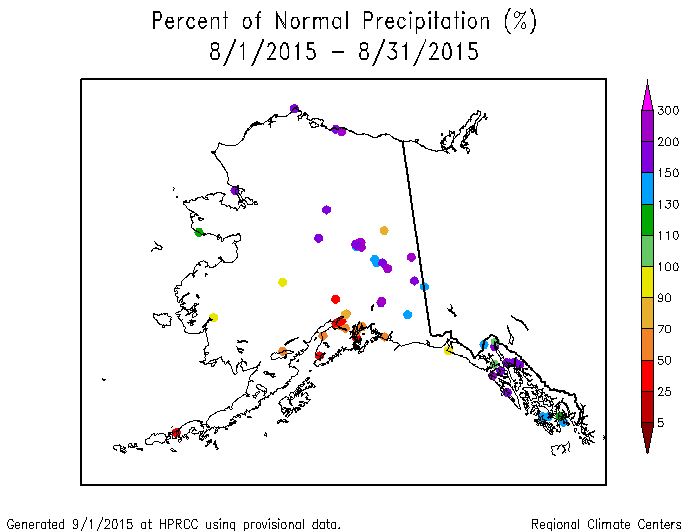
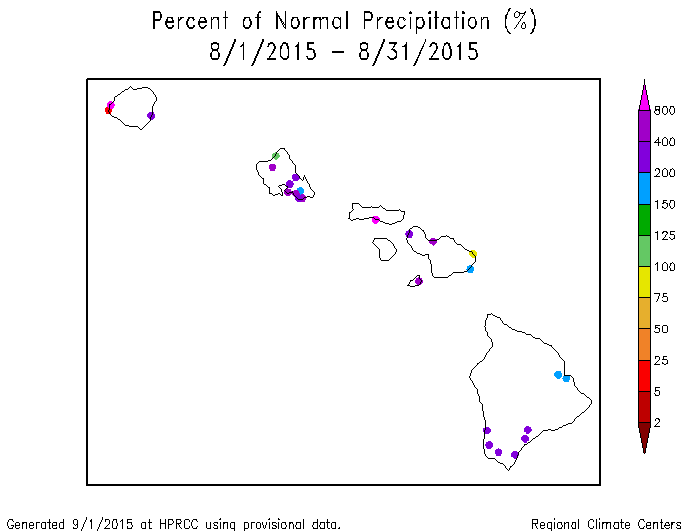
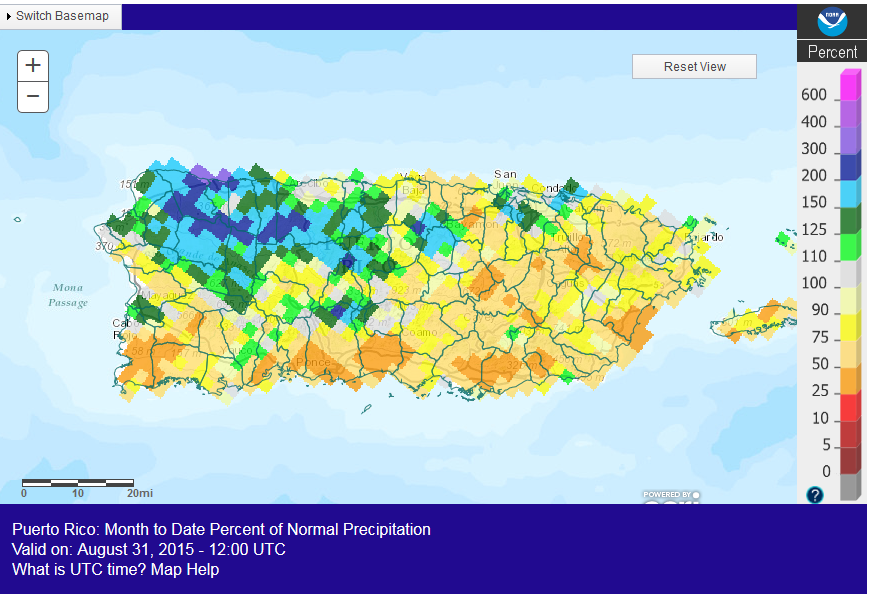
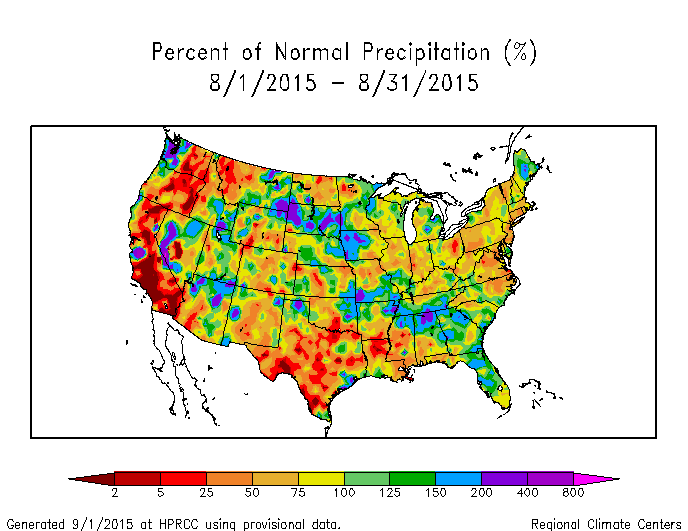 Map of monthly precipitation anomalies. There were a few areas of above-normal precipitation in the West, Central and Northern Plains, and Southeast, but the August precipitation pattern was generally drier than normal for much of the CONUS. The south central and southwest portions of Alaska were drier than normal, but the rest of the state was generally wetter than normal. Most of the stations in the Hawaiian Islands were wetter than normal. An El Niño-enhanced dry spell continued to afflict much of the Caribbean. Puerto Rico was generally drier than normal, in spite of the rains from Tropical Storm Erika, except in the northwest where it was wetter than normal. |
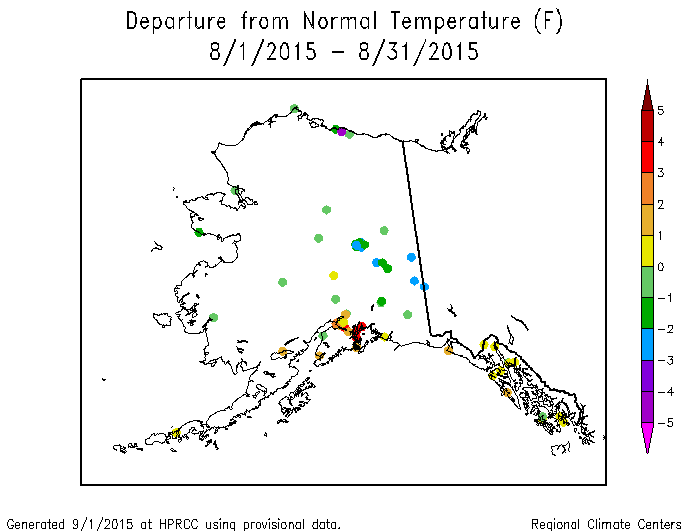
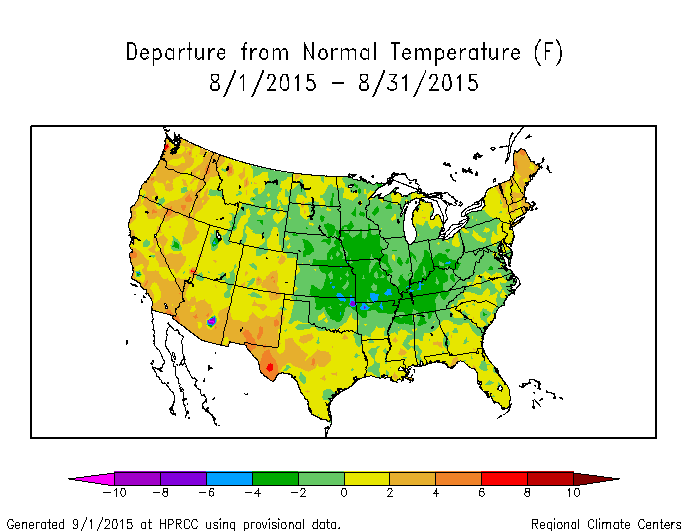 Map of monthly temperature anomalies. August 2015 averaged cooler than normal from the Central and Northern Plains to the Mid-Atlantic Coast, and warmer than normal in the West, New England, and along the Gulf of Mexico coastal states. Alaska was cooler than normal, except along the southern coast where stations were warmer than normal. |
Northern Hemisphere monthly upper-level circulation pattern and anomalies.
Atmospheric Drivers
Subtropical highs, and fronts and low pressure systems moving in the mid-latitude storm track flow, are influenced by the broadscale atmospheric circulation. The circulation of the atmosphere can be analyzed and categorized into specific patterns. The Tropics, especially the equatorial Pacific Ocean, provides abundant heat energy which largely drives the world's atmospheric and oceanic circulation. The following describes several of these modes or patterns of the atmospheric circulation, their drivers, the temperature and precipitation patterns (or teleconnections) associated with them, and their index values this month:
-
El Niño Southern Oscillation (ENSO)
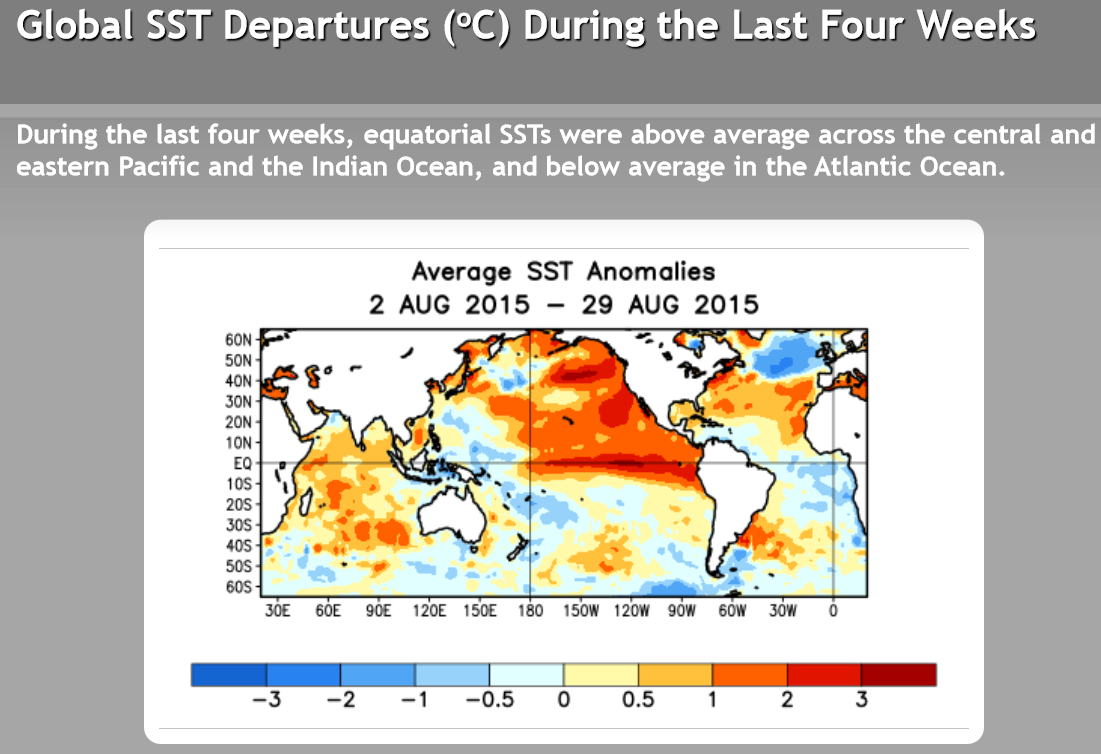
- Description: Oceanic and atmospheric conditions in the tropical Pacific Ocean can influence weather across the globe. ENSO is characterized by two extreme modes: El Niño (warmer-than-normal sea surface temperature [SST] anomalies in the tropical Pacific) and La Niña (cooler-than-normal SST anomalies), with the absence of either of these modes termed "ENSO-neutral" conditions.
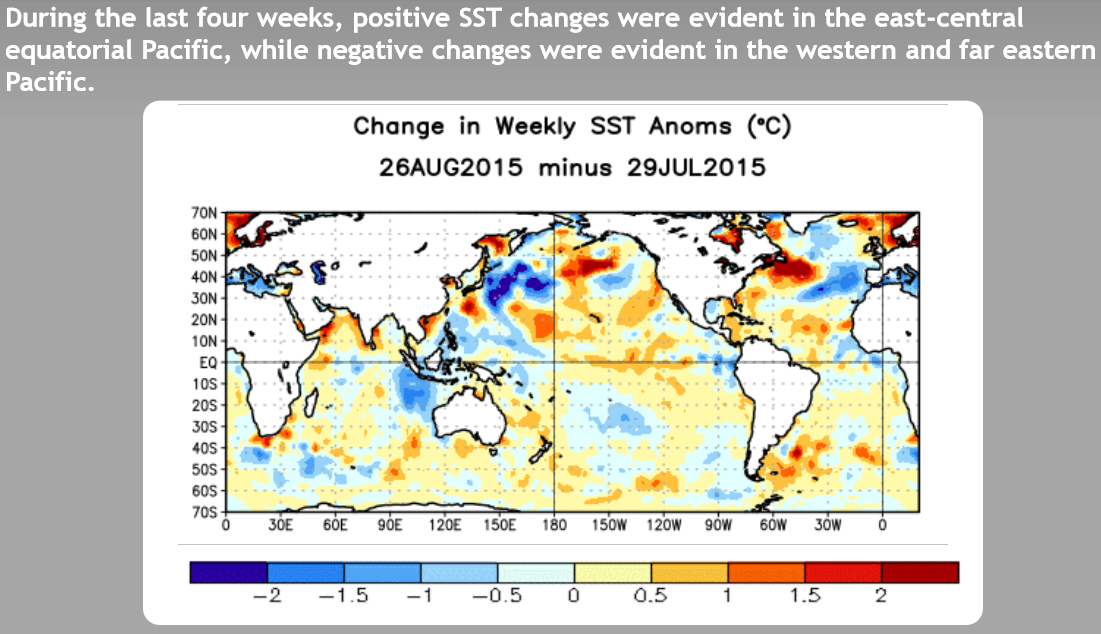
- Status: During August 2015, El Niño conditions were observed as above-average SSTs continued across the western and central equatorial Pacific and continued to be coupled to the tropical atmosphere. Collectively, the atmospheric and oceanic features reflected an ongoing and strengthening El Niño.
- Teleconnections (influence on weather): To the extent teleconnections are known, the typical temperature and precipitation patterns associated with El Niño during August include above-normal precipitation in the Northern Plains and Maine; below-normal precipitation across the Mid-Atlantic region, Ohio Valley, and Southern Plains, and most of the Northeast and Southeast; and below-normal temperatures across much of the West and Northern Tier States, although there is a trend toward warmer-than-normal temperatures for much of the CONUS.
- Comparison to Observed: The August 2015 precipitation anomaly pattern is a very good match with that expected historically with an El Niño, but the temperature anomaly pattern does not match.
-
Madden-Julian Oscillation (MJO)
- Description: The MJO is a tropical disturbance or "wave" that propagates eastward around the global tropics with a cycle on the order of 30-60 days. It is characterized by regions of enhanced and suppressed tropical rainfall. One of its indices is a phase diagram which illustrates the phase (1-8) and amplitude of the MJO on a daily basis. The MJO is categorized into eight "phases" depending on the pattern of the location and intensity of the regions of enhanced and suppressed tropical rainfall. The MJO can enter periods of little or no activity, when it becomes neutral or incoherent and has little influence on the weather. Overall, the MJO tends to be most active during ENSO-neutral years, and is often absent during moderate-to-strong El Niño and La Niña episodes.
- Status: The MJO index stayed inside the center circle for most of August, indicating an incoherent signal. Other modes of coherent subseasonal tropical variability, including the background El Niño state, tropical cyclone activity, and Kelvin and Rossby waves, influenced the tropical Pacific and global climate (MJO updates for August 3, 10, 17, 24, and 31).
- Teleconnections (influence on weather): There are no teleconnections for an incoherent MJO.
- The Pacific/North American (PNA) pattern
- Description: The PNA teleconnection pattern is associated with strong fluctuations in the strength and location of the East Asian jet stream. PNA-related blocking of the jet stream flow in the Pacific can affect weather downstream over North America, especially the West and especially in the winter half of the year.
- Status: The daily PNA index began the month began the month slightly negative and ended slightly positive, was neutral (near zero) for most of the month, and averaged near zero (neutral) for the month as a whole. The 3-month-averaged index was near zero to slightly positive.
- Teleconnections (influence on weather): To the extent teleconnections are known, the temperature and upper-level circulation anomaly teleconnection maps for this time of year (July on the teleconnection maps) show little correlation to the PNA during the summer over North America. Likewise for precipitation, although there is a weak signal of positive correlations from Montana to Texas and negative correlations over the Great Lakes.
- Comparison to Observed: Because there is little correlation during the summer, the August 2015 temperature and upper-level circulation anomaly patterns have nothing to compare to, even if the PNA index were not neutral. The August 2015 precipitation anomaly pattern does not agree where correlations exist.
- The Arctic Oscillation (AO) pattern
- Description: The AO teleconnection pattern relates upper-level circulation over the Arctic to circulation features over the Northern Hemisphere mid-latitudes and is most active during the cold season.
- Status: The daily AO index was mostly negative throughout the month, averaging negative for the month. The 3-month-averaged index was also negative.
- Teleconnections (influence on weather): To the extent teleconnections are known, a negative AO this time of year (July-September) is typically associated with dry conditions in the Southern Plains and Northeast; wet conditions in parts of the Central Plains; below-normal temperatures across parts of the Northern Plains; above-normal temperatures in part of Texas; and upper-level circulation anomalies which are below normal in the North Central Pacific, eastern Canada, and across the North Atlantic, and above normal over the Arctic Ocean and Greenland, but which snow no correlation over the CONUS or Alaska. For temperature and precipitation, most of the country has little correlation to the AO this time of year.
- Comparison to Observed: The August 2015 monthly temperature and precipitation anomaly patterns generally agree where there are teleconnections. The upper-level circulation anomaly pattern agrees over the Great Lakes and northern Canada, but not elsewhere.
- The North Atlantic Oscillation (NAO) pattern
- Description: The NAO teleconnection pattern relates upper-level circulation over the North Atlantic Ocean to circulation features over the Northern Hemisphere mid-latitudes.
- Status: The daily NAO index began the month negative, then turned positive, then negative again, averaging negative for the month. The 3-month-averaged index was also negative.
- Teleconnections (influence on weather): To the extent teleconnections are known, a negative NAO during this time of year (July on the teleconnection maps) is associated with drier-than-normal conditions in the Southern Plains to Lower Mississippi Valley, wetter-than-normal conditions in parts of the Northern Plains to Midwest (although the teleconnections are weak for precipitation); warmer-than-normal temperatures from the Southern Plains to Southeast, colder-than-normal temperatures in the Northern Plains extending into the Northern Rockies; positive upper-level circulation anomalies across the northeast North Pacific and Greenland, and negative upper-level circulation anomalies over the North Atlantic and along the U.S.-Canadian border.
- Comparison to Observed: The August 2015 temperature and precipitation anomaly patterns show good agreement with the teleconnections associated with a negative NAO where teleconnections exist, except the temperature anomalies are offset somewhat in the north. The monthly upper-level circulation anomaly pattern shows little agreement.
- The West Pacific (WP) pattern
- Description: The WP teleconnection pattern is a primary mode of low-frequency variability over the North Pacific and reflects zonal and meridional variations in the location and intensity of the (East Asian) jet stream in the western Pacific.
- Status: Both the monthly WP index and three-month average WP index were negative.
- Teleconnections (influence on weather): To the extent teleconnections are known, a negative WP during this time of year (July on the maps) is typically associated with above-normal temperatures in the Southwest, Great Lakes, Ohio Valley, and Northeast; above-normal circulation anomalies over the southwestern CONUS and eastern North America; and below-normal circulation anomalies over the western North Pacific and western Canada extending into the northeastern North Pacific. There are no significant precipitation teleconnections.
- Comparison to Observed: The August 2015 monthly temperature anomaly pattern generally agrees with that associated with a negative WP over the Southwest, but not over the eastern CONUS. The upper-level circulation anomaly pattern shows little agreement.
- The Pacific Transition (PT) pattern
- Description: The PT teleconnection pattern relates upper-level circulation over the central subtropical North Pacific to circulation features over North America. It is a significant factor in the earth's circulation during August and September.
- Status: The PT index was negative during August.
- Teleconnections (influence on weather): To the extent teleconnections are known, a negative PT is typically associated with colder-than-normal temperatures for the western CONUS and western Canada, warmer-than-normal temperatures for the eastern CONUS, and wetter-than-normal conditions in the Midwest, Alaska, and parts of the Pacific Northwest to Northern Plains. The upper-level circulation anomalies for a negative PT are above-normal 500-mb geopotential heights over the eastern third of the CONUS into the North Atlantic, above-normal heights over the northeastern Pacific (including the Gulf of Alaska), and below-normal heights over the western half of the CONUS into south central Canada.
- Observed: The August 2015 monthly temperature, precipitation, and upper-level circulation anomaly patterns show little to no agreement with a negative PT.
- The East Pacific-North Pacific (EP-NP) pattern
- Description: The EP-NP teleconnection pattern relates SST and upper-level circulation patterns (geopotential height anomalies) over the eastern and northern Pacific to temperature, precipitation, and circulation anomalies downstream over North America. Its influence during the winter is not as strong as during the other three seasons.
- Status: The August SST pattern showed widespread above-normal SSTs in the North Pacific from the International Dateline to North America and pockets of cooler-than-normal SSTs west of the Dateline. The northeastern North Pacific SSTs showed some areas of cooling this month and some areas of warming along the North American coast. The monthly EP-NP index was slightly negative during August, while the 3-month running mean was near zero.
- Teleconnections (influence on weather): To the extent teleconnections are known, a negative EP-NP index during this time of year (July on the maps) is typically associated with warmer-than-normal temperatures from the Central Rockies to the Central and Northern Plains and Great Lakes, cooler-than-normal temperatures across parts of Alaska, below-normal upper-level circulation anomalies (weaker upper-level ridge) over Alaska and western Canada, and above-normal upper-level circulation anomalies (weaker upper-level trough) over the north central CONUS, eastern Canada, and the central North Pacific. The precipitation teleconnections are too weak to be mapped in any detail.
- Comparison to Observed: The August 2015 temperature anomaly pattern shows little agreement to the teleconnections for a negative EP-NP. The upper-level circulation anomaly pattern shows no agreement over the CONUS, but appears offset over Canada and the North Pacific.
Examination of the available circulation indices and their teleconnection patterns, and comparison to observed August 2015 temperature, precipitation, and circulation anomaly patterns, suggest that the weather over the CONUS in August reflected influences from several atmospheric drivers. The MJO and PNA indices were near zero or neutral, indicating that their associated drivers had little effect on the weather in North America this month. The teleconnections associated with the WP, EP-NP, and PT indices showed little agreement with the observed circulation, temperature, and precipitation anomaly patterns, which suggested that these Pacific drivers also had little influence on North American weather. The AO and NAO showed reasonable agreement with the temperature and precipitation anomalies in the CONUS, indicating that they played a role in this month's weather, but they had little agreement with the upper-level circulation anomalies. The August precipitation anomaly pattern was a good match to the El Niño teleconnections in most areas, but the temperature anomaly pattern was not.
The El Niño created atmospheric and oceanic conditions that enhanced the development of tropical storms and hurricanes in the eastern and central tropical Pacific Ocean. Many of these tropical cyclones moved into the North Pacific, transferring energy into the mid-latitude circulation and mixing the waters at the sea surface. This energy was an added factor which apparently disrupted the circulation patterns usually associated with the other atmospheric drivers, while the influence of El Niño (through the tropical cyclones) on the North Pacific SSTs may be interfering with the influence of the EP-NP, PT, and WP.
This month illustrates how the weather and climate anomaly patterns can reflect the combined influence of several atmospheric drivers (or modes of atmospheric variability), but also how one driver can have a disruptive influence on the other drivers and contribute to a chaotic situation.