Note: This Synoptic Discussion describes recent weather events and climate anomalies in relation to the phenomena that cause the weather. These phenomena include the jet stream, fronts and low pressure systems that bring precipitation, high pressure systems that bring dry weather, and the mechanisms which control these features — such as El Niño, La Niña, and other oceanic and atmospheric drivers (PNA, NAO, AO, and others). The report may contain more technical language than other components of the State of the Climate series.
Summary
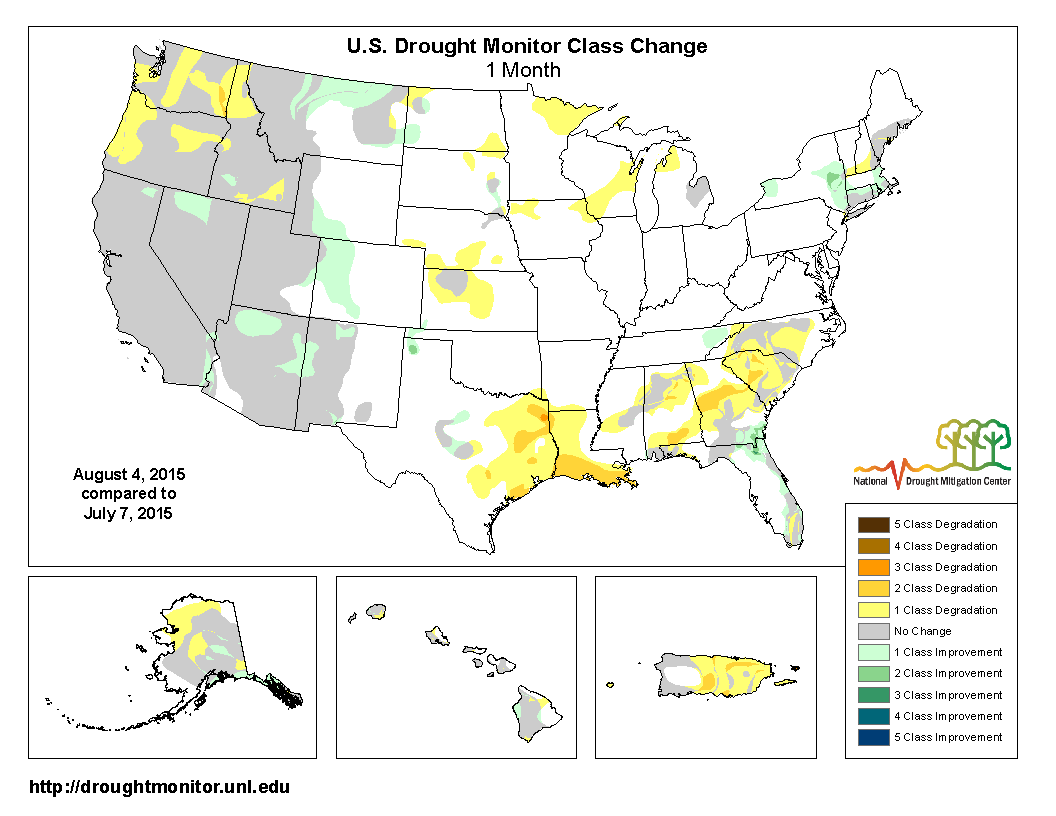
July 2015 was characterized by an active upper-level circulation pattern over the contiguous United States (CONUS), with several weather systems moving in the jet stream flow. Warmer- and drier-than-normal weather dominated the Pacific Northwest and the Southern Plains to Southeast. These regions fell under the influence of upper-level ridges caused by the North Pacific (in the Northwest) and North Atlantic (in the South) subtropical high pressure centers. El Niño-enhanced convection and tropical cyclones over the eastern equatorial Pacific funneled moisture into the Southwestern CONUS, contributing to above-normal precipitation and below-normal temperatures in between these high pressure centers. Cool fronts and low pressure systems, moving along the storm track east of the Rockies, brought above-normal precipitation and cooler-than-normal temperatures to much of the Central Plains to Appalachians. As a result, drought expanded in the Southeast and intensified in the Northwest. Nationwide, the month was wetter than normal with temperatures near average. Continued dryness (and heat in the Northwest) set the stage for numerous large wildfires in Alaska and the Pacific Northwest. The North Atlantic High inhibited severe weather in the South while El Niño inhibited the formation of Atlantic tropical cyclones. A near-average number of tornadoes occurred in July, mostly along the storm track east of the Rockies. The upper-level circulation, temperature, and precipitation anomaly patterns suggest that the weather and climate of July 2015 were the result of influences from multiple atmospheric drivers originating over the Tropical and North Pacific, North Atlantic, and Arctic oceans, with the El Niño playing a dominant role. See below for details.
Synoptic Discussion
 |
 |
In the Northern Hemisphere, July is in the heart of climatological summer, which is the time of year when solar heating forces the jet stream and circumpolar vortex to contract poleward. Polar air masses can still influence the weather, but they are not as cold as in previous months. The warm, dry subtropical high pressure belt normally dominates the weather as it shifts northward, with warm southerly air masses moving into the contiguous United States (CONUS) more frequently.
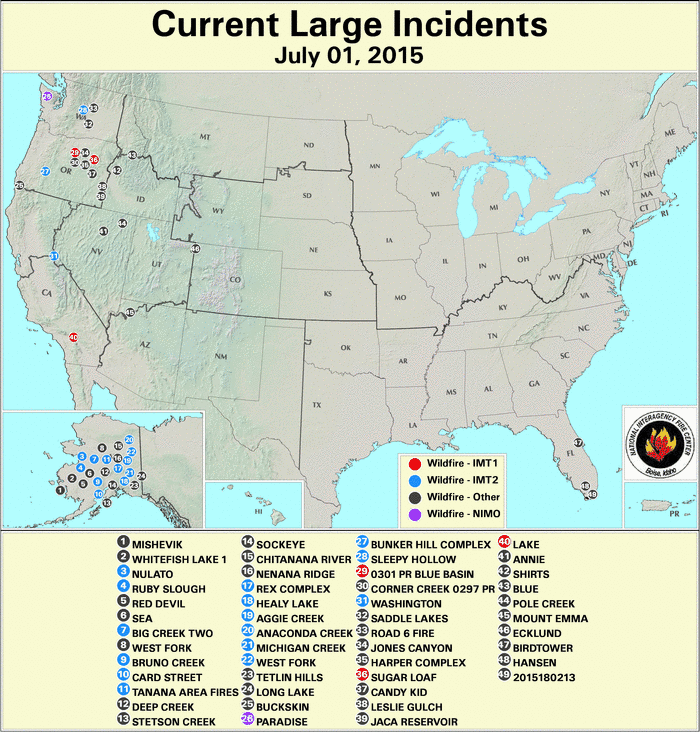
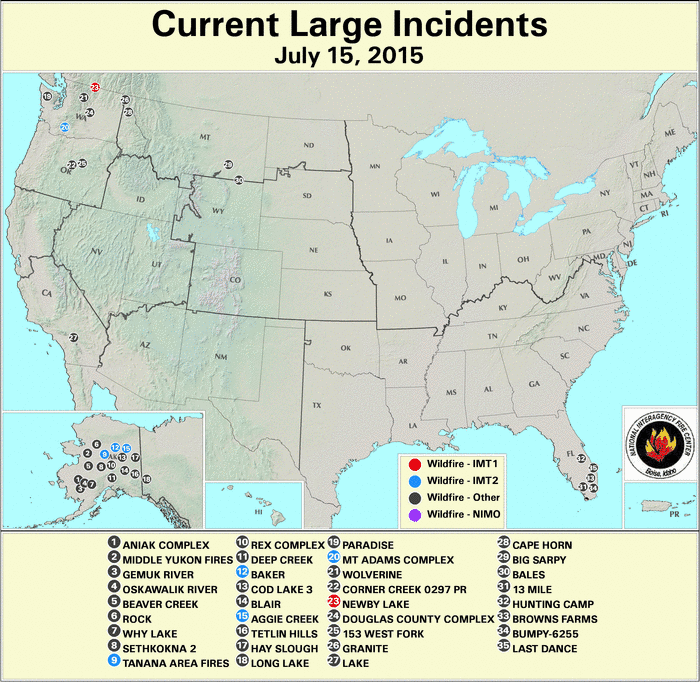
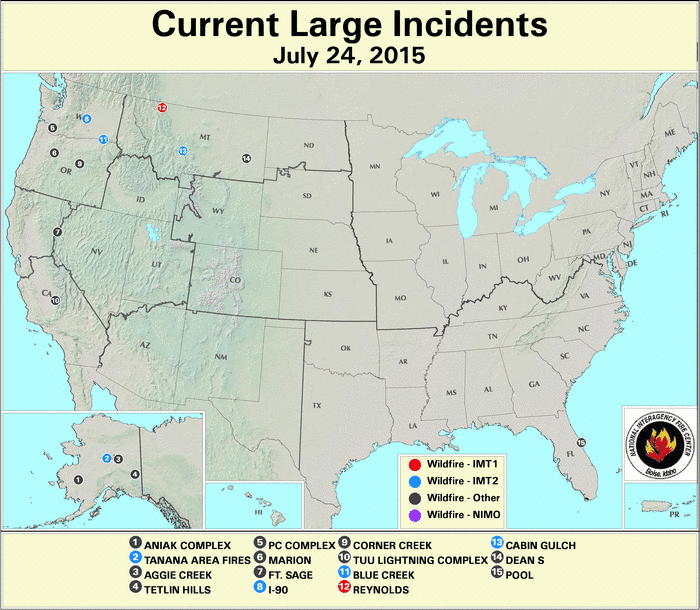
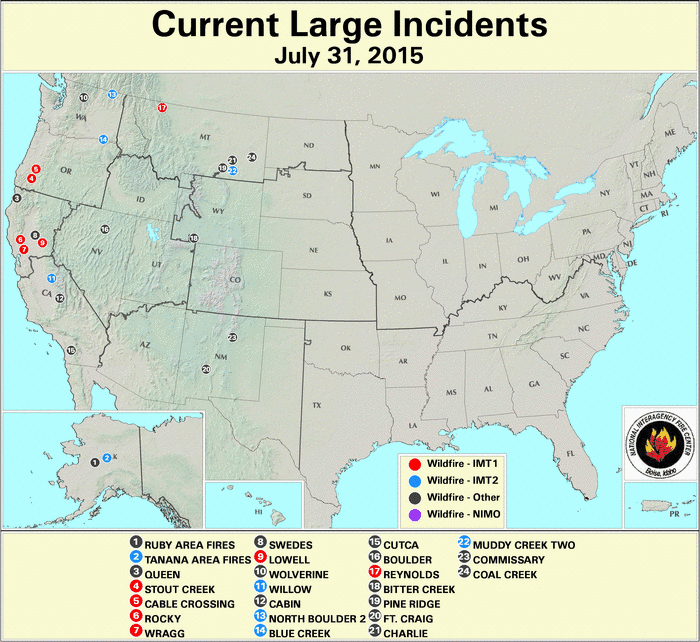
During July 2015, the North Pacific and North Atlantic subtropical high pressure centers exerted control over the nation's weather, but their influence was tempered by the El Niño in the West and jet stream weather systems in the East. The North Pacific High tended to create an upper-level ridge over the northeastern North Pacific Ocean and western North America. But the moderate to strong El Niño enhanced the formation of tropical cyclones over the eastern tropical Pacific which fed energy and moisture into the southwestern CONUS, and this was manifested as a trough over the Southwest. Weather systems moving in the very active jet stream flow distorted the ridge at the higher latitudes. Consequently, warmer- and drier-than-normal weather dominated much of the Pacific Northwest, but moisture from remnants of Hurricane Dolores, and from jet stream fronts and lows, contributed to wetter- and cooler-than-normal weather over the Southwest and other parts of the West. Washington ended the month with the fourth warmest July in the 1895-2015 record. The persistent heat, dryness, and lack of thick winter mountain snowpack intensified and expanded drought and abnormal dryness and laid the foundation for an explosion of large wildfires across the Far West (maps for July 1, 6, 10, 15, 24, 31) and Alaska. As the month wore on, troughs in the jet stream brought cooler and wetter weather to Alaska which helped shrink the wildfires in the "Last Frontier" State (maps for July 1, 10, 20, 29).
The North Atlantic High (also known as the Bermuda High) brought warmer- and drier-than-normal weather to much of the Southern Plains and Southeast, where drought and abnormal dryness expanded. Louisiana finished the month with the ninth driest and third warmest July on record. El Niño contributed to unfavorable atmospheric conditions (increased vertical wind shear) which inhibited the formation of tropical storms and hurricanes over the Caribbean, Gulf of Mexico, and Atlantic Ocean. The lack of rainfall from tropical systems helped intensify the dryness across the southern CONUS and much of the Caribbean.
The jet stream was unusually active this summer and extended farther south than usual in the eastern CONUS. Cool fronts and low pressure systems moving in the jet stream flow bumped into the Bermuda High, with some fronts penetrating into the Southeast. Showers and thunderstorms along the resulting storm track brought above-normal precipitation to many areas from the Central and Northern Plains to the Ohio Valley and Central Appalachians, and gave Kentucky the wettest July on record. The rain and fronts kept monthly temperatures cooler than normal from the Central Rockies to the Northeast. Severe weather also occurred along the storm track, but with the Bermuda High competing for dominance, only 122 tornadoes occurred (according to preliminary reports), which is slightly below the July average of 134.
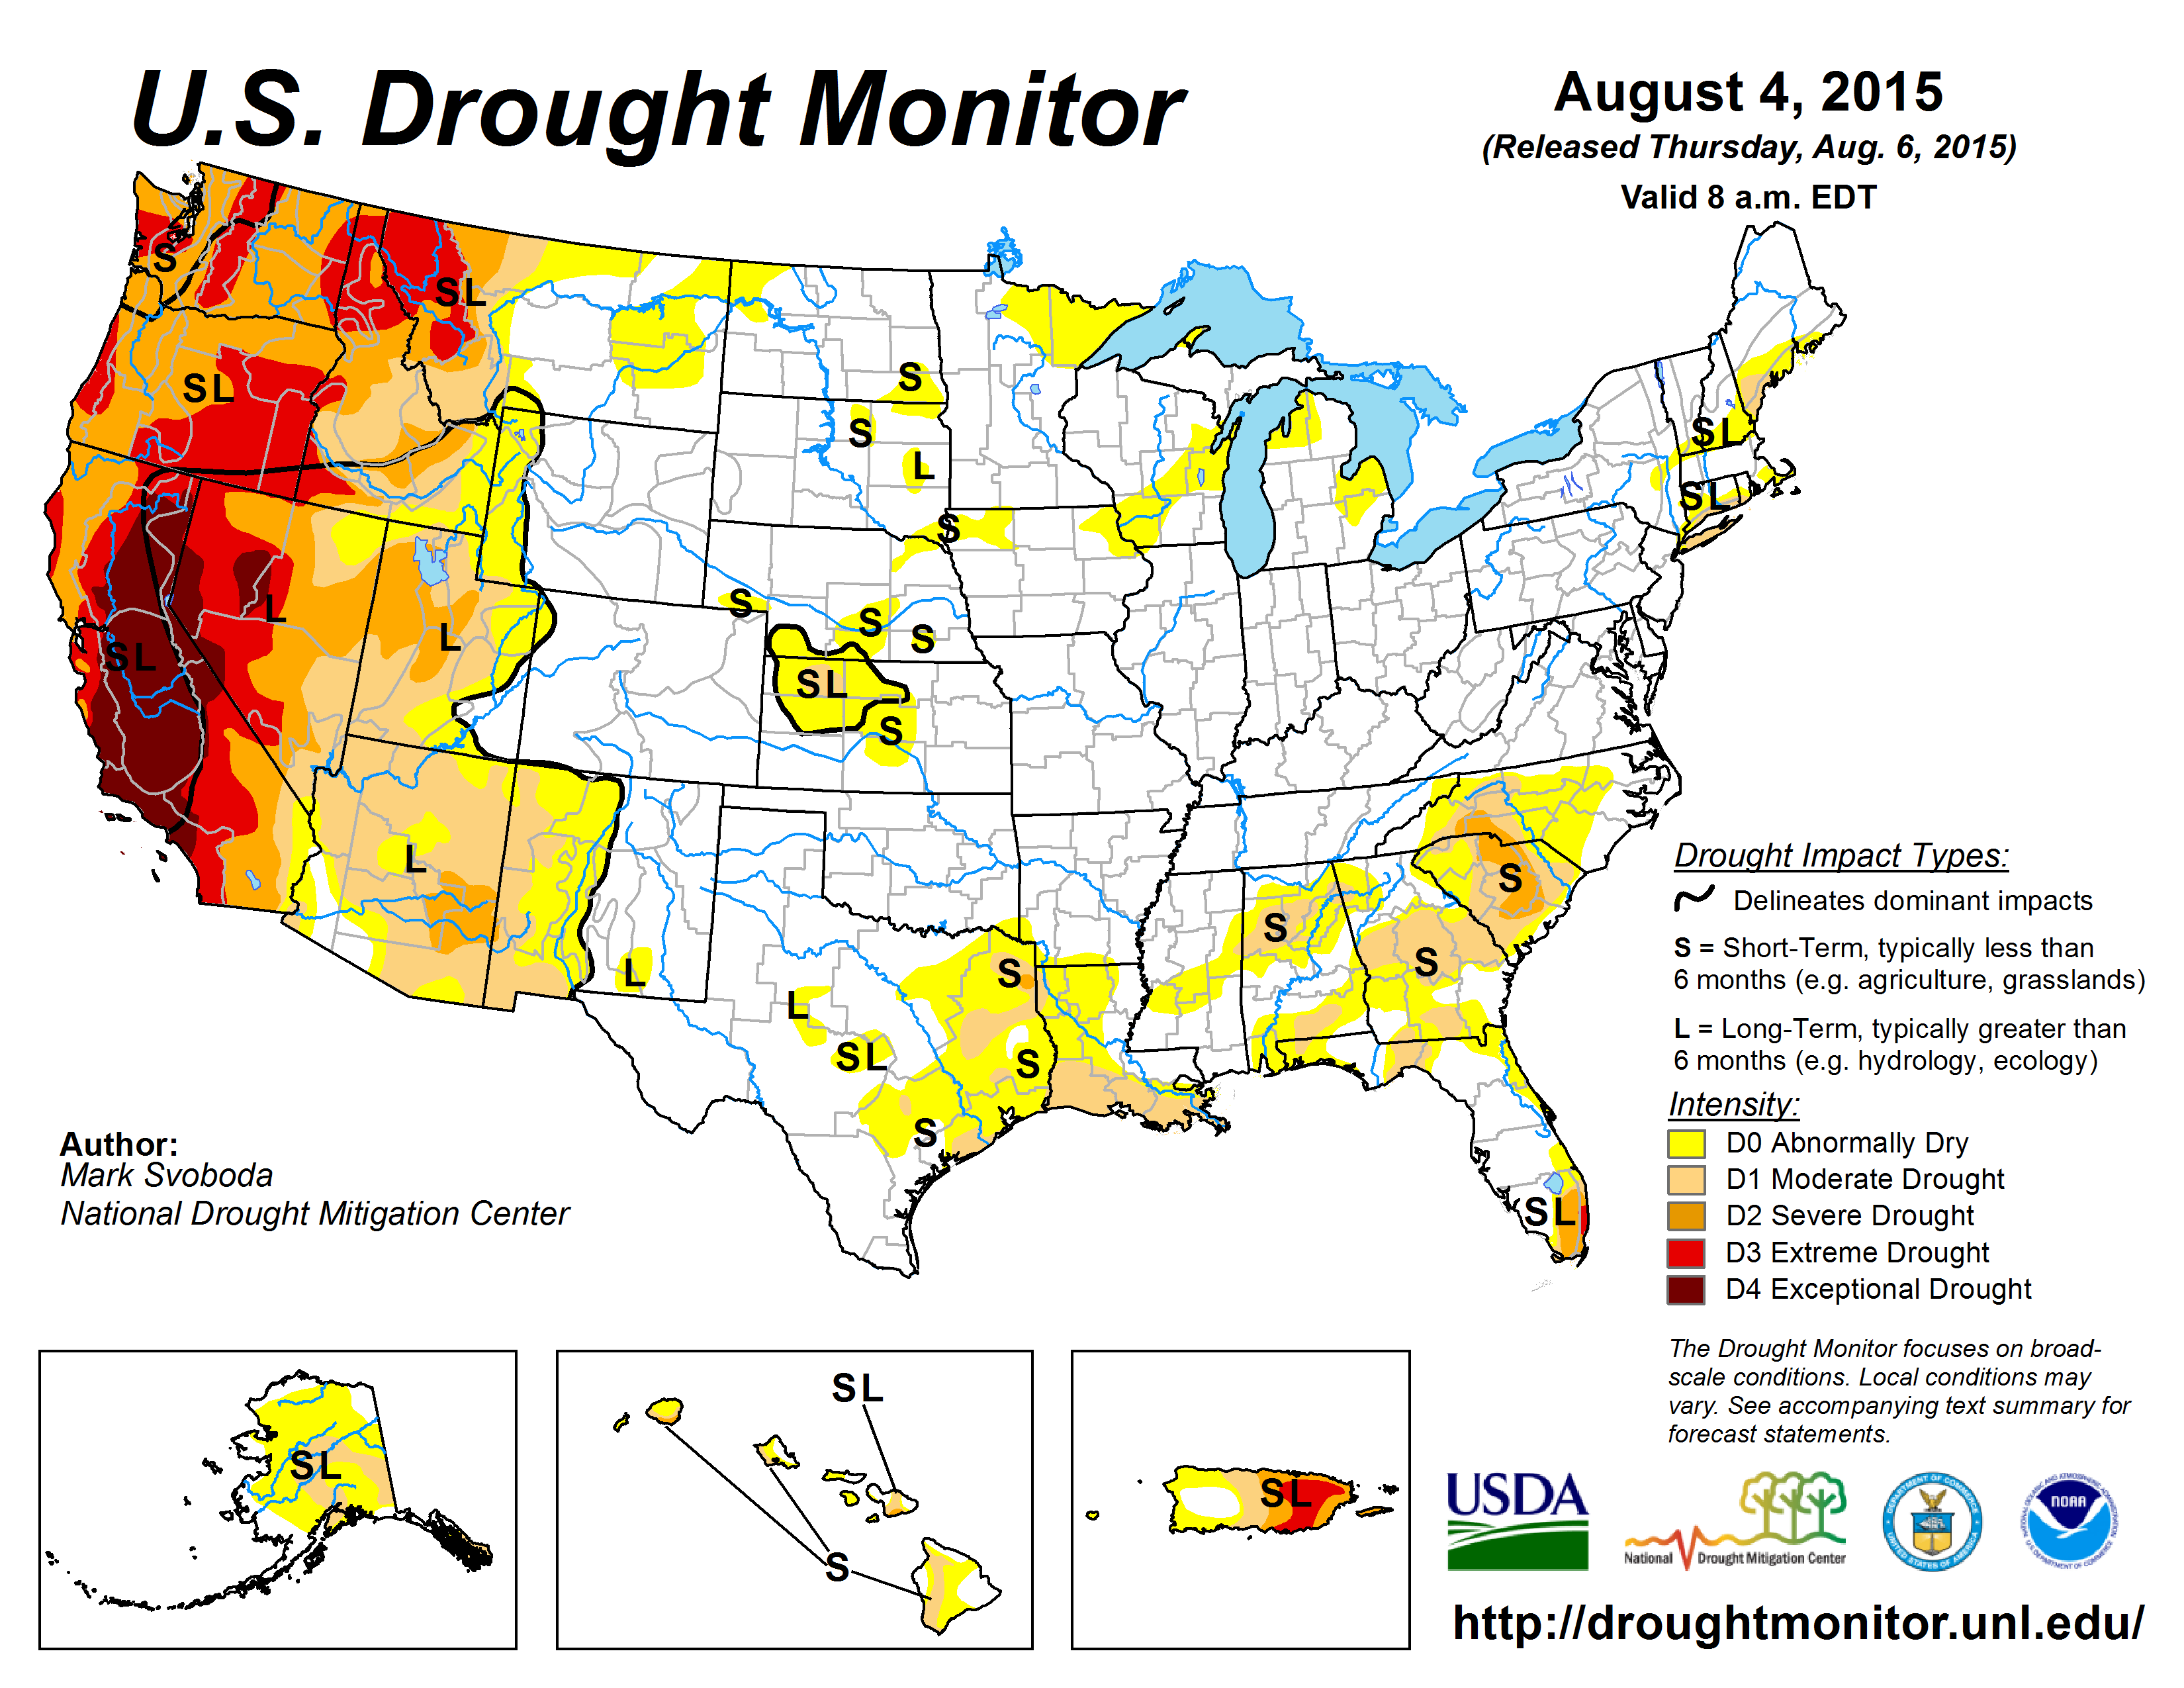
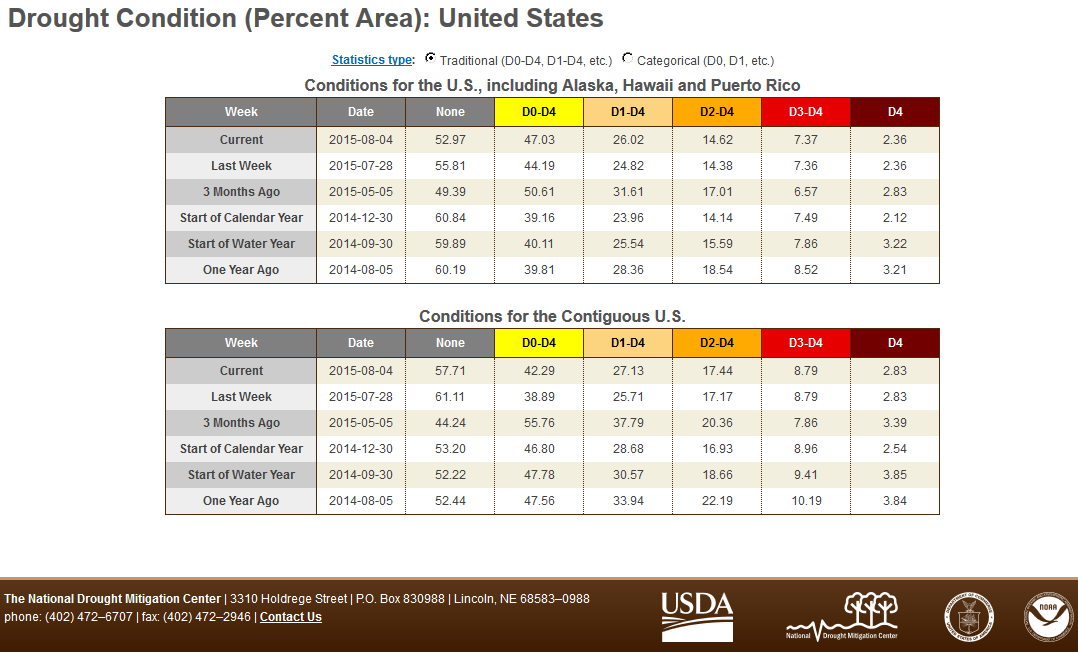
When the regional variations of temperature and precipitation anomalies are averaged together across the CONUS, July 2015 ranked as the 14th wettest and 56th warmest July in the 121-year record. The rain mostly fell in areas that were not in drought, so the national drought footprint expanded, with 27.1 percent of the CONUS experiencing moderate to exceptional drought at the end of July, compared to 25.9 percent at the end of June. Record warmth won out over record cold temperatures, but not by much. By the end of the month, there were 3,915 record warm daily high (1,038) and low (2,877) temperature records, which is about one and a half times the 2,662 record cold daily high (2,021) and low (641) temperature records. The REDTI (Residential Energy Demand Temperature Index) for July 2015 ranked 38th highest for July, illustrating how the unusual warmth in the heavily-populated areas of the Northwest and South increased cooling demands while the large area of well-below-normal temperatures in the less-populated Intermountain West had a smaller effect on lowering cooling demands.
The Climate Extremes Index (CEI) aggregates temperature and precipitation extremes across space and time. Several parts of the U.S. experienced temperature and precipitation extremes during July, including the East North Central region (seventh highest occurrence of heavy one-day precipitation events), Central region (fifth highest days with precipitation and sixth highest Palmer wet spell components), and South region (fifth highest Palmer wet spell and eighth highest warm minimum temperature components), but they were not enough to rank the regional CEI's into the top ten category. When the extremes for all of the components were aggregated together, the two westernmost regions had several extreme components which combined to yield extremely high regional CEI's. The Northwest region had the third most extreme July CEI on record due to the fourth most extreme warm minimum and ninth most extreme warm maximum temperature components, fifth most extreme one-day precipitation component, and eighth most extreme drought component. The West region had the fourth most extreme July CEI on record due to the most extreme days with precipitation component, fourth most extreme drought component, and eighth most extreme warm minimum temperature component. (It's ironic that the days with precipitation component contributed so heavily to the regional CEI. Since this is the dry season for the West region, any precipitation will not have much effect on drought, but any precipitation that falls will be highly unusual in itself simply because it is the dry season.) When aggregated across the nation, July 2015 had only the 26th most extreme national July CEI on record.
 North America monthly upper-level circulation pattern and anomalies. The movement of low pressure troughs and remnants of tropical cyclones across the southwestern CONUS resulted in a pattern of below-normal 500-mb height anomalies over the southwestern CONUS and adjacent eastern Pacific Ocean. Further north, in spite of the movement of short-wave troughs and lows through the upper-level circulation, a long-wave ridge pattern with above-normal heights dominated across the northeastern Pacific and into the adjacent Pacific Northwest and southwestern Canada, reflecting the influence of the North Pacific High pressure system. A high pressure ridge with above-normal 500-mb height anomalies dominated the Southern Plains, reflecting the influence of the North Atlantic High. Below-normal heights extended from the north-central Pacific, across Alaska and into northwest Canada, and from the northeastern Atlantic to northwest Russia. Above-normal heights covered the Arctic Ocean and Greenland. |
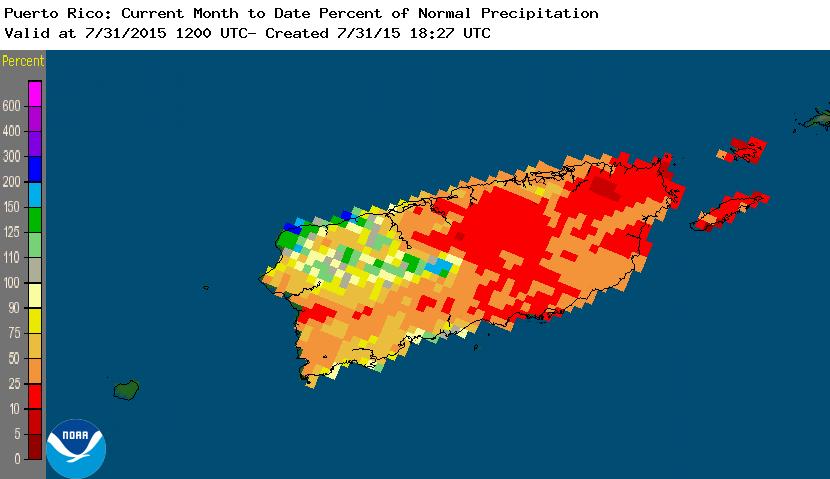
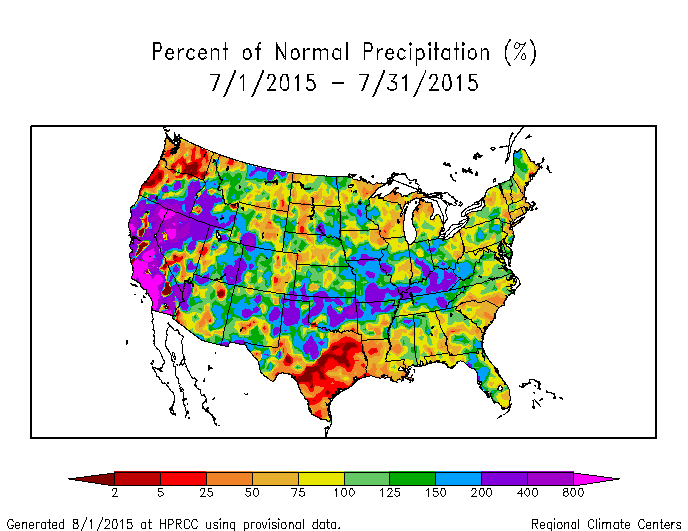 Map of monthly precipitation anomalies. Parts of the Pacific Northwest, Southern Plains, Southeast, and Great Lakes regions were drier than normal during July 2015. Precipitation was above normal across much of the West and Central Plains to Ohio Valley. A mixed pattern of precipitation anomalies characterized some of these areas and the rest of the CONUS, as well as Alaska and much of the Hawaiian Islands. July 2015 was the wettest July on record for Kentucky and second wettest for California, although this is the dry season for the Far West and it doesn't take much rain to give California a near-record wet month. July was drier than normal across most of Puerto Rico as an El Niño-enhanced dry spell afflicted much of the Caribbean. |
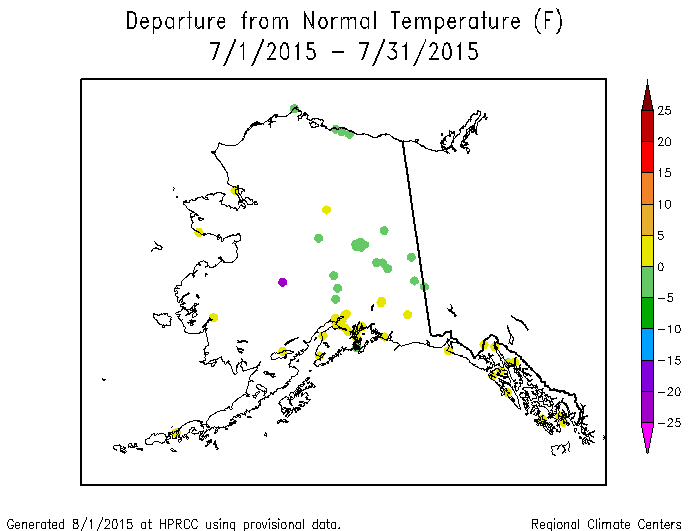
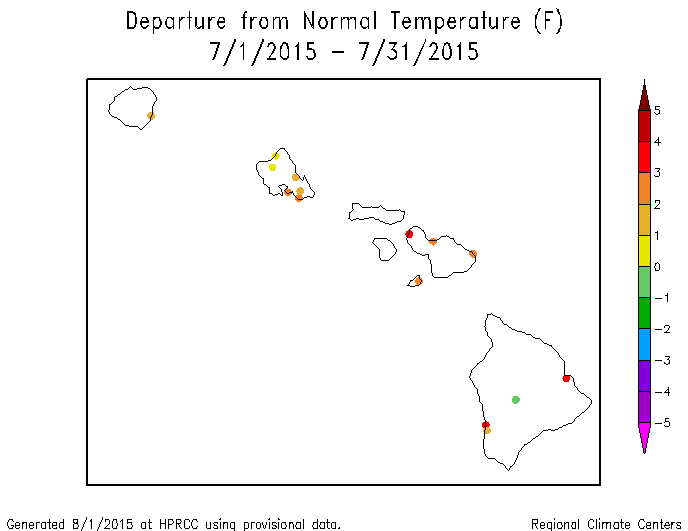
 Map of monthly temperature anomalies. July 2015 temperatures averaged warmer than normal across parts of the Pacific Northwest, Southern Plains, and Southeast; southern and western coastal Alaska; and most of Hawaii. Temperatures were colder than normal across much of the West and Central Plains to Northeast. |

Northern Hemisphere monthly upper-level circulation pattern and anomalies.
Atmospheric Drivers
Subtropical highs, and fronts and low pressure systems moving in the mid-latitude storm track flow, are influenced by the broadscale atmospheric circulation. The circulation of the atmosphere can be analyzed and categorized into specific patterns. The Tropics, especially the equatorial Pacific Ocean, provides abundant heat energy which largely drives the world's atmospheric and oceanic circulation. The following describes several of these modes or patterns of the atmospheric circulation, their drivers, the temperature and precipitation patterns (or teleconnections) associated with them, and their index values this month:
-
El Niño Southern Oscillation (ENSO)
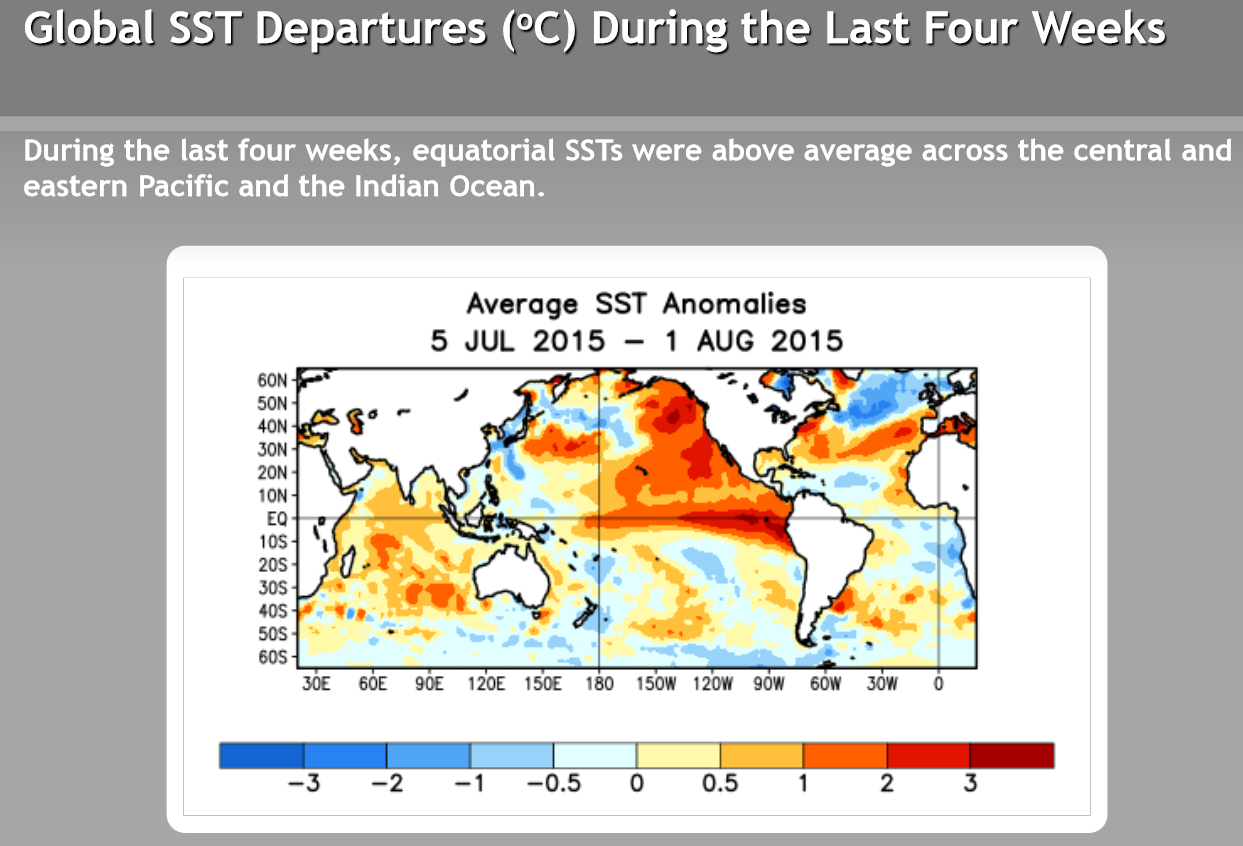
- Description: Oceanic and atmospheric conditions in the tropical Pacific Ocean can influence weather across the globe. ENSO is characterized by two extreme modes: El Niño (warmer-than-normal sea surface temperature [SST] anomalies in the tropical Pacific) and La Niña (cooler-than-normal SST anomalies), with the absence of either of these modes termed "ENSO-neutral" conditions.
- Status: During July 2015, El Niño conditions were observed as above-average SSTs continued across the western and central equatorial Pacific and continued to be coupled to the tropical atmosphere. Collectively, the atmospheric and oceanic features reflected an ongoing and strengthening El Niño.
- Teleconnections (influence on weather): To the extent teleconnections are known, the typical temperature and precipitation patterns associated with El Niño during July include above-normal precipitation in the Southeast and parts of the Central and Northern Plains and Great Basin; below-normal precipitation across the coastal Northwest, Southern Plains to Lower Mississippi Valley, parts of the Midwest, and New England; and below-normal temperatures across much of the West, most of the Northern Tier States, and parts of the Southeast.
- Comparison to Observed: The July 2015 temperature anomaly pattern is a very good match with that expected historically with an El Niño. Likewise, the July 2015 precipitation anomaly pattern is a good match, except in the Southeast and Midwest.
-
Madden-Julian Oscillation (MJO)
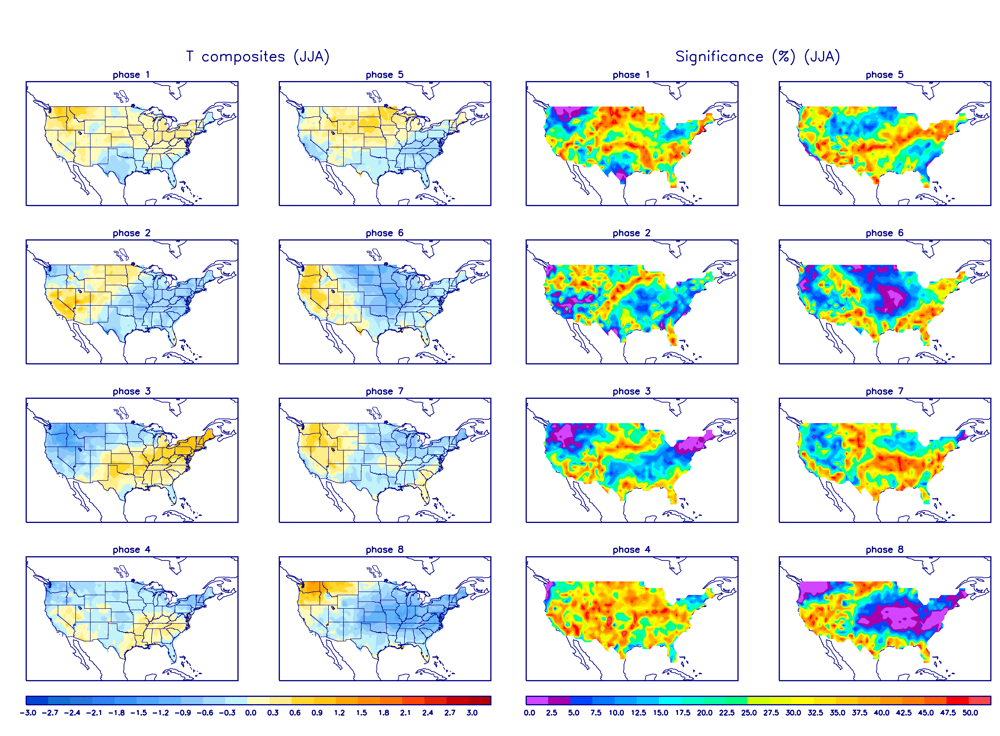
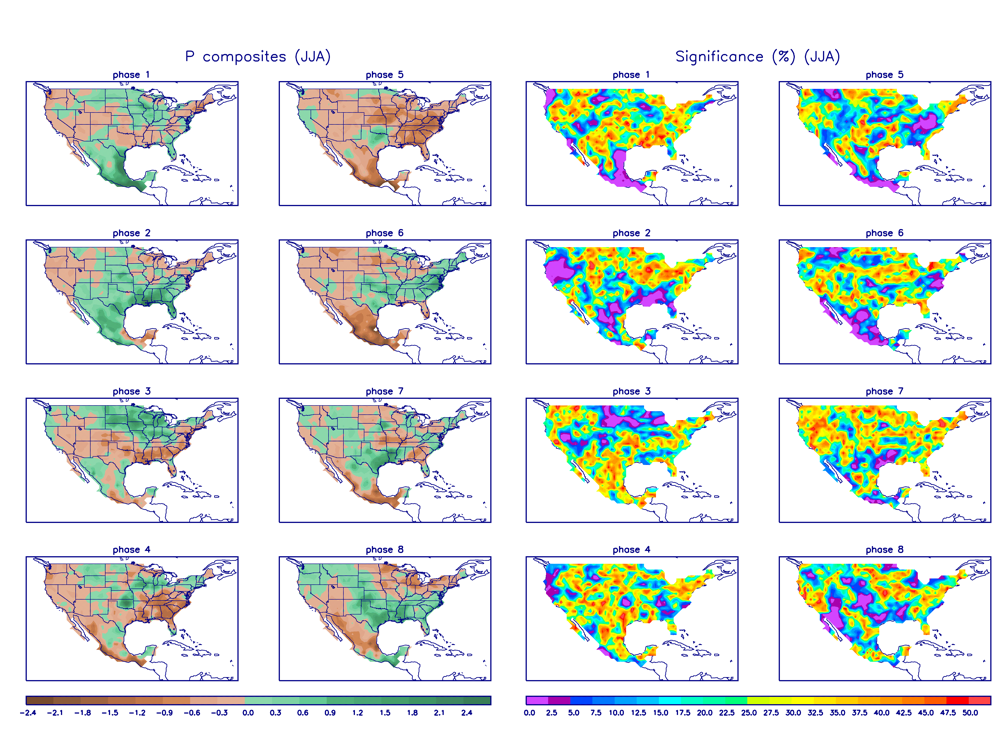
- Description: The MJO is a tropical disturbance or "wave" that propagates eastward around the global tropics with a cycle on the order of 30-60 days. It is characterized by regions of enhanced and suppressed tropical rainfall. One of its indices is a phase diagram which illustrates the phase (1-8) and amplitude of the MJO on a daily basis. The MJO is categorized into eight "phases" depending on the pattern of the location and intensity of the regions of enhanced and suppressed tropical rainfall. The MJO can enter periods of little or no activity, when it becomes neutral or incoherent and has little influence on the weather. Overall, the MJO tends to be most active during ENSO-neutral years, and is often absent during moderate-to-strong El Niño and La Niña episodes.
- Status: The MJO index was active during the first half of July, cycling through phases 7 through 8, then transitioned weakly into phases 1 and 2 but bordering on incoherence during the second half of the month. Other modes of coherent subseasonal tropical variability, including the background El Niño state and Kelvin waves, influenced the tropical Pacific and global climate. The MJO constructively interfered with the El Niño base state early in the month, resulting in continued Pacific convection. At mid-month, continued constructive interference between the MJO and the El Niño base state resulted in enhanced convection and tropical cyclone activity over the eastern Pacific and suppressed convection over the western Pacific (Maritime Continent) (MJO updates for July 6, 13, 20, and 27).
- Teleconnections (influence on weather): The MJO's temperature and precipitation teleconnections to U.S. weather depend on time of year and MJO phase. To the extent teleconnections are known, the June-August teleconnections for temperature are shown here and for precipitation are shown here.
- Comparison to Observed: The MJO is transitory and can change phases (modes) within a month, so it is more closely related to weekly weather patterns than monthly. The July 2015 monthly temperature and weekly (weeks 1 and 2) temperature anomaly patterns are a reasonable match for those expected with MJO phases 7-8. The monthly precipitation and weekly (weeks 1, 2, 3, 4, 5) precipitation anomaly patterns do not match those expected with MJO phases 7-8.
- The Pacific/North American (PNA) pattern
- Description: The PNA teleconnection pattern is associated with strong fluctuations in the strength and location of the East Asian jet stream. PNA-related blocking of the jet stream flow in the Pacific can affect weather downstream over North America, especially the West and especially in the winter half of the year.
- Status: The daily PNA index began the month positive, then turned neutral (near zero) at the middle of the month, averaging slightly positive for the month as a whole. The 3-month-averaged index was also near zero to slightly positive.
- Teleconnections (influence on weather): To the extent teleconnections are known, the temperature and upper-level circulation anomaly teleconnection maps for this time of year (July on the teleconnection maps) show little correlation to the PNA during the summer over North America. Likewise for precipitation, although there is a weak signal of positive correlations from Montana to Texas and negative correlations over the Great Lakes.
- Comparison to Observed: Because there is little correlation during the summer, the July 2015 temperature and upper-level circulation anomaly patterns have nothing to compare to. The July 2015 precipitation anomaly pattern agrees with that associated with a positive PNA where correlations exist.
- The Arctic Oscillation (AO) pattern
- Description: The AO teleconnection pattern relates upper-level circulation over the Arctic to circulation features over the Northern Hemisphere mid-latitudes and is most active during the cold season.
- Status: The daily AO index was slightly negative throughout the month, averaging negative for the month. The 3-month-averaged index was near zero.
- Teleconnections (influence on weather): To the extent teleconnections are known, a negative AO this time of year (June-August) is typically associated with dry conditions in the Southern Plains to Central Gulf of Mexico Coast and the Northeast; wet conditions in parts of the Central and Northern Plains and Ohio Valley; below-normal temperatures across parts of the Southwest and Northern Tier States; and upper-level circulation anomalies which are below normal in the North Central Pacific, Northern Tier States and southern Canadian Provinces east of the Rockies, and across the North Atlantic, and above normal over the Arctic Ocean and Greenland.
- Comparison to Observed: The July 2015 monthly temperature anomaly pattern generally agrees where there are teleconnections. The precipitation anomaly pattern shows good agreement, especially in the Central and Southern Plains to Ohio Valley. The upper-level circulation anomaly pattern agrees with those associated with a negative AO over the North Central Pacific, North Atlantic, Arctic, and Greenland, but not over North America.
- The North Atlantic Oscillation (NAO) pattern
- Description: The NAO teleconnection pattern relates upper-level circulation over the North Atlantic Ocean to circulation features over the Northern Hemisphere mid-latitudes.
- Status: The daily NAO index negative throughout the month, averaging negative for the month. The 3-month-averaged index was also negative, reversing a positive trend which had lasted for several prior months.
- Teleconnections (influence on weather): To the extent teleconnections are known, a negative NAO during this time of year (July on the teleconnection maps) is associated with drier-than-normal conditions in the Southern Plains to Lower Mississippi Valley, wetter-than-normal conditions in parts of the Northern Plains to Midwest (although the teleconnections are weak for precipitation); warmer-than-normal temperatures from the Southern Plains to Southeast, colder-than-normal temperatures in the Northern Plains extending into the Northern Rockies; positive upper-level circulation anomalies across the northeast North Pacific and Greenland, and negative upper-level circulation anomalies over the North Atlantic and along the U.S.-Canadian border.
- Comparison to Observed: The July 2015 temperature and precipitation anomaly patterns show good agreement with the teleconnections associated with a negative NAO where teleconnections exist. The monthly upper-level circulation anomaly pattern show good agreement over the oceans and higher latitudes, but not over North America.
- The West Pacific (WP) pattern
- Description: The WP teleconnection pattern is a primary mode of low-frequency variability over the North Pacific and reflects zonal and meridional variations in the location and intensity of the (East Asian) jet stream in the western Pacific.
- Status: Both the monthly WP index and three-month average WP index were positive.
- Teleconnections (influence on weather): To the extent teleconnections are known, a positive WP during this time of year (July on the maps) is typically associated with below-normal temperatures in the Southwest, Great Lakes, Ohio Valley, and Northeast; below-normal circulation anomalies over the southwestern CONUS and eastern North America; and above-normal circulation anomalies over the western North Pacific and western Canada extending into the northeastern North Pacific. There are no significant precipitation teleconnections.
- Comparison to Observed: The July 2015 monthly temperature anomaly pattern generally agrees with that associated with a positive WP over the CONUS. The upper-level circulation anomaly pattern agrees with that expected for a positive WP except over eastern North America.
- The East Pacific-North Pacific (EP-NP) pattern
- Description: The EP-NP teleconnection pattern relates SST and upper-level circulation patterns (geopotential height anomalies) over the eastern and northern Pacific to temperature, precipitation, and circulation anomalies downstream over North America. Its influence during the winter is not as strong as during the other three seasons.
- Status: The July SST pattern showed above-normal SSTs along the North American coast and pockets of cooler-than-normal SSTs in the central North Pacific. The northeastern North Pacific SSTs showed some cooling this month in the Gulf of Alaska region. The monthly EP-NP index was slightly positive during July, while the 3-month running mean was positive.
- Teleconnections (influence on weather): To the extent teleconnections are known, a positive EP-NP index during this time of year (July on the maps) is typically associated with cooler-than-normal temperatures from the Central Rockies to the Central and Northern Plains and Great Lakes, warmer-than-normal temperatures across parts of Alaska, above-normal upper-level circulation anomalies (stronger upper-level ridge) over Alaska and western Canada, and below-normal upper-level circulation anomalies (stronger upper-level trough) over the north central CONUS, eastern Canada, and the central North Pacific. The precipitation teleconnections are too weak to be mapped in any detail.
- Comparison to Observed: The July 2015 temperature anomaly pattern shows agreement over the CONUS but not over Alaska. The upper-level circulation anomaly pattern shows little agreement with that expected with a positive EP-NP.
Examination of the available circulation indices and their teleconnection patterns, and comparison to observed July 2015 temperature, precipitation, and circulation anomaly patterns, suggest that the weather over the CONUS in July reflected influences from several atmospheric drivers. The El Niño funneled energy and moisture from the eastern equatorial Pacific into the U.S. Southwest and inhibited development of North Atlantic tropical cyclones. The MJO worked in conjunction with (constructively interfered with) El Niño to enhance development of tropical cyclones and other convection in the eastern tropical Pacific which fed moisture into the southwestern CONUS. Most of the indices showed some teleconnection with temperature over some parts of the CONUS during July. The July 2015 temperature anomaly pattern matched well with the teleconnections for all of them (ENSO, MJO, AO, NAO, and WP), indicating that the atmosphere and oceans (Arctic, North Atlantic, North Pacific, and tropical Pacific) worked in conjunction to influence July's temperature pattern over the CONUS. Precipitation is not well-correlated with most of the indices during the summer, but there was good agreement (where teleconnections exist) with the PNA, AO, and NAO, hinting that these drivers had some influence. The AO, NAO, and WP showed reasonable agreement with the circulation anomalies over the oceans and higher latitudes, but not over North America, suggesting that these drivers were important for July's weather over the Northern Hemisphere but that the other drivers (e.g., the tropical Pacific) were influencing the weather over North America more than the North Atlantic, North Pacific, or Arctic drivers were.
This month illustrates how the weather and climate anomaly patterns can reflect the combined influence of several atmospheric drivers (or modes of atmospheric variability), but how those originating from the Tropical Pacific can have a dominating role.