Note: This Synoptic Discussion describes recent weather events and climate anomalies in relation to the phenomena that cause the weather. These phenomena include the jet stream, fronts and low pressure systems that bring precipitation, high pressure systems that bring dry weather, and the mechanisms which control these features — such as El Niño, La Niña, and other oceanic and atmospheric drivers (PNA, NAO, AO, and others). The report may contain more technical language than other components of the State of the Climate series.
Summary
June 2015 was characterized by a very active upper-level circulation pattern over the contiguous United States (CONUS), with several weather systems moving in the jet stream flow. A warm and dry long-wave ridge dominated western North America, while the North Atlantic subtropical high pressure center (Bermuda High) helped keep the southeastern CONUS warmer and drier than normal. The storm track was squeezed in between these systems, bringing above-normal precipitation to the Midwest to Northeast. As a result, drought expanded in the West and Southeast and contracted in the Northeast, and the month was wetter and warmer than normal nationwide. The western ridge and Bermuda High inhibited severe weather in the areas under their influence while El Niño inhibited the formation of Atlantic tropical cyclones. See below for details.
Synoptic Discussion
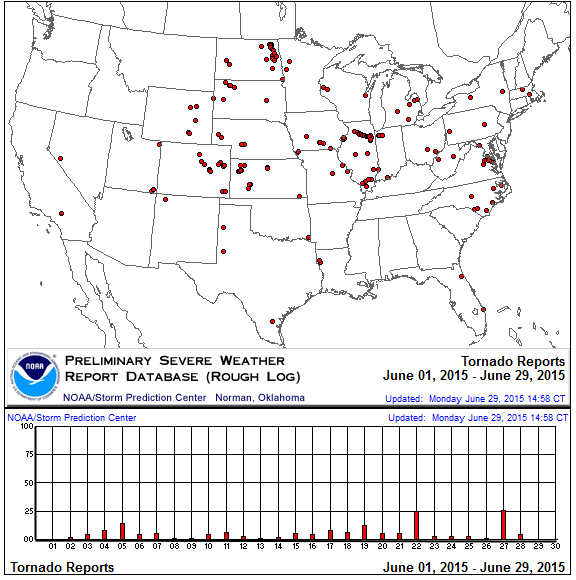
 Animation of daily upper-level circulation for the month. In the Northern Hemisphere, June marks the beginning of climatological summer, which is the time of year when solar heating forces the jet stream and circumpolar vortex to contract poleward. Polar air masses can still influence the weather, but they are not as cold as in previous months. The warm, dry subtropical high pressure belt normally dominates the weather as it shifts northward, with warm southerly air masses moving into the contiguous United States (CONUS) more frequently. This was the case during June 2015. The long-wave circulation pattern in the upper atmosphere consisted of a ridge over western North America, while the North Atlantic subtropical high pressure center (Burmuda High) dominated the weather over the southeastern CONUS. These high pressure systems brought warmer-than-normal and generally drier-than-normal weather to the West and Southeast, as well as much of Alaska and Puerto Rico. The storm track was squeezed in between these systems, with several cold fronts and low pressure systems bringing above-normal precipitation to the Midwest to Northeast. Even though a moderate to strong El Niño inhibited the formation of tropical systems in the North Atlantic and Caribbean, Tropical Storm Bill moved into the Southern Plains from the Gulf of Mexico at mid-month and got caught up in the westerly flow across the Midwest, bringing above-normal precipitation and cooler-than-normal temperatures to these regions. Meanwhile, the El Niño-enhanced eastern Tropical Pacific produced Hurricanes Andres and Blanca. Moisture from the remnants of these two cyclones flowed into the Southwest, enhancing monsoon showers and bringing above-normal precipitation. Unstable atmospheric conditions, including a vertical wind pattern that created a spinning motion in the air, were associated with the storm track, with frequent outbreaks of severe weather developing. There were 165 preliminary reports of tornadoes, mostly from the Central and Northern Plains to Mid-Atlantic coast. This is less than the June average of 243, due in part to the inhibition of severe weather by the ridge in the West and Bermuda High in the Southeast. |
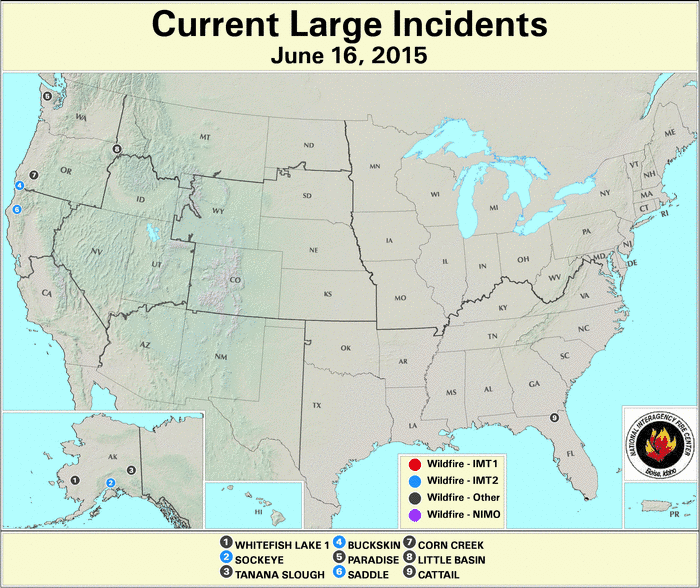
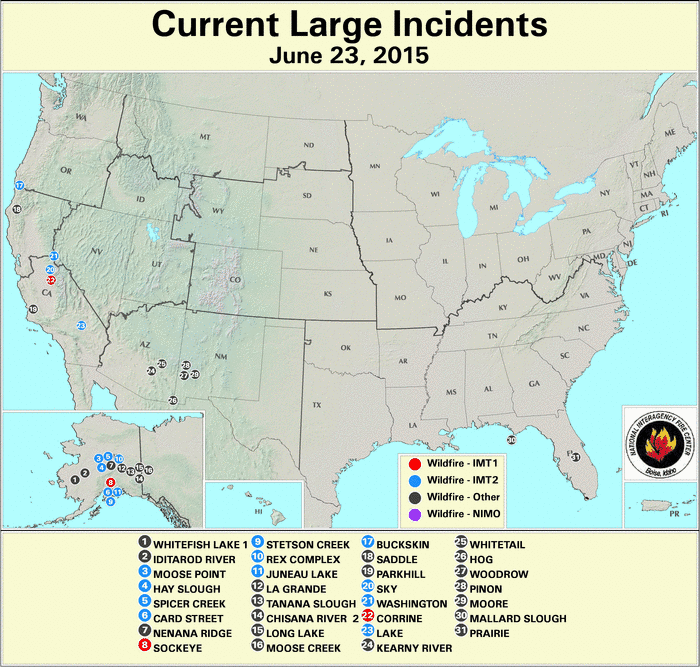
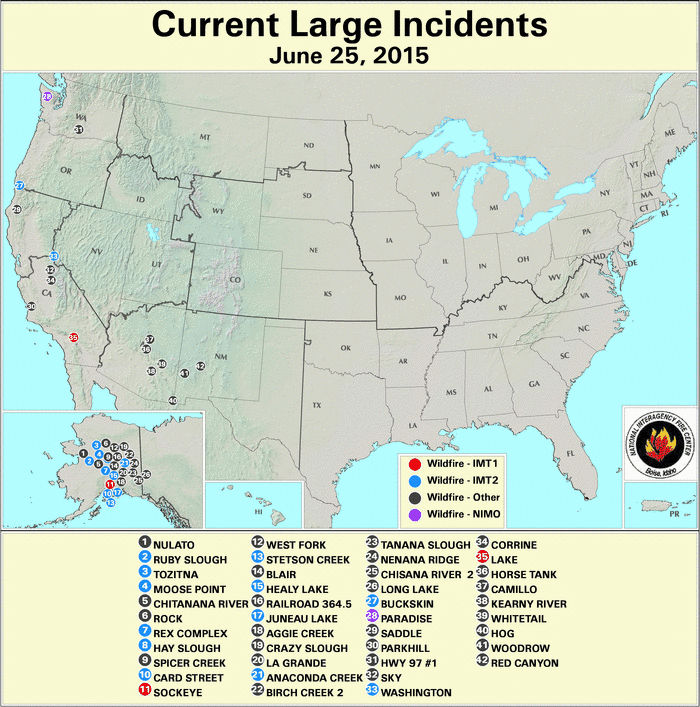
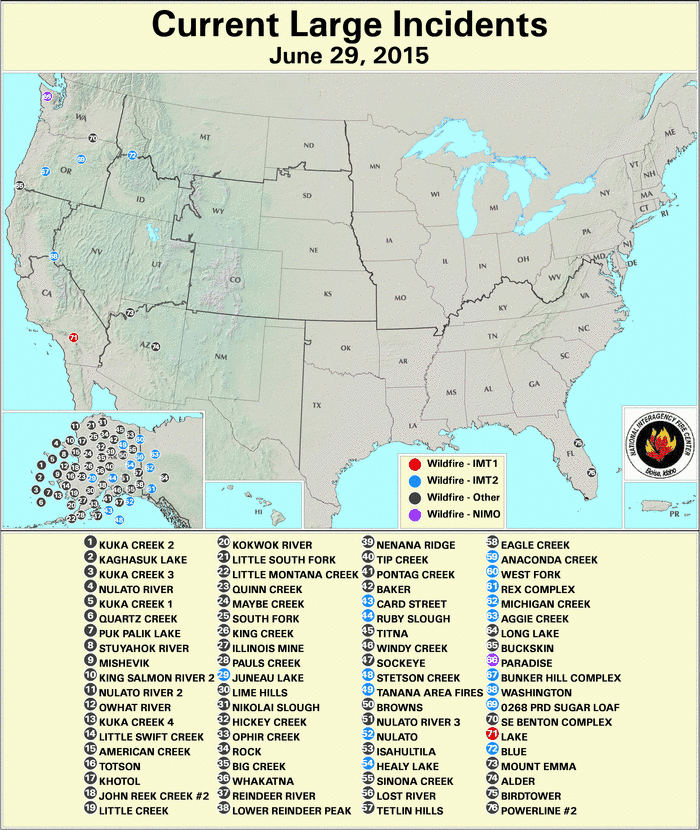
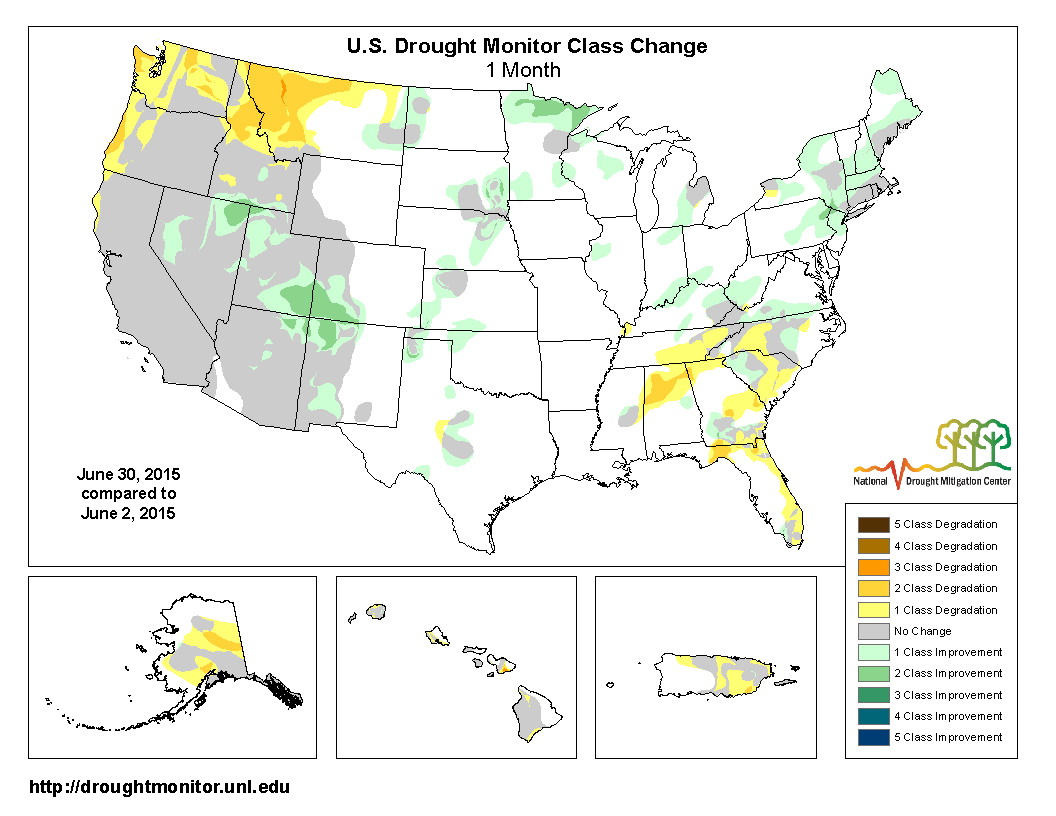
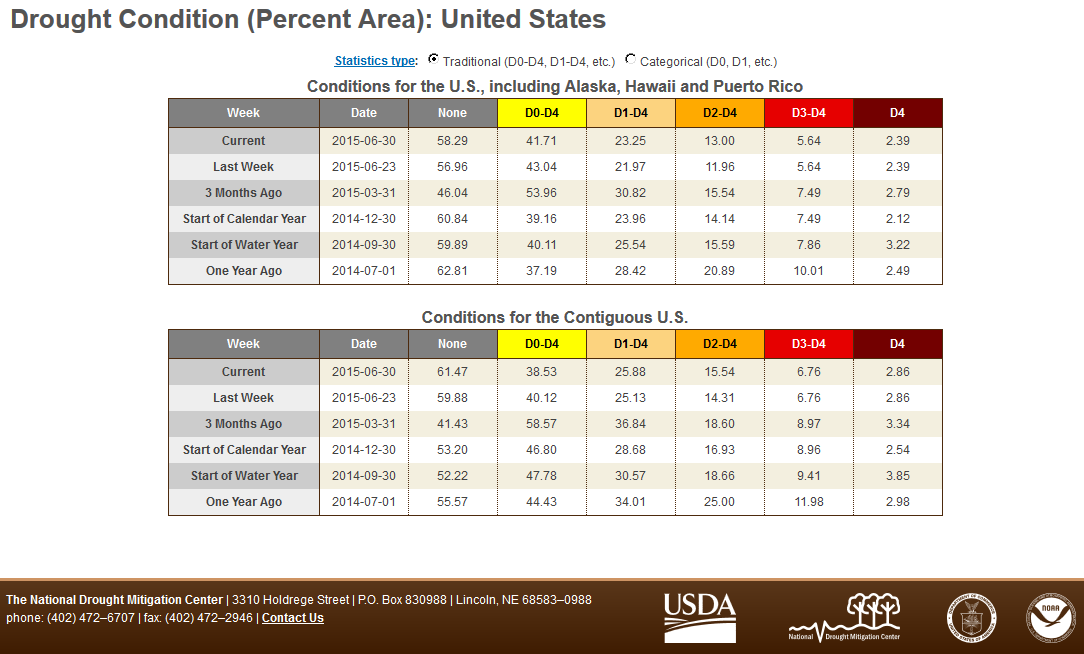
 Animation of daily surface fronts and pressure systems for the month. Even though upper-level troughs and low pressure systems moved through the long-wave ridge over western North America, the ridge inhibited them from producing much precipitation. Instead, hot and dry weather dominated, setting the stage for the development of numerous large wildfires across the West and especially Alaska (maps for June 16, 23, 25, 29). The hot and dry weather also expanded and intensified drought across much of the Pacific Northwest and Alaska. Convective showers and thunderstorms dotted the Southeast, but drought expanded where it didn't rain, especially in Puerto Rico. Monsoon showers in the Southwest helped improve drought conditions in the short-term. The western ridge helped direct cooler air masses from more northern latitudes southward, bringing cooler-than-normal temperatures to the Great Lakes and Northeast, while the Bermuda High funneled Gulf of Mexico moisture northward, fueling the storm track. The above-normal precipitation in the Midwest and Northeast helped contract drought in these regions. The net effect was an expansion of the overall national drought footprint, with 25.9 percent of the CONUS experiencing moderate to exceptional drought at the end of June, compared to 24.6 percent at the end of May. The rainfall in the Midwest was so intense, that it gave Illinois, Indiana, and Ohio the wettest June on record and contributed to the ninth wettest June, nationally, in the 1895-2015 record. With high pressure dominating the weather across much of the country, record warmth dominated record cold temperatures. By the end of the month, there were 5,622 record warm daily high (2,086) and low (3,536) temperature records, which is more than five times the 1,066 record cold daily high (927) and low (139) temperature records. The monthly average temperature ranked June 2015 as the second warmest June in the 1895-2015 record. The REDTI (Residential Energy Demand Temperature Index) for June 2015 ranked 16th highest for June, illustrating how the below-normal temperatures in the heavily-populated Northeast and Upper Midwest helped reduced cooling demands while the large area of well-above-normal temperatures in the Southeast and less-populated West elevated the nationally-averaged temperature. The Climate Extremes Index (CEI) aggregates temperature and precipitation extremes across space and time. Parts of the U.S. experienced temperature and precipitation extremes during June, and when aggregated they gave several regions record high CEI values. The West region had the most extreme June CEI on record due to the most extreme warm maximum and warm minimum temperature and drought components as well as the ninth most extreme days with precipitation component. The Northwest region also had the most extreme June CEI on record due to the most extreme warm maximum and warm minimum temperature components, eighth most extreme drought component, and tenth most extreme days without precipitation component. The Southwest region had the ninth most extreme June CEI on record due largely to the most extreme warm minimum temperature component and eighth most extreme warm maximum temperature component. When aggregated across the nation, June had the most extreme warm minimum temperature component, seventh most extreme days with precipitation component, and ninth most extreme warm maximum temperature component, which resulted in the third most extreme national June CEI on record. |
 North America monthly upper-level circulation pattern and anomalies. In spite of the movement of short-wave troughs and lows through the upper-level circulation, a long-wave ridge pattern dominated across western North America. So, when integrated across the month, the atmospheric circulation indicated a pattern of above-normal 500-mb height anomalies over the western half of the CONUS and southwest Canada. A stronger-than-normal North Atlantic High contributed to above-normal heights over the North Atlantic and adjacent coastal CONUS. A smaller area of below-normal 500-mb heights extended across the Canadian Arctic into the Arctic Ocean. |
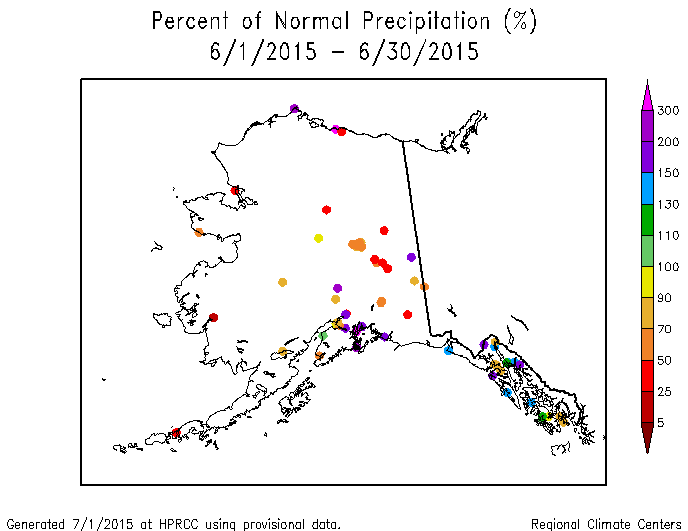
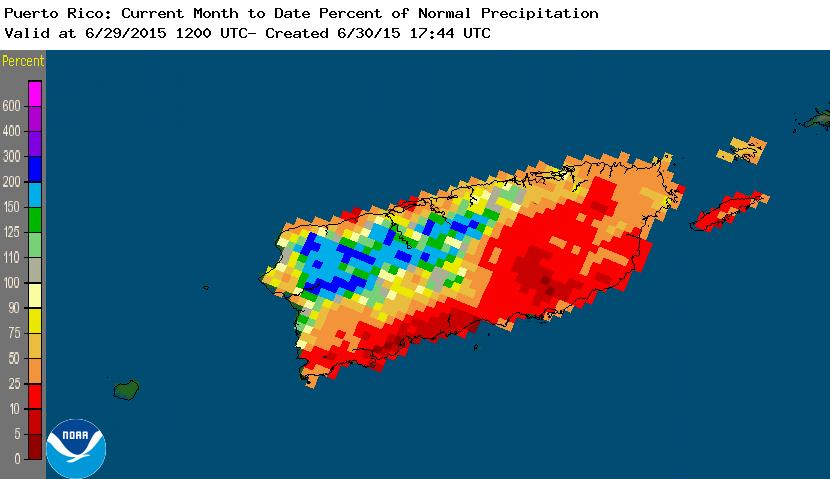
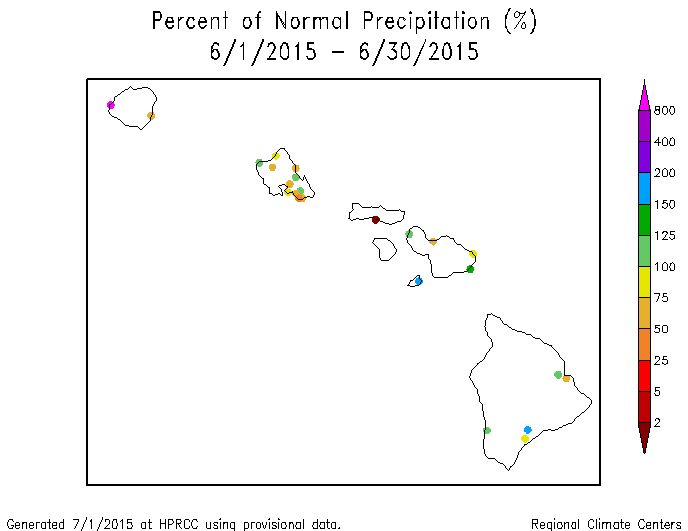
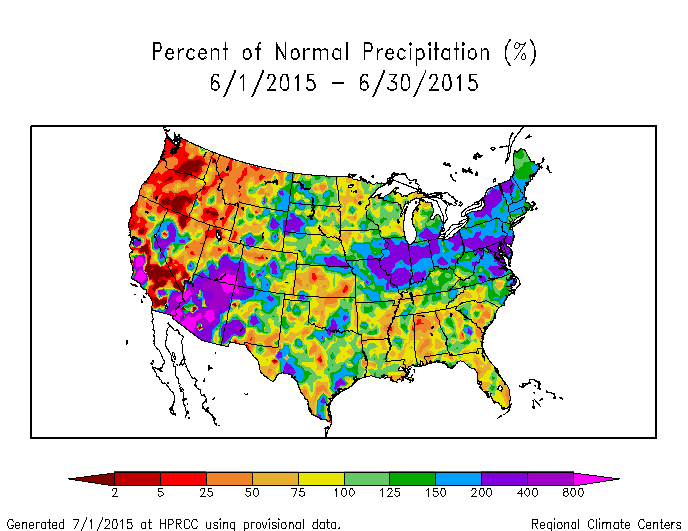 Map of monthly precipitation anomalies. The Pacific Northwest and parts of the Great Plains and Southeast were drier than normal during June 2015. Precipitation was above normal across parts of the Southwest and Great Plains, and from the Ohio Valley to the Mid-Atlantic and Northeast. Very heavy rains brought record monthly precipitation to the Midwest states of Illinois, Indiana, and Ohio. June was drier than normal across much of Alaska and Puerto Rico and parts of Hawaii. |
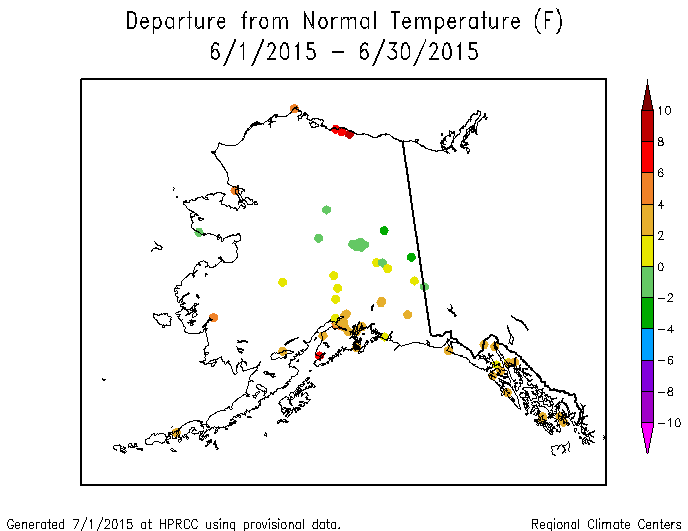
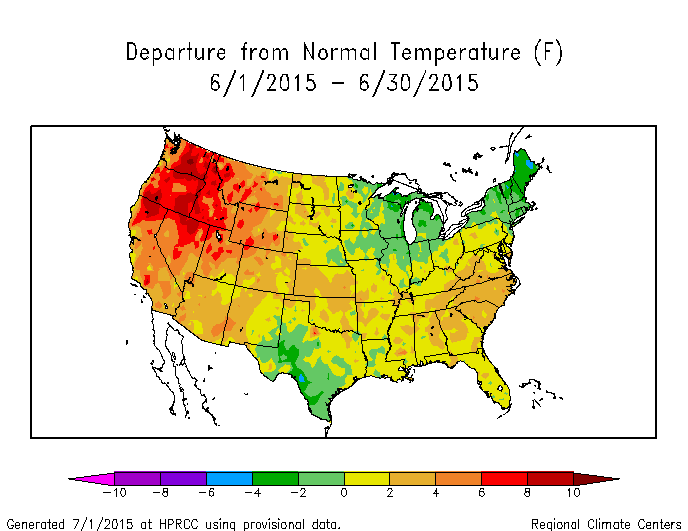 Map of monthly temperature anomalies. June 2015 temperatures averaged warmer than normal across the western U.S., Central Plains, Southeast, and much of Alaska. The temperature anomalies were especially warm in the western CONUS. Temperatures were colder than normal across parts of the Southern Plains, Great Lakes, and Northeast. |
Northern Hemisphere monthly upper-level circulation pattern and anomalies.
Atmospheric Drivers
Subtropical highs, and fronts and low pressure systems moving in the mid-latitude storm track flow, are influenced by the broadscale atmospheric circulation. The circulation of the atmosphere can be analyzed and categorized into specific patterns. The Tropics, especially the equatorial Pacific Ocean, provides abundant heat energy which largely drives the world's atmospheric and oceanic circulation. The following describes several of these modes or patterns of the atmospheric circulation, their drivers, the temperature and precipitation patterns (or teleconnections) associated with them, and their index values this month:
-
El Niño Southern Oscillation (ENSO)
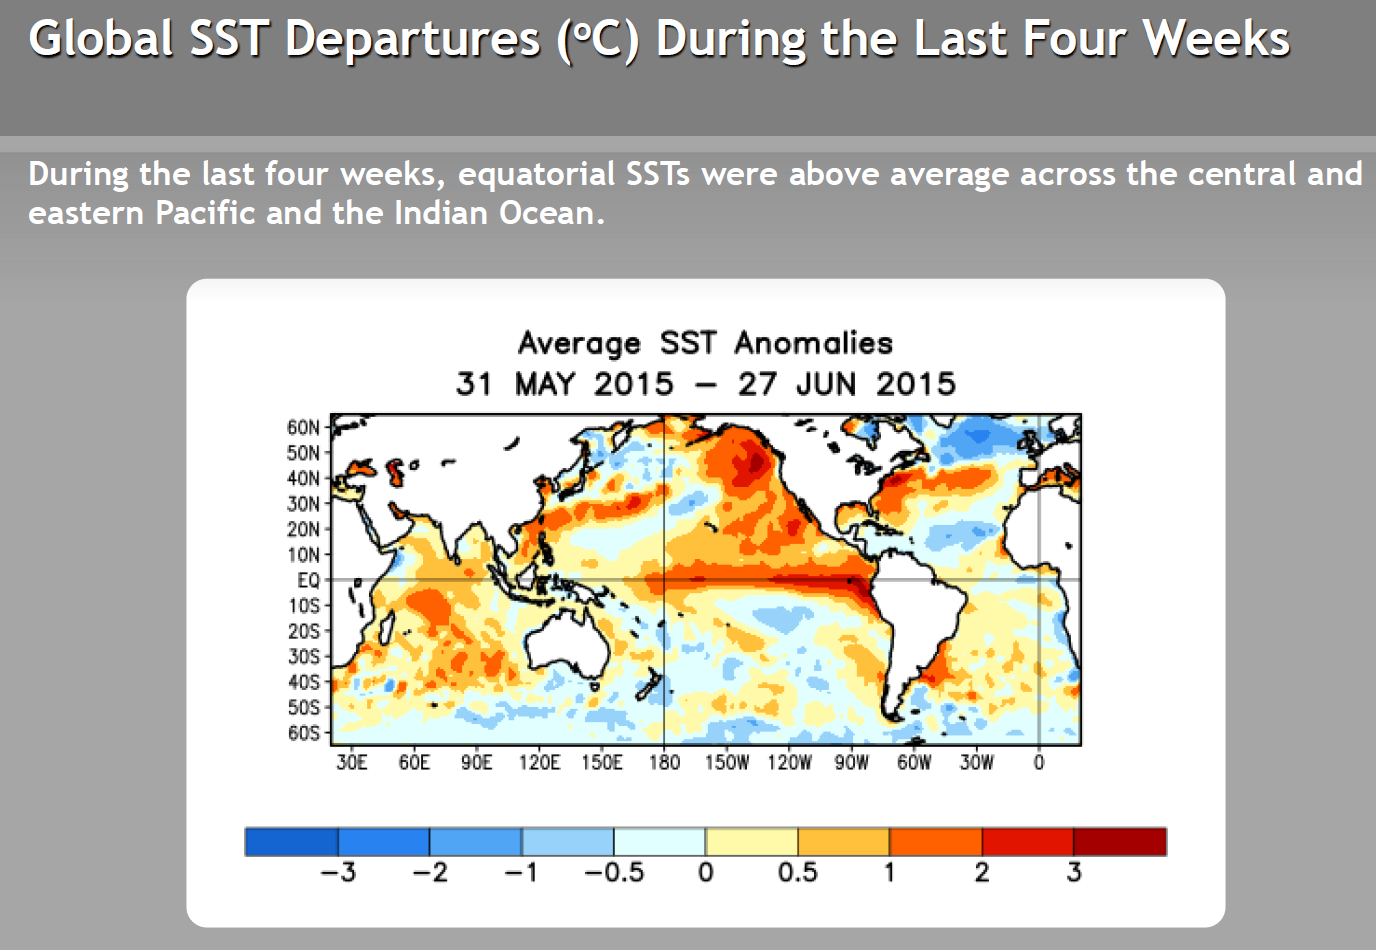
- Description: Oceanic and atmospheric conditions in the tropical Pacific Ocean can influence weather across the globe. ENSO is characterized by two extreme modes: El Niño (warmer-than-normal sea surface temperature [SST] anomalies in the tropical Pacific) and La Niña (cooler-than-normal SST anomalies), with the absence of either of these modes termed "ENSO-neutral" conditions.
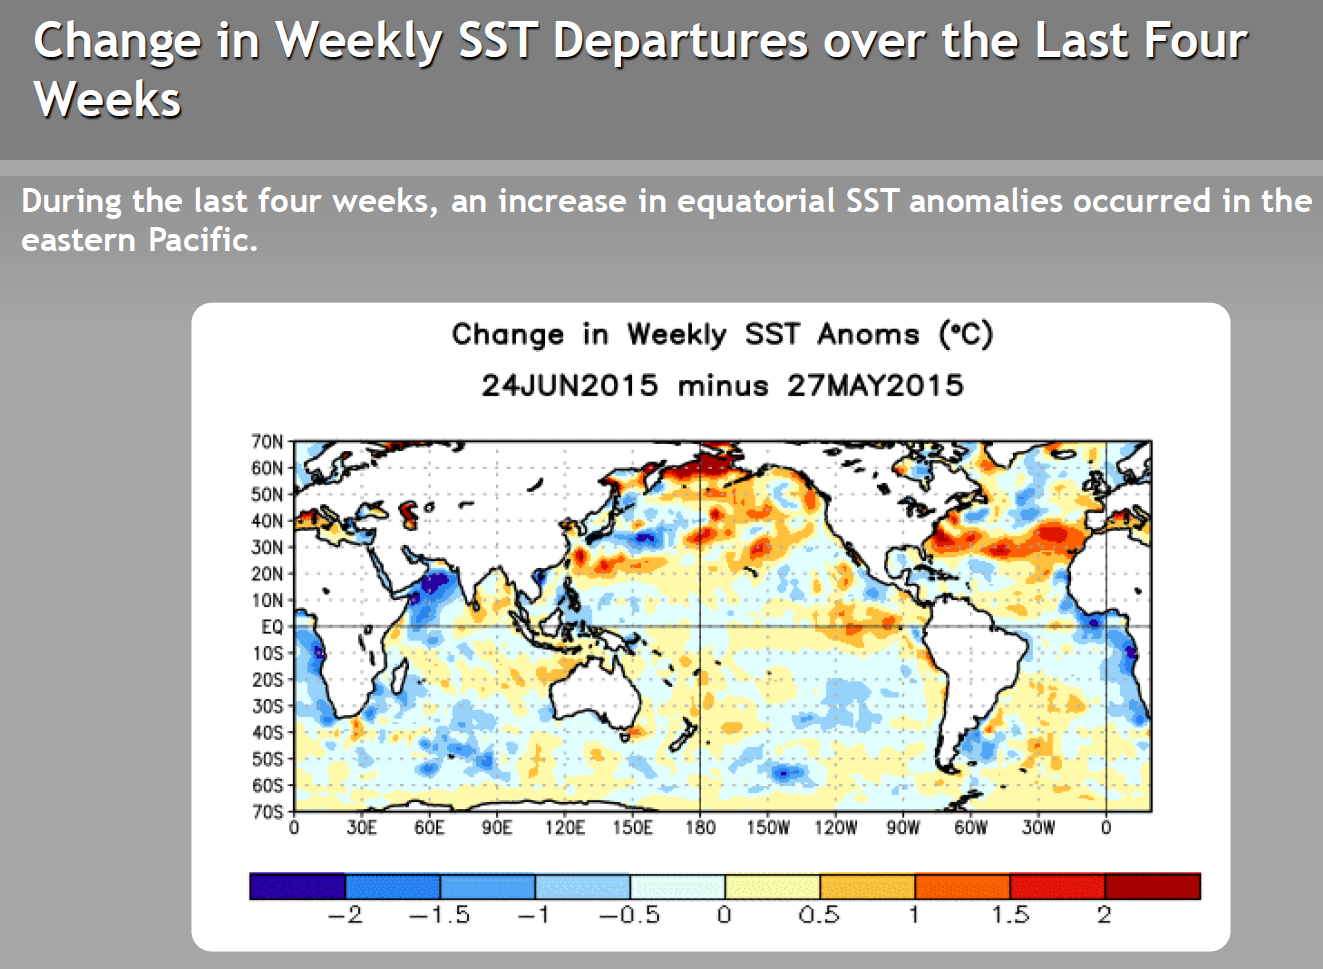
- Status: During June 2015, El Niño conditions were observed as above-average SSTs continued across the western and central equatorial Pacific and continued to be coupled to the tropical atmosphere. Collectively, the atmospheric and oceanic features reflected an ongoing and strengthening El Niño.
- Teleconnections (influence on weather): To the extent teleconnections are known, the typical temperature and precipitation patterns associated with El Niño during June include above-normal precipitation in the Southeast and parts of the Plains to Northern Rockies; below-normal precipitation across the coastal Northwest and northern New England; below-normal temperatures across much of the West; and a mixed temperature anomaly pattern elsewhere.
- Comparison to Observed: The June 2015 temperature anomaly pattern does not agree with that expected historically with an El Niño, but there is some agreement when the historical patterns and recent trends ("composite + trend" map) are compared. Likewise, the June 2015 precipitation anomaly pattern agrees with the historical teleconnections in the coastal Northwest, and from the Midwest to Northeast when the historical patterns and recent trends are compared. But El Niño influences on the weather of the CONUS are minimal during the summer.
-
Madden-Julian Oscillation (MJO)
- Description: The MJO is a tropical disturbance or "wave" that propagates eastward around the global tropics with a cycle on the order of 30-60 days. It is characterized by regions of enhanced and suppressed tropical rainfall. One of its indices is a phase diagram which illustrates the phase (1-8) and amplitude of the MJO on a daily basis. The MJO is categorized into eight "phases" depending on the pattern of the location and intensity of the regions of enhanced and suppressed tropical rainfall. The MJO can enter periods of little or no activity, when it becomes neutral or incoherent and has little influence on the weather. Overall, the MJO tends to be most active during ENSO-neutral years, and is often absent during moderate-to-strong El Niño and La Niña episodes.
- Status: The MJO index was active during June, cycling rapidly through phases 1 through 6. Other modes of coherent subseasonal tropical variability, including the background El Niño state and Kelvin waves, influenced the tropical Pacific and global climate. The MJO destructively interfered with the El Niño base state at mid-month, complicating global precipitation patterns, then constructively interacted with El Niño and Kelvin Waves later in the month, resulting in renewed widespread Pacific convection (MJO updates for June 8, 15, 22, and 29).
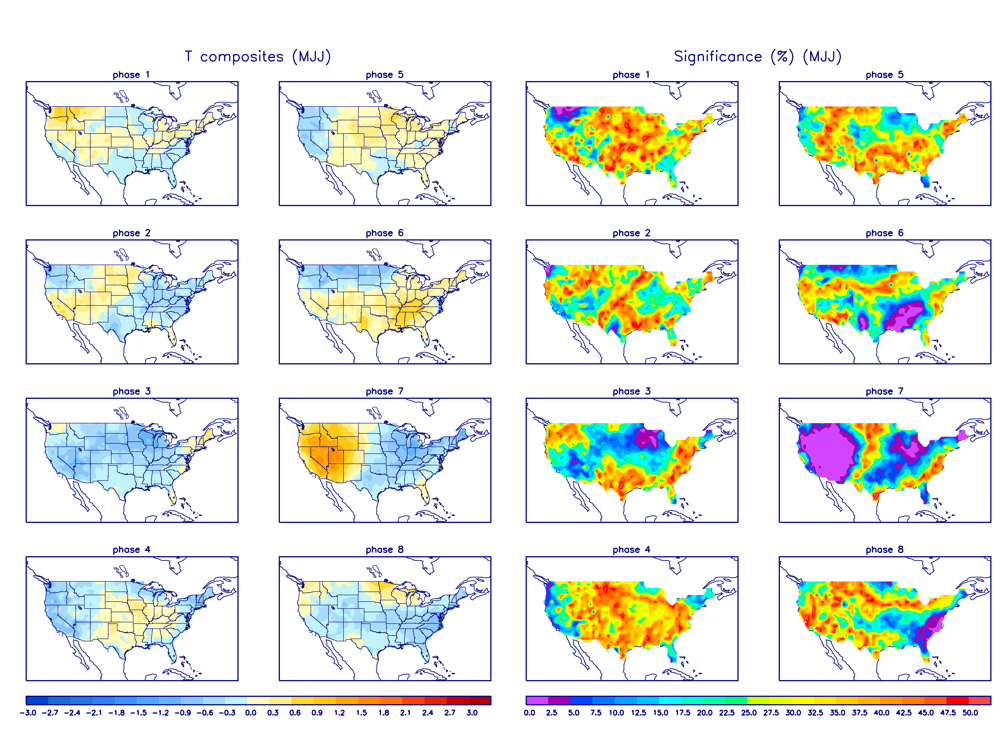
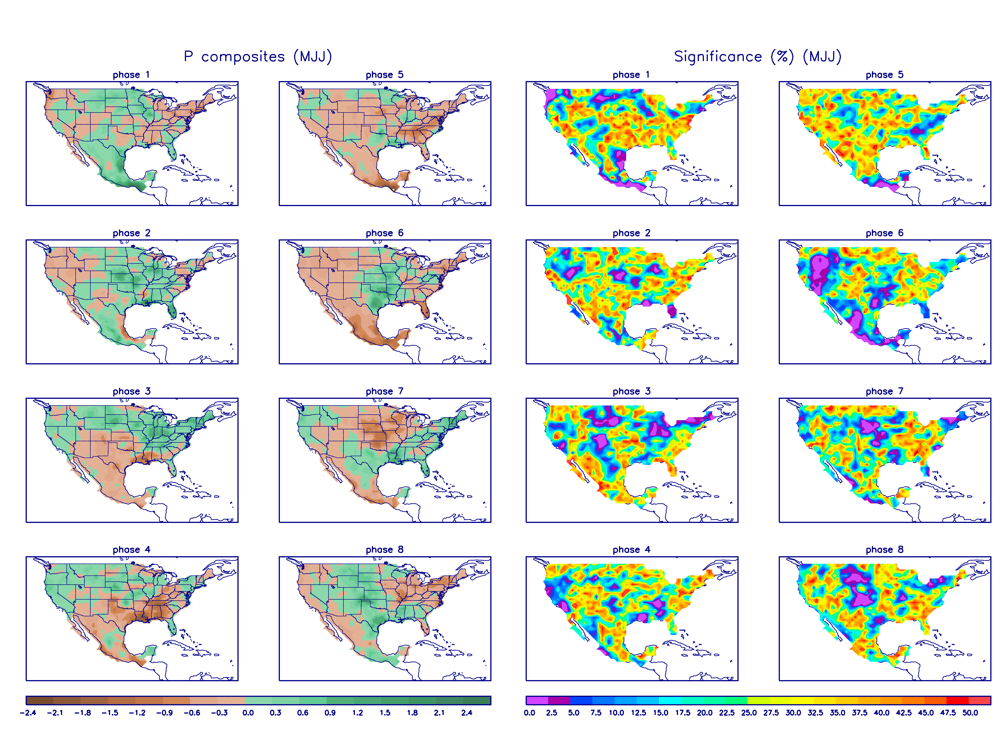
- Teleconnections (influence on weather): The MJO's temperature and precipitation teleconnections to U.S. weather depend on time of year and MJO phase. To the extent teleconnections are known, the May-July teleconnections for temperature are shown here and for precipitation are shown here.
- Comparison to Observed: The MJO is transitory and can change phases (modes) within a month, so it is more closely related to weekly weather patterns than monthly. The June 2015 monthly temperature and weekly (weeks 1, 2, 3, 4) temperature anomaly patterns do not match those expected with MJO phases 1-6. The monthly precipitation anomaly pattern does not match but the weekly (weeks 1, 2, 3, 4, ) precipitation anomaly patterns show some agreement in some areas during some weeks.
- The Pacific/North American (PNA) pattern
- Description: The PNA teleconnection pattern is associated with strong fluctuations in the strength and location of the East Asian jet stream. PNA-related blocking of the jet stream flow in the Pacific can affect weather downstream over North America, especially the West and especially in the winter half of the year.
- Status: The daily PNA index began the month positive, then turned negative at mid-month, and ended the month in positive territory. The monthly index was not available as of this release date.
- Teleconnections (influence on weather): To the extent teleconnections are known, the temperature and upper-level circulation anomaly teleconnection maps for this time of year (July on the teleconnection maps) show little correlation to the PNA during the summer over North America. Likewise for precipitation, although there is a weak signal of positive correlations from Montana to Texas and negative correlations over the Great Lakes.
- Comparison to Observed: The June 2015 temperature, precipitation, and upper-level circulation anomaly patterns do not agree with those expected for either a positive or negative PNA.
- The Arctic Oscillation (AO) pattern
- Description: The AO teleconnection pattern relates upper-level circulation over the Arctic to circulation features over the Northern Hemisphere mid-latitudes and is most active during the cold season.
- Status: The daily AO index was positive to neutral for most of the month, ending the month neutral. The monthly index was not available as of this release date.
- Teleconnections (influence on weather): To the extent teleconnections are known, a positive AO this time of year (May-July) is typically associated with dry conditions across the Northern Rockies and from the Great Plains to the Northeast; wet conditions along the Southeast coast; above-normal temperatures across parts of the West to Central Plains; and upper-level circulation anomalies which are below normal across the Arctic into northern North America and Alaska, and above normal over the northwestern and northeastern CONUS, North Atlantic, and North Pacific.
- Comparison to Observed: The June 2015 monthly upper-level circulation anomaly pattern agrees with those associated with a positive AO, but they are much stronger. The temperature anomaly pattern agrees where there are teleconnections, especially in the West. The precipitation anomaly pattern shows some agreement in the Northwest, but not elsewhere.
- The North Atlantic Oscillation (NAO) pattern
- Description: The NAO teleconnection pattern relates upper-level circulation over the North Atlantic Ocean to circulation features over the Northern Hemisphere mid-latitudes.
- Status: The daily NAO index oscillated around neutral (zero value). The monthly index was not available as of this release date.
- Teleconnections (influence on weather): There are no teleconnections for a neutral NAO.
- Comparison to Observed: The June 2015 precipitation anomaly pattern shows some weak agreement with the teleconnections associated with a negative NAO. The monthly temperature and upper-level circulation anomaly patterns show some agreement with the teleconnections associated with a positive NAO, especially over western North America and the North Atlantic.
- The West Pacific (WP) pattern
- Description: The WP teleconnection pattern is a primary mode of low-frequency variability over the North Pacific and reflects zonal and meridional variations in the location and intensity of the (East Asian) jet stream in the western Pacific.
- Status and Comparison: The WP index was not available this month as of this release date. Nevertheless, the June 2015 monthly temperature anomaly pattern does not match the teleconnections for either a positive or negative WP, and the upper-level circulation anomaly pattern shows some weak agreement with the teleconnection associated with a negative WP.
- The East Pacific-North Pacific (EP-NP) pattern
- Description: The EP-NP teleconnection pattern relates SST and upper-level circulation patterns (geopotential height anomalies) over the eastern and northern Pacific to temperature, precipitation, and circulation anomalies downstream over North America. Its influence during the winter is not as strong as during the other three seasons.
- Status: The June SST pattern showed above-normal SSTs along the North American coast and pockets of cooler-than-normal SSTs in the central North Pacific. The SSTs showed some warming this month in the Gulf of Alaska region and central North Pacific. The EP-NP index was not available this month as of this release date. Nevertheless, the June temperature and upper-level circulation anomaly patterns show some limited agreement with the teleconnections (temperature, upper-level circulation) associated with a positive EP-NP.
Examination of the available circulation indices and their teleconnection patterns, and comparison to observed June 2015 temperature, precipitation, and circulation anomaly patterns, suggest that the weather over the CONUS in June reflected influences from several atmospheric drivers. The El Niño funneled energy and moisture from the eastern equatorial Pacific across Mexico and into the U.S. Southwest, and inhibited development of North Atlantic tropical cyclones. The MJO cycled rapidly through several phases and may have influenced the precipitation pattern in some areas during some weeks. The dryness in the Northwest correlates with the El Niño. Although the monthly index was unavailable, the daily index suggests the AO may have had an influence on temperatures and the upper-level circulation, especially in the West. An assessment of North Pacific influences could not be made due to the absence of the relevant indices.