Note: This Synoptic Discussion describes recent weather events and climate anomalies in relation to the phenomena that cause the weather. These phenomena include the jet stream, fronts and low pressure systems that bring precipitation, high pressure systems that bring dry weather, and the mechanisms which control these features — such as El Niño, La Niña, and other oceanic and atmospheric drivers (PNA, NAO, AO, and others). The report may contain more technical language than other components of the State of the Climate series.
Summary
September 2015 was characterized by a strong El Niño which contributed to an energized upper-level circulation pattern over the contiguous United States (CONUS). Several troughs and ridges migrated through the jet stream flow at northern latitudes, while subtropical high pressure systems dominated the weather at lower latitudes. El Niño-enhanced convection triggered tropical cyclones over the eastern equatorial Pacific, but the circulation pattern directed most of these systems away from the western CONUS. Fronts and weather systems moving in the jet stream flow brought areas of above-normal precipitation to parts of the country, but high pressure ridging kept much of the CONUS drier and warmer than normal and inhibited the occurrence of severe weather. As a result, drought expanded or intensified across the CONUS, but decreased in Alaska, Hawaii, and Puerto Rico where beneficial rains fell. The upper-level circulation, temperature, and precipitation anomaly patterns suggest that the weather and climate of September 2015 were the result largely of atmospheric drivers originating over the Pacific Ocean, with the El Niño playing an important role. See below for details.
Synoptic Discussion
 |
 |
In the Northern Hemisphere, September marks the beginning of climatological fall (autumn) which is the time of year when solar heating decreases as the sun angle decreases, and an expanding circumpolar vortex forces the jet stream to migrate southward. Polar air masses begin to influence the weather over the contiguous U.S. (CONUS) more, and the warm, dry subtropical high pressure belts influence the weather less.
During September 2015, the North Pacific and North Atlantic subtropical high pressure centers maintained their grip across the southern half of the CONUS, while an active upper-level circulation dominated at higher latitudes. Several short-wave troughs and ridges migrated through the jet stream flow, with troughs frequently lingering across western North America. Due to the dynamic nature of the jet stream, this forced ridges to dominate downstream over the central and northeastern CONUS. The jet stream circulation was energized by Pacific tropical cyclones spawned under the influence of a strong El Niño.
The oceanic and atmospheric conditions associated with El Niño enhanced tropical cyclone activity in the eastern and central equatorial Pacific Ocean, while increasing vertical wind shear over the North Atlantic Ocean, which inhibited the development of tropical cyclones in the Atlantic and Caribbean. Seven tropical cyclones and a tropical depression were active in the central and eastern Pacific during September (Tropical Storms Kevin, Malia, and Niala; Hurricane Marty; and Major Hurricanes Ignacio, Jimena, and Linda). Moisture from Hurricane Linda and Tropical Depression Sixteen-E contributed to rainfall over parts of the western CONUS, but most of these systems moved away from North America. Five tropical cyclones and a tropical depression were active in the North Atlantic during September (Tropical Storms Grace, Henri, and Ida; Hurricane Fred; and Major Hurricane Joaquin). None of these affected the CONUS during September.
The Pacific tropical storms and powerful hurricanes that moved northward added their energy to the jet stream flow. This energy propagated downstream over North America, contributing to the vigor of upper-level ridges and troughs over the CONUS. These complex interactions in the upper atmosphere were reflected in stronger indices for the Pacific-based teleconnection patterns — the Pacific-North America (PNA) and East Pacific-North Pacific (EP-NP) patterns.
Although cool fronts brought occasional Pacific and Canadian air masses across the CONUS, the dominance of the subtropical high pressure systems and jet stream ridges kept monthly average temperatures well above normal. Monthly temperatures were below normal only in Alaska and parts of the Northwest, which were dominated by jet stream troughs, and parts of the Southeast, where upper-level lows and surface cool fronts frequently passed. By the end of the month, there were 4,506 record warm daily high (1,611) and low (2,895) temperature records, which is about five and a half times the 802 record cold daily high (461) and low (341) temperature records. Nine states — from the Southwest to Great Lakes and Northeast — had a record warm September, and the CONUS ranked second warmest nationally. The REDTI (Residential Energy Demand Temperature Index) for September 2015 ranked ninth highest for September, illustrating how the unusually warm temperatures increased cooling demands.
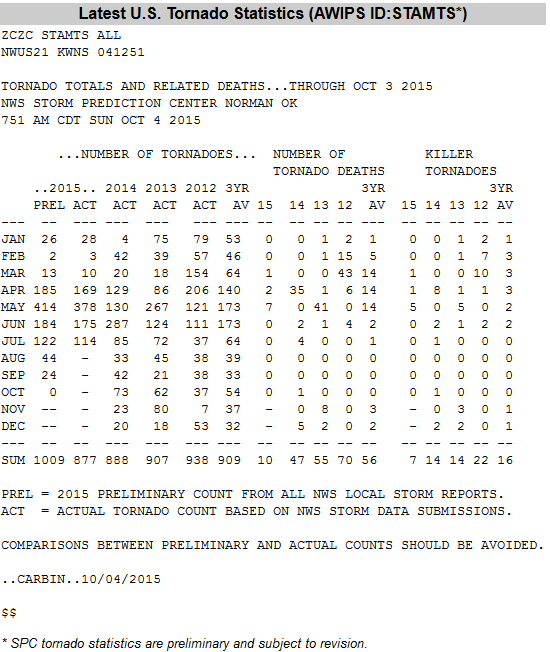
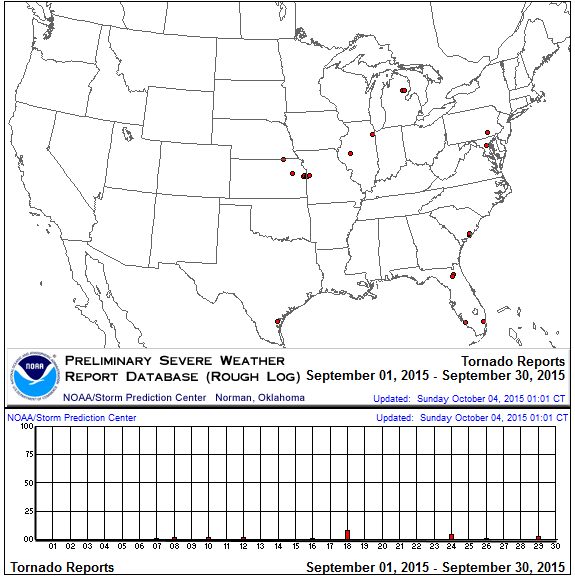
With subsiding air associated with the subtropical highs generally inhibiting convection and frontal rains, showers and thunderstorms were more localized and severe weather was reduced. Only 24 tornadoes occurred nationwide (according to preliminary reports), which is well below the September average of 74.
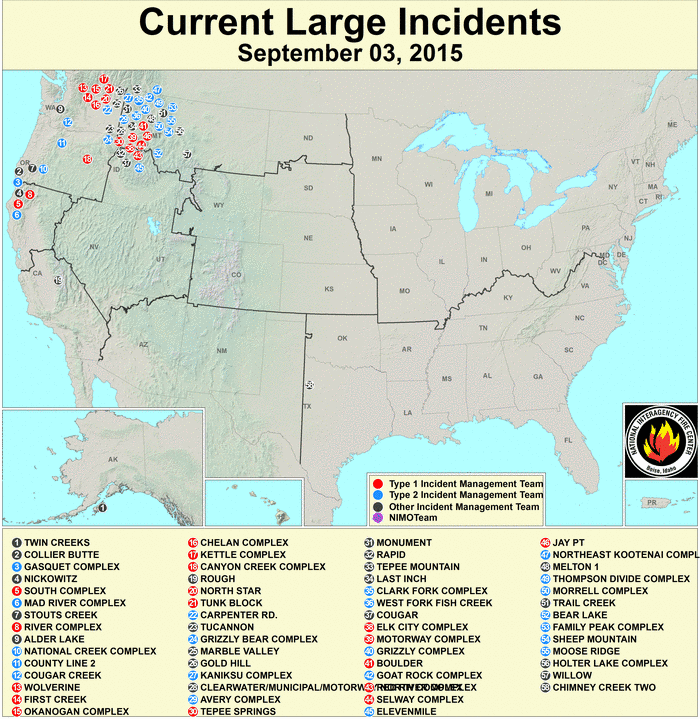
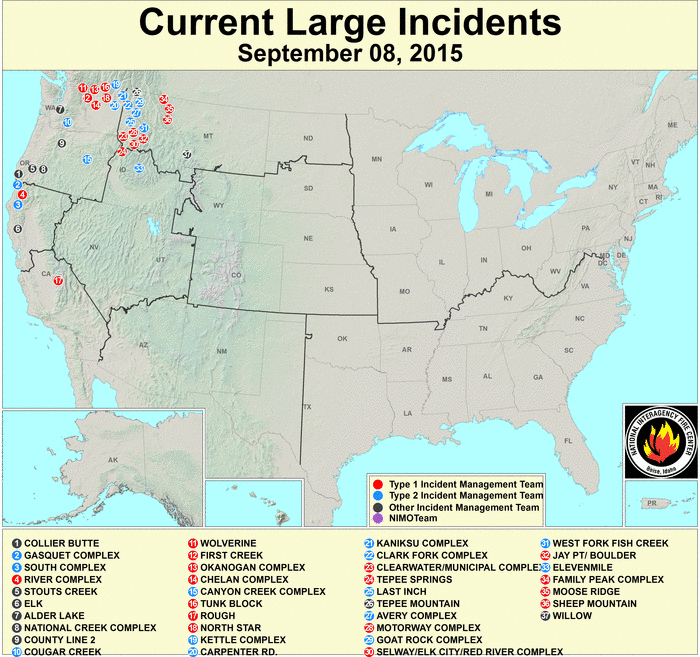
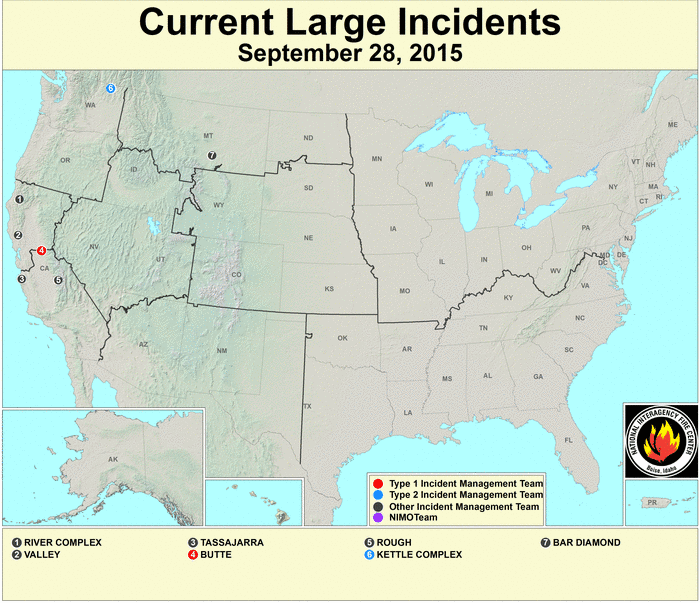
Cooler temperatures and rain from troughs and fronts helped reduce the number of large wildfires in the Northwest and Far West (maps for September 3, 8, 15, 28). By the end of the month, the large fires in the West had been mostly extinguished, although several large wildfires had developed in the Southern Plains and Lower Mississippi Valley where warm and dry weather dominated.
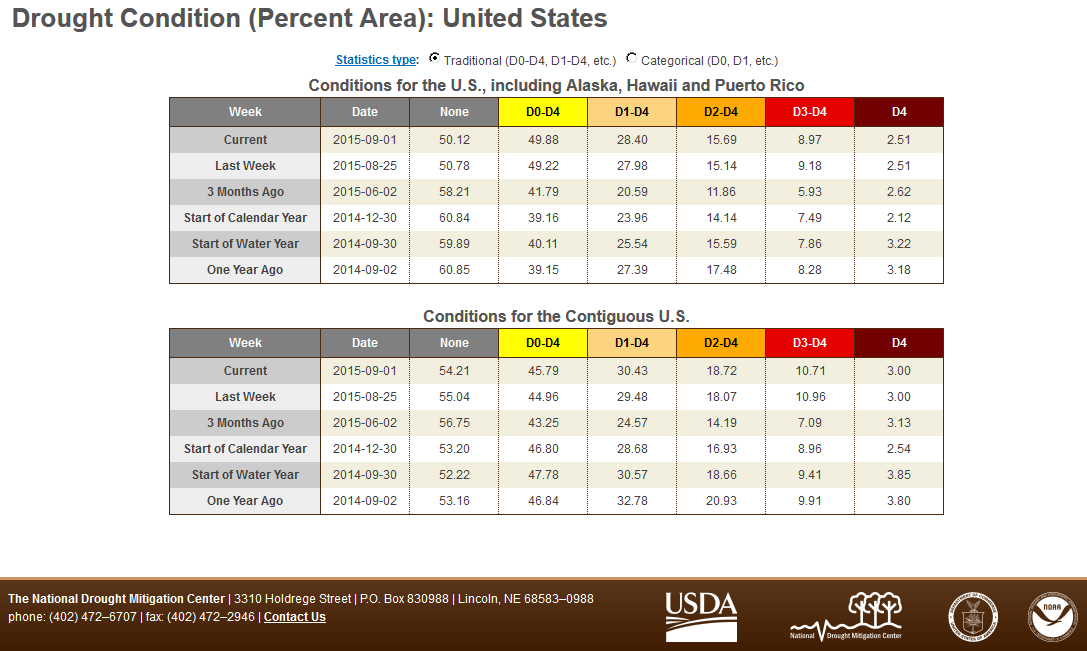
Frontal passages and low pressure systems brought areas of above-normal precipitation to parts of the West, Central and Northern Plains, and East, contracting drought in parts of the Southeast, Gulf of Mexico Coast, and West. But stable air associated with the highs and ridges kept much of the country drier than normal, with drought and abnormal dryness expanding in parts of the Plains, Lower Mississippi Valley, Ohio Valley, and Northeast. This resulted in a slight increase of the drought area over the CONUS, from 30.4 percent at the end of August to 31.4 percent at the end of September. But above-normal precipitation in Alaska, Hawaii, and Puerto Rico contracted drought in these areas, causing the drought area for all of the U.S. to decrease to 26.8 percent. Nationally, September 2015 ranked as the 21st driest September in the 1895-2015 record.
The Climate Extremes Index (CEI) aggregates temperature and precipitation extremes across space and time. Several parts of the U.S. experienced temperature and precipitation extremes during September. These included the Southwest region which had the eighth most extreme September CEI on record due to the second most extreme warm minimum and sixth most extreme warm maximum temperature components, and eighth most extreme 1-day precipitation component (due to rain from the remnants of Hurricane Linda and Tropical Depression Sixteen-E). The Northeast region had the fourth most extreme September CEI on record due to the second most extreme warm minimum and warm maximum temperature components. The East North Central region had the fourth most extreme September CEI on record due to the most extreme warm minimum and fourth most extreme warm maximum temperature components, and twelfth most extreme 1-day precipitation component. The West region had the third most extreme September CEI on record due to the fifth most extreme warm minimum and twelfth most extreme warm maximum temperature components, second most extreme drought component, and third most extreme 1-day precipitation component. (It's ironic that the 1-day extreme precipitation component contributed so heavily to the regional CEI. Since this is the dry season for the West region, any precipitation will not have much effect on drought, but any precipitation that falls will be highly unusual in itself simply because it is the dry season.) When aggregated across the nation, September 2015 had the fifth most extreme national September CEI on record, due to the second most extreme warm minimum and third most extreme warm maximum temperature components, and tenth most extreme 1-day precipitation component.
 North America monthly upper-level circulation pattern and anomalies. Troughs and ridges migrated through the jet stream flow at higher latitudes while the North Pacific and North Atlantic subtropical highs dominated at the lower latitudes in the CONUS. The troughs tended to favor western North America, resulting in a below-normal 500-mb height anomaly pattern over Alaska, western Canada, and the Pacific Northwest. The dominance of the subtropical highs, plus ridging in the jet stream, resulted in an above-normal 500-mb height anomaly pattern that stretched from the Southwest to eastern Canada. The 500-mb height anomalies were also above-normal over the northwestern North Pacific. |
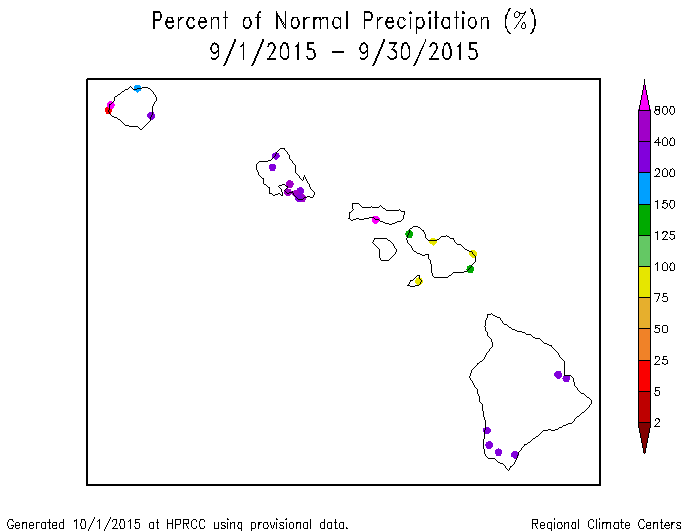
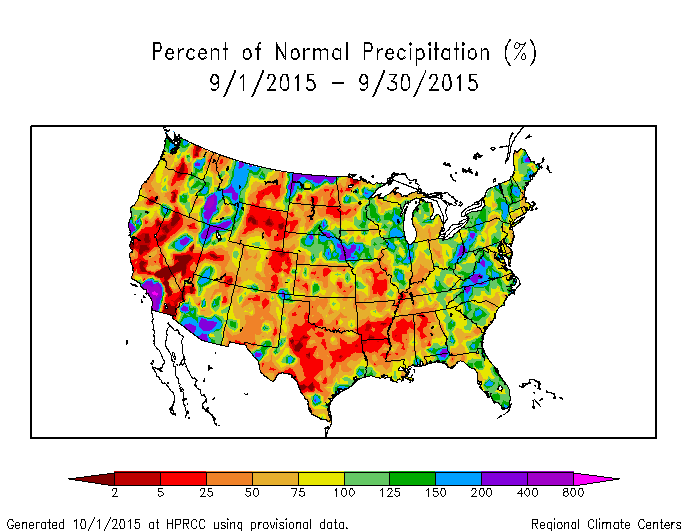 Map of monthly precipitation anomalies. Drier-than-normal monthly precipitation anomalies dominated across much of the Plains, Deep South, and West. September was wetter than normal in parts of the East, Central Plains, West, and Alaska, and much of Hawaii. The El Niño-enhanced dry spell continued to afflict much of the Caribbean. Puerto Rico was drier than normal in the south and east, while showers brought above-normal rainfall to the northwest. |
 Map of monthly temperature anomalies. September 2015 averaged cooler than normal in the Pacific Northwest, parts of the Southeast, and Alaska, and warmer than normal across the rest of the country, especially from the Plains to the Great Lakes and Northeast. |
Northern Hemisphere monthly upper-level circulation pattern and anomalies.
Atmospheric Drivers
Subtropical highs, and fronts and low pressure systems moving in the mid-latitude storm track flow, are influenced by the broadscale atmospheric circulation. The circulation of the atmosphere can be analyzed and categorized into specific patterns. The Tropics, especially the equatorial Pacific Ocean, provides abundant heat energy which largely drives the world's atmospheric and oceanic circulation. The following describes several of these modes or patterns of the atmospheric circulation, their drivers, the temperature and precipitation patterns (or teleconnections) associated with them, and their index values this month:
-
El Niño Southern Oscillation (ENSO)
- Description: Oceanic and atmospheric conditions in the tropical Pacific Ocean can influence weather across the globe. ENSO is characterized by two extreme modes: El Niño (warmer-than-normal sea surface temperature [SST] anomalies in the tropical Pacific) and La Niña (cooler-than-normal SST anomalies), with the absence of either of these modes termed "ENSO-neutral" conditions.
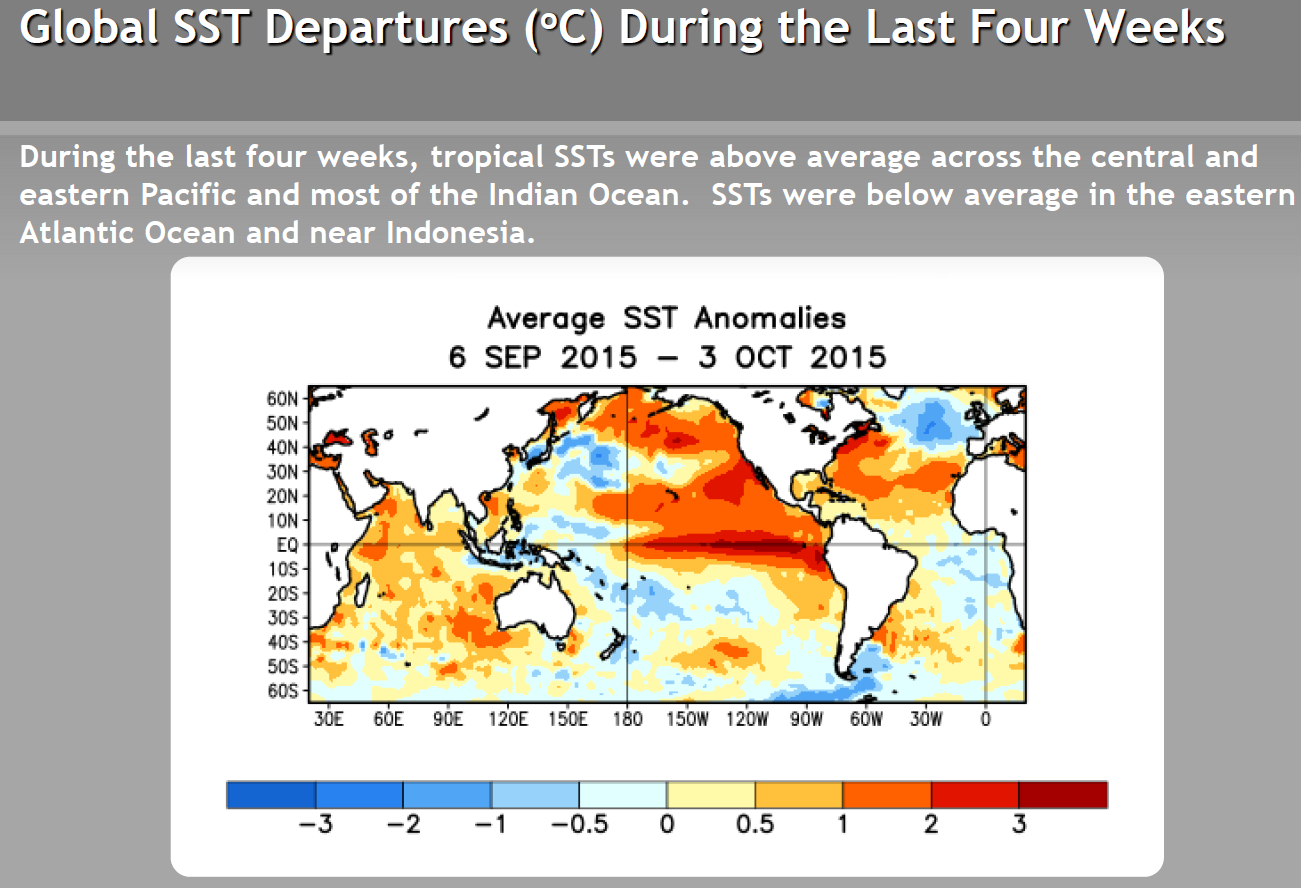
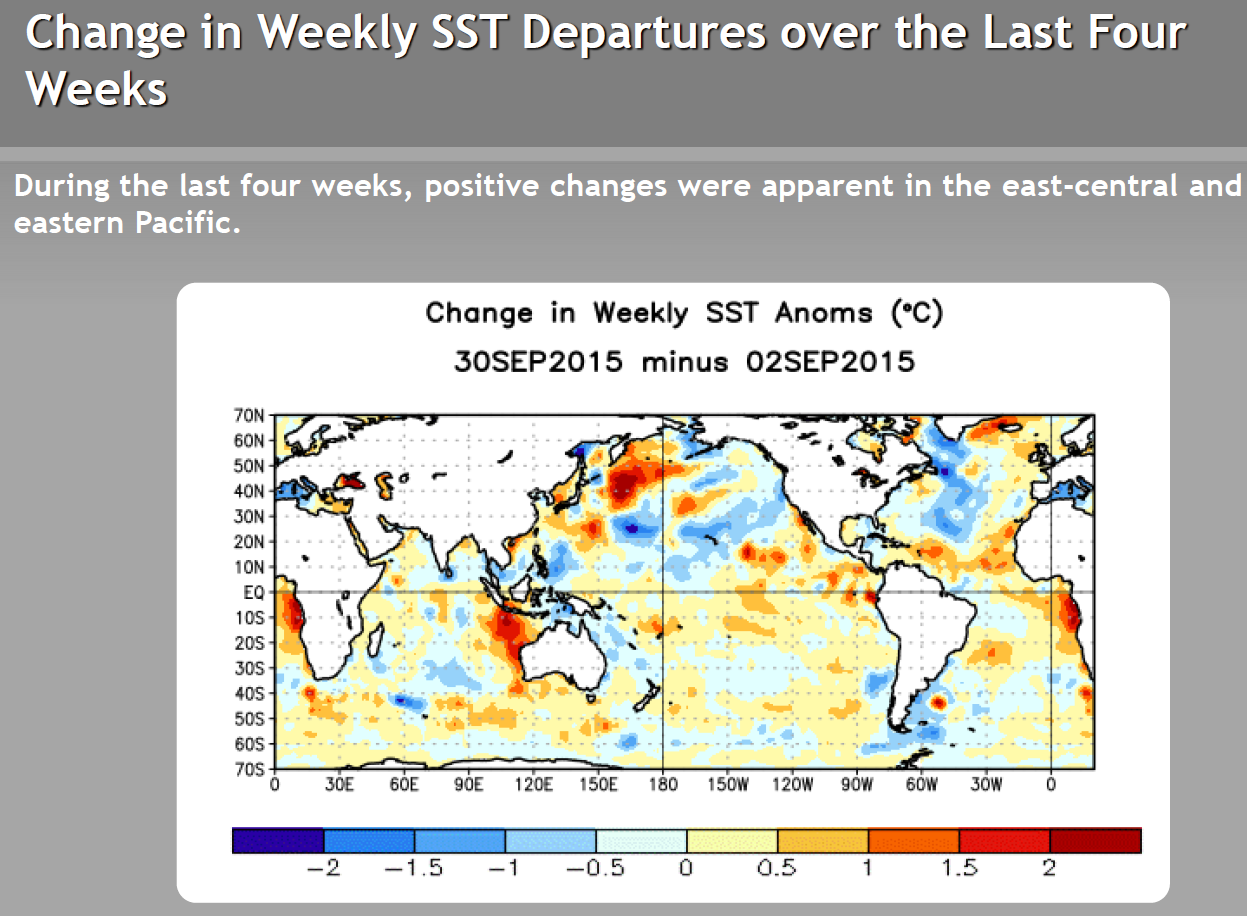
- Status: During September 2015, El Niño conditions were observed as above-average SSTs continued across the western and central equatorial Pacific and continued to be coupled to the tropical atmosphere. Collectively, the atmospheric and oceanic features reflected strong El Niño.
- Teleconnections (influence on weather): To the extent teleconnections are known, the typical temperature and precipitation patterns associated with El Niño during September include above-normal precipitation in parts of the Central and Northern Plains, Northwest, Southern California, Tennessee Valley, and Southeast; below-normal precipitation across the Mid-Atlantic region, Great Lakes, and Southern Plains; and near- to below-normal temperatures across much of the CONUS except the Southern Plains, although there is a trend toward warmer-than-normal temperatures for much of the CONUS.
- Comparison to Observed: The September 2015 precipitation anomaly pattern is a good match with that expected historically with an El Niño, but the temperature anomaly pattern does not match.
-
Madden-Julian Oscillation (MJO)
- Description: The MJO is a tropical disturbance or "wave" that propagates eastward around the global tropics with a cycle on the order of 30-60 days. It is characterized by regions of enhanced and suppressed tropical rainfall. One of its indices is a phase diagram which illustrates the phase (1-8) and amplitude of the MJO on a daily basis. The MJO is categorized into eight "phases" depending on the pattern of the location and intensity of the regions of enhanced and suppressed tropical rainfall. The MJO can enter periods of little or no activity, when it becomes neutral or incoherent and has little influence on the weather. Overall, the MJO tends to be most active during ENSO-neutral years, and is often absent during moderate-to-strong El Niño and La Niña episodes.
- Status: The MJO index stayed inside the center circle for most of September, indicating an incoherent signal. Other modes of coherent subseasonal tropical variability, including the background El Niño state, tropical cyclone activity, and Kelvin waves, influenced the tropical Pacific and global climate (MJO updates for September 7, 14, 21, and 28).
- Teleconnections (influence on weather): There are no teleconnections for an incoherent MJO.
- The Pacific/North American (PNA) pattern
- Description: The PNA teleconnection pattern is associated with strong fluctuations in the strength and location of the East Asian jet stream. PNA-related blocking of the jet stream flow in the Pacific can affect weather downstream over North America, especially the West and especially in the winter half of the year.
- Status: The daily PNA index began and ended the month slightly positive, but spent most of the days in negative territory, and and averaged negative for the month as a whole. The 3-month-averaged index was near zero to slightly negative.
- Teleconnections (influence on weather): To the extent teleconnections are known, a negative PNA for this time of year (October on the teleconnection maps) is correlated with below-normal temperatures over Alaska, western Canada, and the extreme western CONUS; warm temperature anomalies over the Southern Plains and Southeast; below-normal upper-level circulation anomalies over western North America; and above-normal circulation anomalies over the Southern Plains to East Coast and the north central North Pacific. The precipitation teleconnection map shows little correlation to the PNA except for a hint of wet anomalies over the Midwest.
- Comparison to Observed: The September 2015 temperature and upper-level circulation anomaly patterns are a good match for the teleconnections for a negative PNA, except they seem shifted to the west a bit over North America. The September 2015 precipitation anomaly pattern agrees in the Midwest, but few correlations exist.
- The Arctic Oscillation (AO) pattern
- Description: The AO teleconnection pattern relates upper-level circulation over the Arctic to circulation features over the Northern Hemisphere mid-latitudes and is most active during the cold season.
- Status: The daily AO index was mostly neutral (near zero) throughout the month, averaging slightly negative for the month. The 3-month-averaged index was strongly negative, reflecting the influence of the previous two months.
- Teleconnections (influence on weather): To the extent teleconnections are known, a negative AO this time of year (August-October) is typically associated with dry conditions in the Southern Plains, Southeast, and Midwest; wet conditions in parts of the Central Plains and Southern Florida; below-normal temperatures across parts of the Northern Plains; above-normal temperatures in part of Texas; and upper-level circulation anomalies which are below normal in the North Central Pacific, southeastern Canada, the northeastern CONUS, and across the North Atlantic, and above normal over the Arctic Ocean and Greenland. For temperature and precipitation, most of the country has little correlation to the AO this time of year.
- Comparison to Observed: The September 2015 monthly precipitation anomaly pattern generally agrees where there are teleconnections. The temperature anomaly pattern agrees over Texas, but few teleconnections exist for this time of year. The upper-level circulation anomaly pattern shows no agreement.
- The North Atlantic Oscillation (NAO) pattern
- Description: The NAO teleconnection pattern relates upper-level circulation over the North Atlantic Ocean to circulation features over the Northern Hemisphere mid-latitudes.
- Status: The daily NAO index was slightly negative for most of September, ending the month positive, and averaging negative for the month. The 3-month-averaged index was strongly negative, reflecting the influence of the previous two months.
- Teleconnections (influence on weather): To the extent teleconnections are known, a negative NAO during this time of year (October on the teleconnection maps) is associated with below-normal upper-level circulation anomalies over the eastern CONUS. There are no temperature teleconnections, and the precipitation teleconnections are very weak, with the Ohio Valley drier than normal.
- Comparison to Observed: The September 2015 temperature, precipitation, and upper-level circulation anomaly patterns either show little agreement or have few or no teleconnections with a negative NAO.
- The West Pacific (WP) pattern
- Description: The WP teleconnection pattern is a primary mode of low-frequency variability over the North Pacific and reflects zonal and meridional variations in the location and intensity of the (East Asian) jet stream in the western Pacific.
- Status: Both the monthly WP index and three-month average WP index were negative.
- Teleconnections (influence on weather): To the extent teleconnections are known, a negative WP during this time of year (October on the maps) is typically associated with below-normal temperatures in the Central to Northern Plains; above-normal precipitation in the Northwest, Upper Midwest, and Deep South; below-normal circulation anomalies over central Canada and the north central CONUS, and above-normal circulation anomalies over the eastern North Pacific just off the West Coast.
- Comparison to Observed: The September 2015 monthly temperature, precipitation, and upper-level circulation anomaly patterns show little agreement with a negative WP.
- The Pacific Transition (PT) pattern
- Description: The PT teleconnection pattern relates upper-level circulation over the central subtropical North Pacific to circulation features over North America. It is a significant factor in the earth's circulation during August and September.
- Status: The PT index was near zero during September.
- Teleconnections (influence on weather): There are no teleconnections for a neutral PT.
- The East Pacific-North Pacific (EP-NP) pattern
- Description: The EP-NP teleconnection pattern relates SST and upper-level circulation patterns (geopotential height anomalies) over the eastern and northern Pacific to temperature, precipitation, and circulation anomalies downstream over North America. Its influence during the winter is not as strong as during the other three seasons.
- Status: The September SST pattern showed a continuation of widespread above-normal SSTs in the North Pacific from the International Dateline to North America and pockets of cooler-than-normal SSTs west of the Dateline, but the SSTs continued to cool across much of the eastern North Pacific, and warm in the western North Pacific. The monthly EP-NP index was negative during September, while the 3-month running mean was slightly negative.
- Teleconnections (influence on weather): To the extent teleconnections are known, a negative EP-NP index during this time of year (October on the maps) is typically associated with warmer-than-normal temperatures across central to eastern Canada, across the CONUS east of the Rockies (except for the Southeast), and cooler-than-normal temperatures across Alaska and the extreme West Coast of the CONUS; below-normal upper-level circulation anomalies (weaker upper-level ridge) over Alaska and western Canada, and above-normal upper-level circulation anomalies (weaker upper-level trough) over the CONUS east of the Rockies, eastern Canada, and the central North Pacific. The precipitation teleconnections are too weak to be mapped in any detail.
- Comparison to Observed: The September 2015 temperature and upper-level circulation anomaly patterns show good agreement with the teleconnections for a negative EP-NP.
Examination of the available circulation indices and their teleconnection patterns, and comparison to observed September 2015 temperature, precipitation, and circulation anomaly patterns, suggest that the weather over the CONUS in September reflected influences largely from Pacific atmospheric drivers. The MJO and PT indices were near zero or neutral, indicating that their associated drivers had little effect on the weather in North America this month. The WP showed little correlation with the September anomaly patterns, suggesting its drivers had little influence on September's weather over the CONUS. The teleconnections associated with the AO and NAO are weak or non-existent for temperature and precipitation this time of year, and the precipitation teleconnections for the PNA and EP-NP are weak. Nevertheless, the September 2015 precipitation anomaly pattern matches the teleconnections, where they exist, for the PNA and AO, which could reflect an influence of these drivers or could be coincidence. There are stronger teleconnections between precipitation and El Niño this time of year, and the September 2015 precipitation anomaly pattern was a good match, suggesting that El Niño had a major influence. The temperature anomaly pattern for September 2015 did not match that expected with El Niño, but it did match those expected with the PNA and EP-NP drivers. The upper-level circulation anomaly pattern also matched, suggesting that the atmospheric drivers behind the PNA and EP-NP strongly influenced September 2015's temperature.
The El Niño created atmospheric and oceanic conditions that enhanced the development of tropical storms and hurricanes in the eastern and central tropical Pacific Ocean. Many of these tropical cyclones moved into the North Pacific, transferring energy into the mid-latitude circulation and mixing the waters at the sea surface. This energy likely contributed to the influence of the drivers behind the EP-NP and PNA.
This month illustrates how the weather and climate anomaly patterns can reflect the combined influence of several atmospheric drivers (or modes of atmospheric variability), but also how one driver can be the primary motivator behind the month's weather.