Note: This Synoptic Discussion describes recent weather events and climate anomalies in relation to the phenomena that cause the weather. These phenomena include the jet stream, fronts and low pressure systems that bring precipitation, high pressure systems that bring dry weather, and the mechanisms which control these features — such as El Niño, La Niña, and other oceanic and atmospheric drivers (PNA, NAO, AO, and others). The report may contain more technical language than other components of the State of the Climate series.
Summary
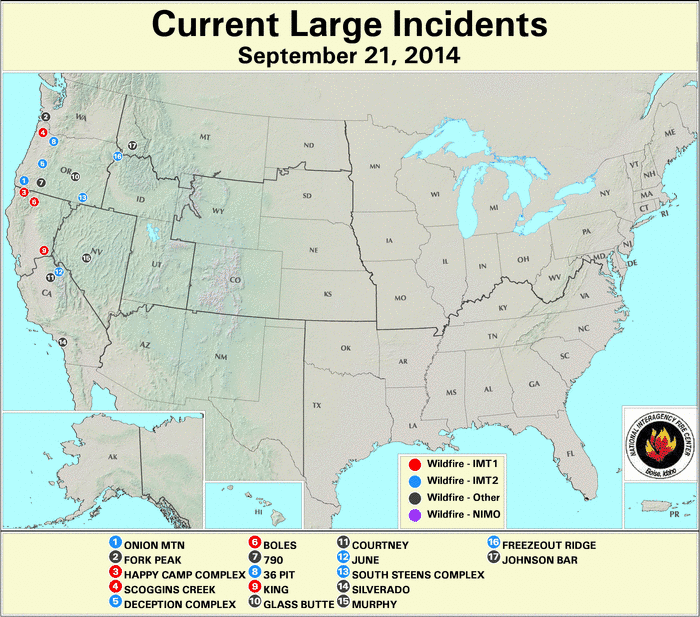
Like most of the rest of the year, September 2014 was characterized by an active jet stream with many vigorous short-wave troughs and ridges migrating through the upper-level circulation over the contiguous United States (CONUS), with much variability throughout the month. The competition between cool fronts beneath the troughs and warmer air associated with the ridges produced a net result of warmer-than-normal temperature anomalies in the West and cooler-than-normal temperature anomalies in the central U.S., with a mixed pattern in the South and East. Tropical moisture and the jet stream circulation helped feed monsoon showers which dumped moisture over large parts of the West, helping to combat large wildfires and to reduce drought. Fronts and surface low pressure systems, associated with the jet stream troughs, brought above-normal rainfall to parts of the Plains, Midwest, and Southeast, along with areas of severe weather, but the month was largely drier than normal east of the Rockies beneath dominating ridges which inhibited severe weather outbreaks and spurred the growth of drought and abnormally dry areas. The net result was a contraction in the national drought footprint. The upper-level circulation pattern, and temperature and precipitation patterns, suggest that the weather and climate of September 2014 were influenced, in part, by modes of variability associated with conditions in the North Pacific, Arctic, and equatorial Pacific oceans, but that normal random variability of the atmosphere also played a role. See below for details.
Synoptic Discussion
 Animation of daily upper-level circulation for the month. In the Northern Hemisphere, September is the beginning of climatological fall (autumn) which is the time of year when solar heating decreases as the sun angle decreases, and an expanding circumpolar vortex forces the jet stream to migrate southward. Polar air masses begin to influence the weather more, and the warm, dry subtropical high pressure belts influence the weather less. In September 2014, a long-wave pattern consisting of a ridge in the west and trough in the east dominated the circulation for most of the month, with an active jet stream sending many vigorous short-wave troughs and ridges through the upper-level circulation. The pattern changed (or "flipped") near the end of the month when a large upper-level trough/cutoff low moved slowly across the western CONUS, forcing a long-wave ridge over the central to eastern CONUS. |
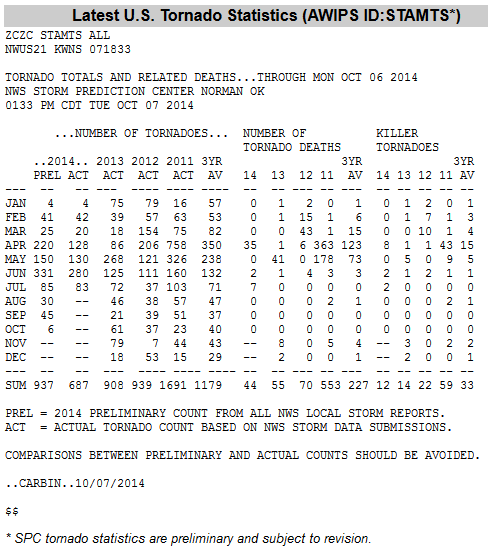
 Animation of daily surface fronts and pressure systems for the month. These upper-level weather systems generated low pressure systems with their associated cold fronts at the surface — warm air flowed ahead of the lows, with cooler air surging southward behind them. The competition between cool fronts beneath the troughs and warmer air associated with the ridges, as well as the "flip" in the circulation pattern near the end of the month, caused the temperature pattern to change week to week (weeks 1, 2, 3, 4, 5). Cold anomalies in the central U.S. beneath the trough by mid-month were gradually eroded by warmer air beneath a ridge as the month progressed (September 1-17, September 1-25, September 1-27, September 1-29), resulting in a mixed pattern of monthly temperature anomalies. This seesaw of warm and cold fronts produced 4,285 record warm daily high (1,091) and low (3,194) temperature records and about two-thirds as many (2,869) record cold daily high (2,122) and low (747) temperature records. This was reflected in the national monthly average temperature which ranked September 2014 as the 26th warmest September in the 1895-2014 record. The fronts and surface low pressure systems, associated with the jet stream troughs, brought frequent days with rain and above-normal monthly total rainfall to parts of the Southern Plains, Upper Midwest, and Coastal Southeast. Subsiding air beneath upper-level ridges, especially near the end of the month, dominated the rest of the country east of the Rockies, keeping precipitation below normal and contributing to expansion of drought in the South and East. Tropical moisture, and the cutoff low near the end of the month, powered monsoon showers which dumped precipitation over much of the Southwest and Intermountain Basin. This contracted drought where it rained, but the precipitation generally missed southern California and large parts of the Northwest. At mid-month, the remnants of Hurricane Odile deluged parts of the southern Arizona, southern New Mexico, and western Texas with flooding rains which helped refill low reservoirs. The upper-level trough/cutoff low helped reduce the number of large wildfires which were scorching the West. Parts of California received precipitation from the upper-level trough, but moisture deficits were so large that the rain had little effect on the drought. The net change in drought area was a contraction of the moderate to exceptional national drought footprint compared to the end of August. The Climate Extremes Index (CEI) aggregates temperature and precipitation extremes across space and time. While the aggregated national CEI for September ranked slightly below average, the regional CEI reflected the extreme weather out west. The highest warm minimum temperature component, eighth most extreme drought component, and 13th highest warm maximum temperature component contributed to the seventh most extreme September CEI for the West region. The persistence of the unusual warmth and dryness gave the West region the most extreme July-September and January-September CEI in the 1910-2014 record, and second most extreme April-September CEI. At this time of year, energy is needed both to heat homes in the north as cold air masses begin their southward trek, and to cool homes in regions where warm ridges still dominate the weather, as in the West during this month. With a mixed temperature anomaly pattern across the country and throughout the month, the energy needs for the nation as a whole were slightly higher than average, with the September 2014 REDTI (Residential Energy Demand Temperature Index) ranking as the 37th highest September REDTI in the 120-year record. Areas of severe weather developed ahead of the troughs, especially early in the month. But the migratory nature of the ridges and troughs in the upper-level circulation, as well as the large ridge near the end of the month, kept the total number of tornadoes below normal, with a preliminary count of 45 tornadoes comparing to the average count of 74 tornadoes for September. The circulation pattern also helped to deflect the two North Atlantic tropical systems (Tropical Storm Dolly and Hurricane Edouard) away from the CONUS. |
 Monthly upper-level circulation pattern and anomalies. When integrated across the month, the atmospheric circulation produced a pattern of above-normal 500-mb heights (stronger-than-normal long-wave ridge) over southern Alaska, the Gulf of Alaska, western Canada, and the U.S. Rocky Mountains, and another area of above-normal heights (weaker-than-normal long-wave trough) over the northeast U.S. and into the North Atlantic. The circulation pattern consisted of below-normal 500-mb heights over the northern Canadian Arctic islands (Canadian Archipelago) to Greenland. This anomaly pattern masks the large variability in the circulation which resulted from the numerous short-wave ridges and troughs that migrated through the westerly flow. |
 Map of monthly precipitation anomalies. Above-normal precipitation fell across much of the West, parts of the Plains to Midwest, and parts of the coastal Southeast. Precipitation was below normal across parts of the Northwest, Southwest, and southern California; large parts of the Great Plains and Deep South; and the Northeast. The precipitation pattern over Alaska and Hawaii was mixed. |
 Map of monthly temperature anomalies. The frequent passage of cool short-wave troughs and warm short-wave ridges across the CONUS, and the "flip" in the long-wave pattern, resulted in a mixed temperature anomaly pattern. Temperatures generally averaged below normal in parts of the Central to Northern Plains and much of the Midwest. September temperatures were near to above normal across much of the West and parts of the Southern Plains to Southeast. Alaska averaged warmer than normal in the south and east, and cooler than normal in parts of the interior. |
Global Linkages: The upper-level circulation over North America is part of the hemispheric mid-latitude westerly circulation. The circulation anomaly pattern over North America matches up with the anomaly pattern over Eurasia. The September mid-latitude (jet stream) pattern across the Northern Hemisphere consisted of two large centers of negative anomalies — one over northeast Canada and Greenland, and the other over north central Siberia — with two large areas of positive anomalies in between — one over Europe and the other extending from northeast Siberia to western North America. Above-normal 500-mb heights, associated with ridging in the upper atmosphere, were reflected by above-normal temperatures at the surface over Europe and northwestern Siberia to western North America. Below-normal 500-mb heights, associated with troughs in the upper atmosphere, were reflected by below-normal temperatures and above-normal precipitation at the surface over central to north central Siberia.
Atmospheric Drivers
Subtropical highs, and fronts and low pressure systems moving in the mid-latitude storm track flow, are influenced by the broadscale atmospheric circulation. The circulation of the atmosphere can be analyzed and categorized into specific patterns. The tropics, especially the equatorial Pacific Ocean, provides abundant heat energy which largely drives the world's atmospheric and oceanic circulation. The following describes several of these modes or patterns of the atmospheric circulation, their drivers, the temperature and precipitation patterns (or teleconnections) associated with them, and their index values this month:
-
El Niño Southern Oscillation (ENSO)
- Description: Oceanic and atmospheric conditions in the tropical Pacific Ocean can influence weather across the globe. ENSO is characterized by two extreme modes: El Niño (warmer-than-normal sea surface temperature [SST] anomalies in the tropical Pacific) and La Niña (cooler-than-normal SST anomalies), with the absence of either of these modes termed "ENSO-neutral" conditions.
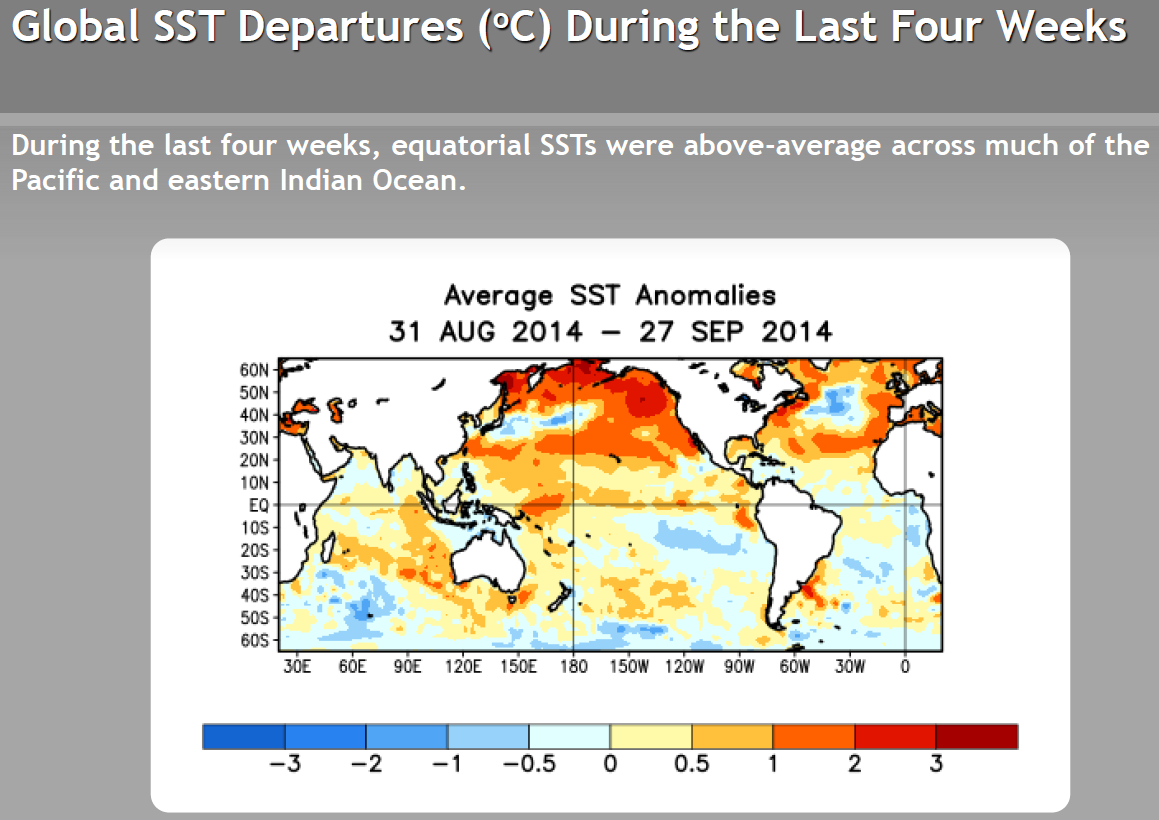
- Status: Ocean temperatures and atmospheric circulation anomalies indicated that the equatorial Pacific continued in an ENSO-neutral state during September. The SST anomalies remained warmer than average across the equatorial Pacific, but the collective atmospheric and oceanic conditions still reflect ENSO-neutral conditions.
- Teleconnections (influence on weather): To the extent teleconnections are known, while in a neutral state, ENSO normally is not a player in the month's weather. Historical data has been analyzed by NOAA to show typical temperature and precipitation patterns associated with El Niño and La Niña ENSO episodes. Teleconnections are not available for ENSO-neutral conditions at that NOAA web site. If an El Niño were happening during September, the typical precipitation pattern would consist of wetter-than-normal conditions in the Central Plains to Northern High Plains, Northwest, and much of the Southeast, and drier-than-normal conditions in the Southern Plains, Upper Midwest, and much of the East Coast. The typical temperature pattern would consist of below-normal temperatures in much of the West, Northern Plains, Midwest, and Northeast.
- Comparison to Observed: The September 2014 precipitation and temperature anomaly patterns show little resemblance to those expected with an El Niño.
-
Madden-Julian Oscillation (MJO)
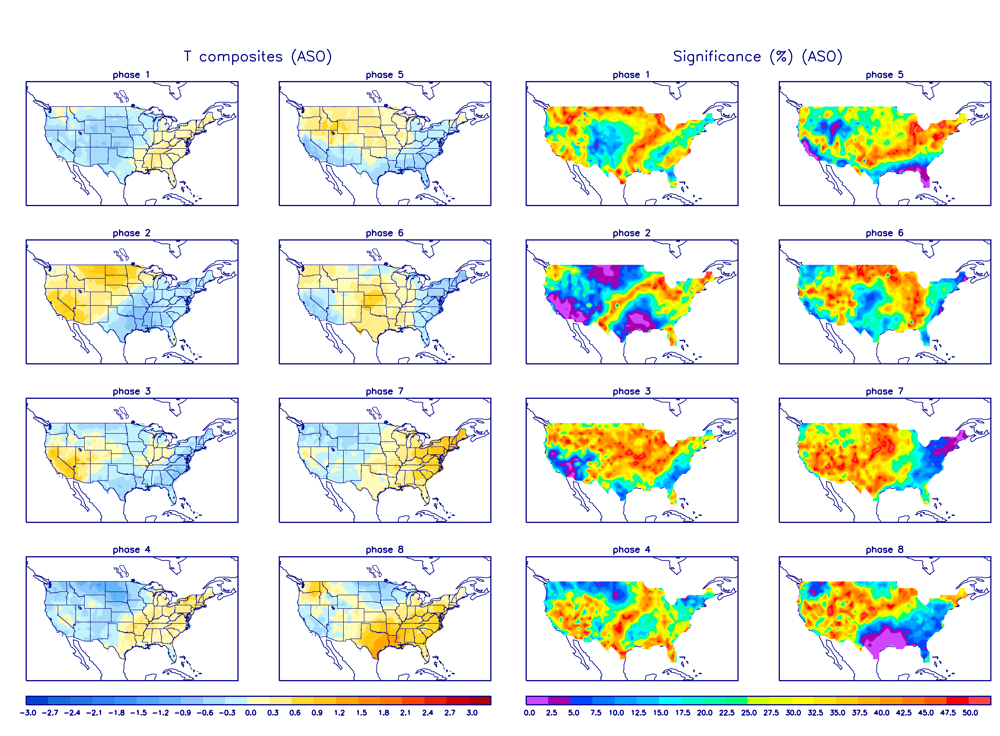
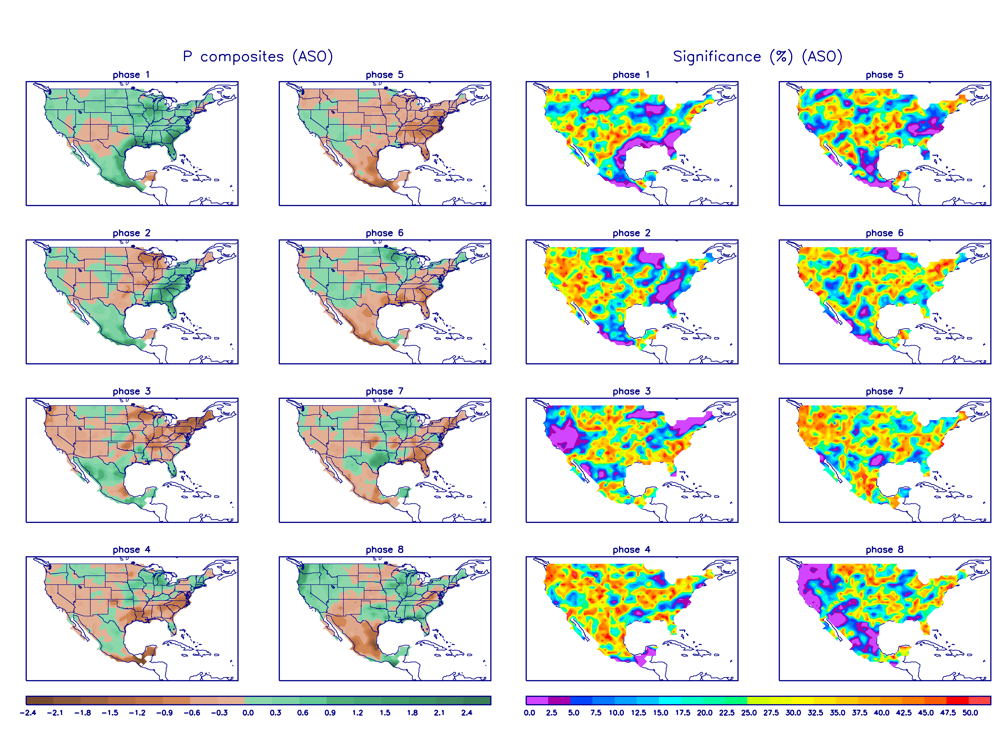
- Description: The MJO is a tropical disturbance or "wave" that propagates eastward around the global tropics with a cycle on the order of 30-60 days. It is characterized by regions of enhanced and suppressed tropical rainfall. One of its indices is a phase diagram which illustrates the phase (1-8) and amplitude of the MJO on a daily basis. The MJO is categorized into eight "phases" depending on the pattern of the location and intensity of the regions of enhanced and suppressed tropical rainfall. The MJO can enter periods of little or no activity, when it becomes neutral or incoherent and has little influence on the weather. Overall, the MJO tends to be most active during ENSO-neutral years, and is often absent during moderate-to-strong El Niño and La Niña episodes.
- Status: The MJO started the month weakly in phase 4, then became incoherent where it stayed for the rest of the month. The MJO indices appeared to be influenced by other modes of coherent subseasonal tropical variability, including Kelvin and Rossby waves, tropical cyclones, and the developing background state related to the transition to El Niño (as indicated by the MJO discussions for September 8, 15, 22, and 29).
- Teleconnections (influence on weather): The MJO's temperature and precipitation teleconnections to U.S. weather depend on time of year and MJO phase. To the extent teleconnections are known, the August-October teleconnections for temperature are shown here and for precipitation are shown here.
- Comparison to Observed: The MJO is transitory and can change phases (modes) within a month, so it is more closely related to weekly weather patterns than monthly. The September 2014 monthly precipitation and temperature anomaly patterns show little resemblance to the teleconnections for MJO phase 4, but the week 1 temperature anomaly pattern is a reasonable match east of the Rockies and the week 1 precipitation anomaly pattern is a reasonable match in the Great Lakes and Mid-Atlantic coast.
- The Pacific/North American (PNA) pattern
- Description: The PNA teleconnection pattern is associated with strong fluctuations in the strength and location of the East Asian jet stream. PNA-related blocking of the jet stream flow in the Pacific can affect weather downstream over North America, especially the West and especially in the winter half of the year.
- Status: The daily PNA index was positive for most of the month, averaging positive for the month as a whole. The 3-month-averaged index was positive in September after a long run of mostly negative for the last two years.
- Teleconnections (influence on weather): To the extent teleconnections are known, for a positive PNA, the temperature teleconnection map for this time of year (October on the teleconnection maps) shows warmer-than-normal temperatures in Alaska, western Canada, and the west coast of the U.S., and cooler-than-normal temperatures for the Southern Plains and southeastern CONUS. The precipitation teleconnection map shows drier-than-normal weather in the Great Lakes to Ohio Valley (although the teleconnections for precipitation are weak). The upper-level circulation anomaly teleconnections show above-normal heights over western Canada and the western CONUS, and below-normal heights over the southeastern and eastern CONUS.
- Comparison to Observed: The September 2014 temperature and upper-level circulation anomaly patterns show some agreement over the western U.S. and Alaska, but not in the southeastern CONUS, and the precipitation anomaly pattern shows little agreement.
- The Arctic Oscillation (AO) pattern
- Description: The AO teleconnection pattern relates upper-level circulation over the Arctic to circulation features over the Northern Hemisphere mid-latitudes and is most active during the cold season.
- Status: The daily AO index started the month neutral (near zero), turned negative at mid-month, and ended the month positive, averaging slightly positive for the month. The 3-month-averaged index was negative in September reflecting the dominance of the negative monthly values in July and August.
- Teleconnections (influence on weather): To the extent teleconnections are known, a positive AO this time of year (August-October) is typically associated with dry conditions across much of the Plains, Midwest, and Northeast, wet conditions in the coastal Northwest and Southeast, above-normal temperatures from the Central and Northern Plains to Great Lakes, and upper-level circulation anomalies which are above normal from the central U.S. to eastern Canada and below normal over the Canadian Archipelago and Arctic Sea.
- Comparison to Observed: The September 2014 monthly precipitation anomaly pattern is a good match where teleconnections exist and the upper-level circulation anomaly pattern has some agreement. The temperature anomaly pattern does not match at the monthly time scale, but is a good match for week 4 which is when the daily AO was positive..
- The North Atlantic Oscillation (NAO) pattern
- Description: The NAO teleconnection pattern relates upper-level circulation over the North Atlantic Ocean to circulation features over the Northern Hemisphere mid-latitudes.
- Status: The daily NAO index was positive for most of September, averaging positive for the month. The 3-month-averaged index was near zero this month, reflecting the net result of a positive September, negative August, and near zero July.
- Teleconnections (influence on weather): To the extent teleconnections are known, a positive NAO during this time of year (October on the teleconnection maps) is associated with wetter-than-normal conditions in the Midwest and southwest Alaska (although the teleconnections are weak for precipitation), positive upper-level circulation anomalies across the North Atlantic and CONUS east of the Rockies, and negative upper-level circulation anomalies over the Canadian Archipelago. The temperature teleconnections show no correlation across the CONUS.
- Comparison to Observed: The September 2014 monthly precipitation shows little agreement where teleconnections exist. The upper-level circulation anomaly pattern agrees over the Canadian Archipelago and North Atlantic, but has limited agreement over the CONUS.
- The West Pacific (WP) pattern
- Description: The WP teleconnection pattern is a primary mode of low-frequency variability over the North Pacific and reflects zonal and meridional variations in the location and intensity of the (East Asian) jet stream in the western Pacific.
- Status: The monthly WP index was negative for the month, with the three-month average WP index negative for the last 12 to 18 months.
- Teleconnections (influence on weather): To the extent teleconnections are known, a negative WP during this time of year (October on the maps) is typically associated with below-normal temperatures in the Central Plains to Upper Midwest, wet conditions Deep South, Upper Midwest, and Northwest, and below-normal circulation anomalies over the Northern to Central Plains, Upper Midwest, and central to western Canada.
- Comparison to Observed: The September 2014 monthly temperature pattern shows some agreement, but the precipitation and upper-level circulation anomaly patterns do not match what is expected over the CONUS.
- The Pacific Transition (PT) pattern
- Description: The PT teleconnection pattern relates upper-level circulation over the central subtropical North Pacific to circulation features over North America. It is a significant factor in the earth's circulation during August and September.
- Status: The PT index was positive during September.
- Teleconnections (influence on weather): To the extent teleconnections are known, a positive PT is typically associated with warmer-than-normal temperatures for the western CONUS and western Canada, cooler-than-normal temperatures for the eastern CONUS, and drier-than-normal conditions in the Midwest, Alaska, and parts of the Pacific Northwest to Northern Plains. The upper-level circulation anomalies for a positive PT are below-normal 500-mb geopotential heights over the eastern third of the CONUS into the North Atlantic, below-normal heights over the northeastern Pacific (including the Gulf of Alaska), and above-normal heights over the western half of the CONUS into south central Canada.
- Observed: The September 2014 monthly temperature and upper-level circulation anomaly patterns are similar to that expected with a positive PT in parts of the western CONUS, but not in the East. The monthly precipitation anomaly pattern agrees in some areas but not in others where there are correlations.
- The East Pacific-North Pacific (EP-NP) pattern
- Description: The EP-NP teleconnection pattern relates SST and upper-level circulation patterns (geopotential height anomalies) over the eastern and northern Pacific to temperature, precipitation, and circulation anomalies downstream over North America. Its influence during the winter is not as strong as during the other three seasons.
- Status: The SST pattern over the northeastern North Pacific during September 2014 saw a continuation of the warmer-than-normal SSTs there, with the magnitude of the warmth decreasing over more of the area. The monthly EP-NP index was weakly positive during September, but it has alternated between positive and negative in the last five months, pulling the 3-month running mean to near zero or slightly negative.
- Teleconnections (influence on weather): To the extent teleconnections are known, a positive EP-NP index during this time of year (October on the maps) is typically associated with cooler-than-normal temperatures east of the Rockies, warmer-than-normal temperatures across the extreme West Coast and in Alaska, drier-than-normal conditions in the Northwest and wetter than normal in southern Alaska (although the precipitation teleconnections are very weak), above-normal upper-level circulation anomalies (stronger upper-level ridge) over Alaska and western Canada and into the Pacific Northwest, and below-normal upper-level circulation anomalies (stronger upper-level trough) east of the Rockies.
- Comparison to Observed: The September 2014 temperature and upper-level circulation anomaly patterns generally agree in the West, but not in the eastern CONUS, and the precipitation anomaly pattern agrees in some areas but not others.

Examination of these circulation indices and their teleconnection patterns, and comparison to observed September 2014 temperature, precipitation, and circulation patterns, suggest that the weather over the CONUS in September was related to the normal chaotic nature of the transition between seasons, but there were hints that the jet stream and ocean-atmosphere interactions over the North Pacific and Arctic played a role, and the equatorial Pacific may have exerted some limited influence. The MJO was mostly weak or incoherent and the NAO and WP showed little correlation. ENSO was neutral, but equatorial Pacific oceanic conditions were slowly evolving toward an El Niño state. The jet stream circulation (ridge/trough pattern) underwent a significant "flip" during the month, which complicated and flattened the temperature and circulation anomalies. The anomaly patterns suggest that Arctic (AO) and Pacific (PNA, EP-NP, and PT) drivers had the strongest influence on the circulation, especially in the West. There was some indication that the equatorial Pacific may have influenced the temperature pattern early in the month (week 1), and the Arctic (AO) may have influenced it near the end of the month (week 4). The Pacific indices (PNA, EP-NP, and PT) had some agreement with the monthly temperature pattern, especially in the West. The precipitation pattern was also complicated by the variations in the circulation, with the AO having the best agreement monthly but the EP-NP and PT having some agreement in places. This month illustrates how weather and climate anomaly patterns can be the manifestation of normal (random) atmospheric variability, but also how they reflect influences from several atmospheric drivers (or modes of atmospheric variability).