Note: This Synoptic Discussion describes recent weather events and climate anomalies in relation to the phenomena that cause the weather. These phenomena include the jet stream, fronts and low pressure systems that bring precipitation, high pressure systems that bring dry weather, and the mechanisms which control these features — such as El Niño, La Niña, and other oceanic and atmospheric drivers (PNA, NAO, AO, and others). The report may contain more technical language than other components of the State of the Climate series.
Summary
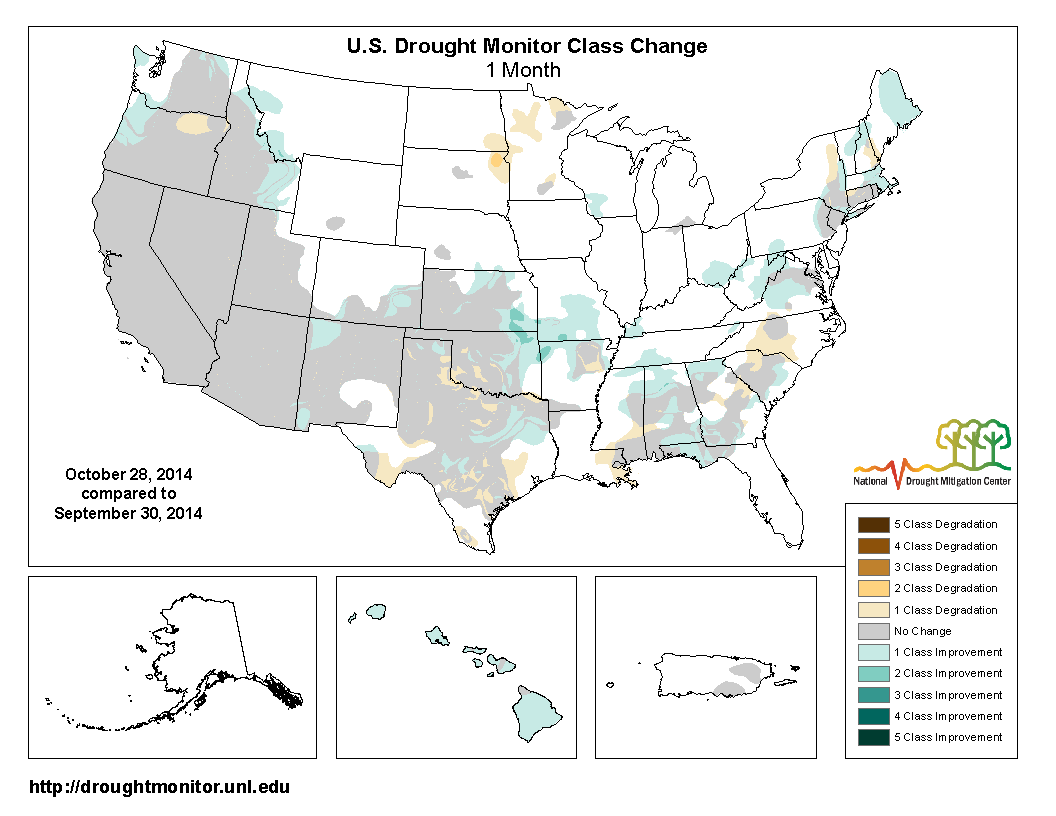
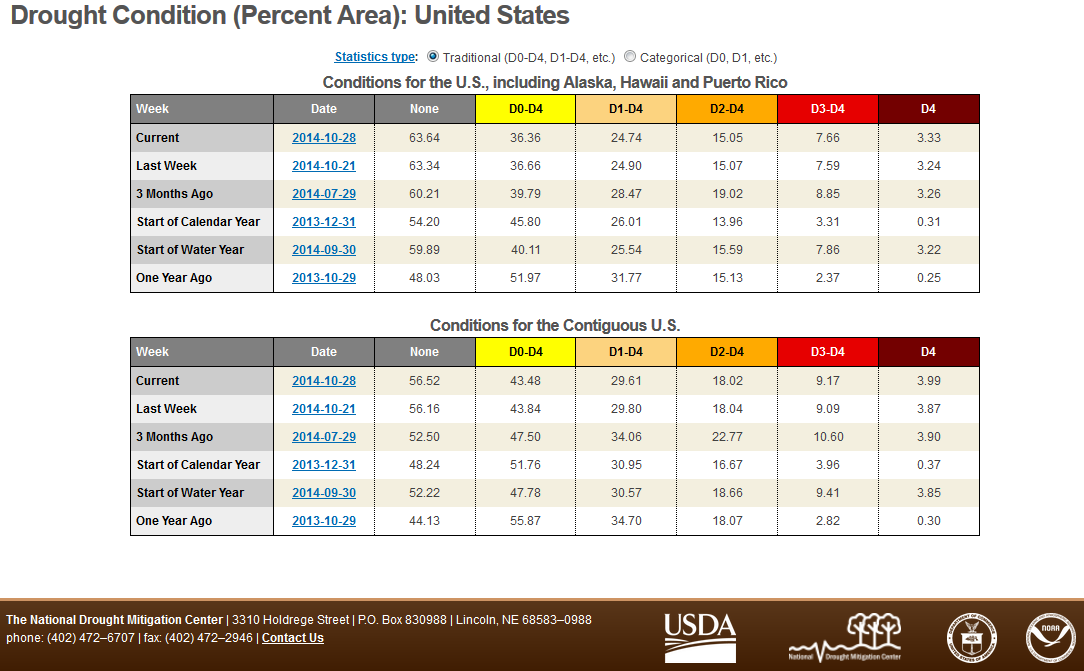
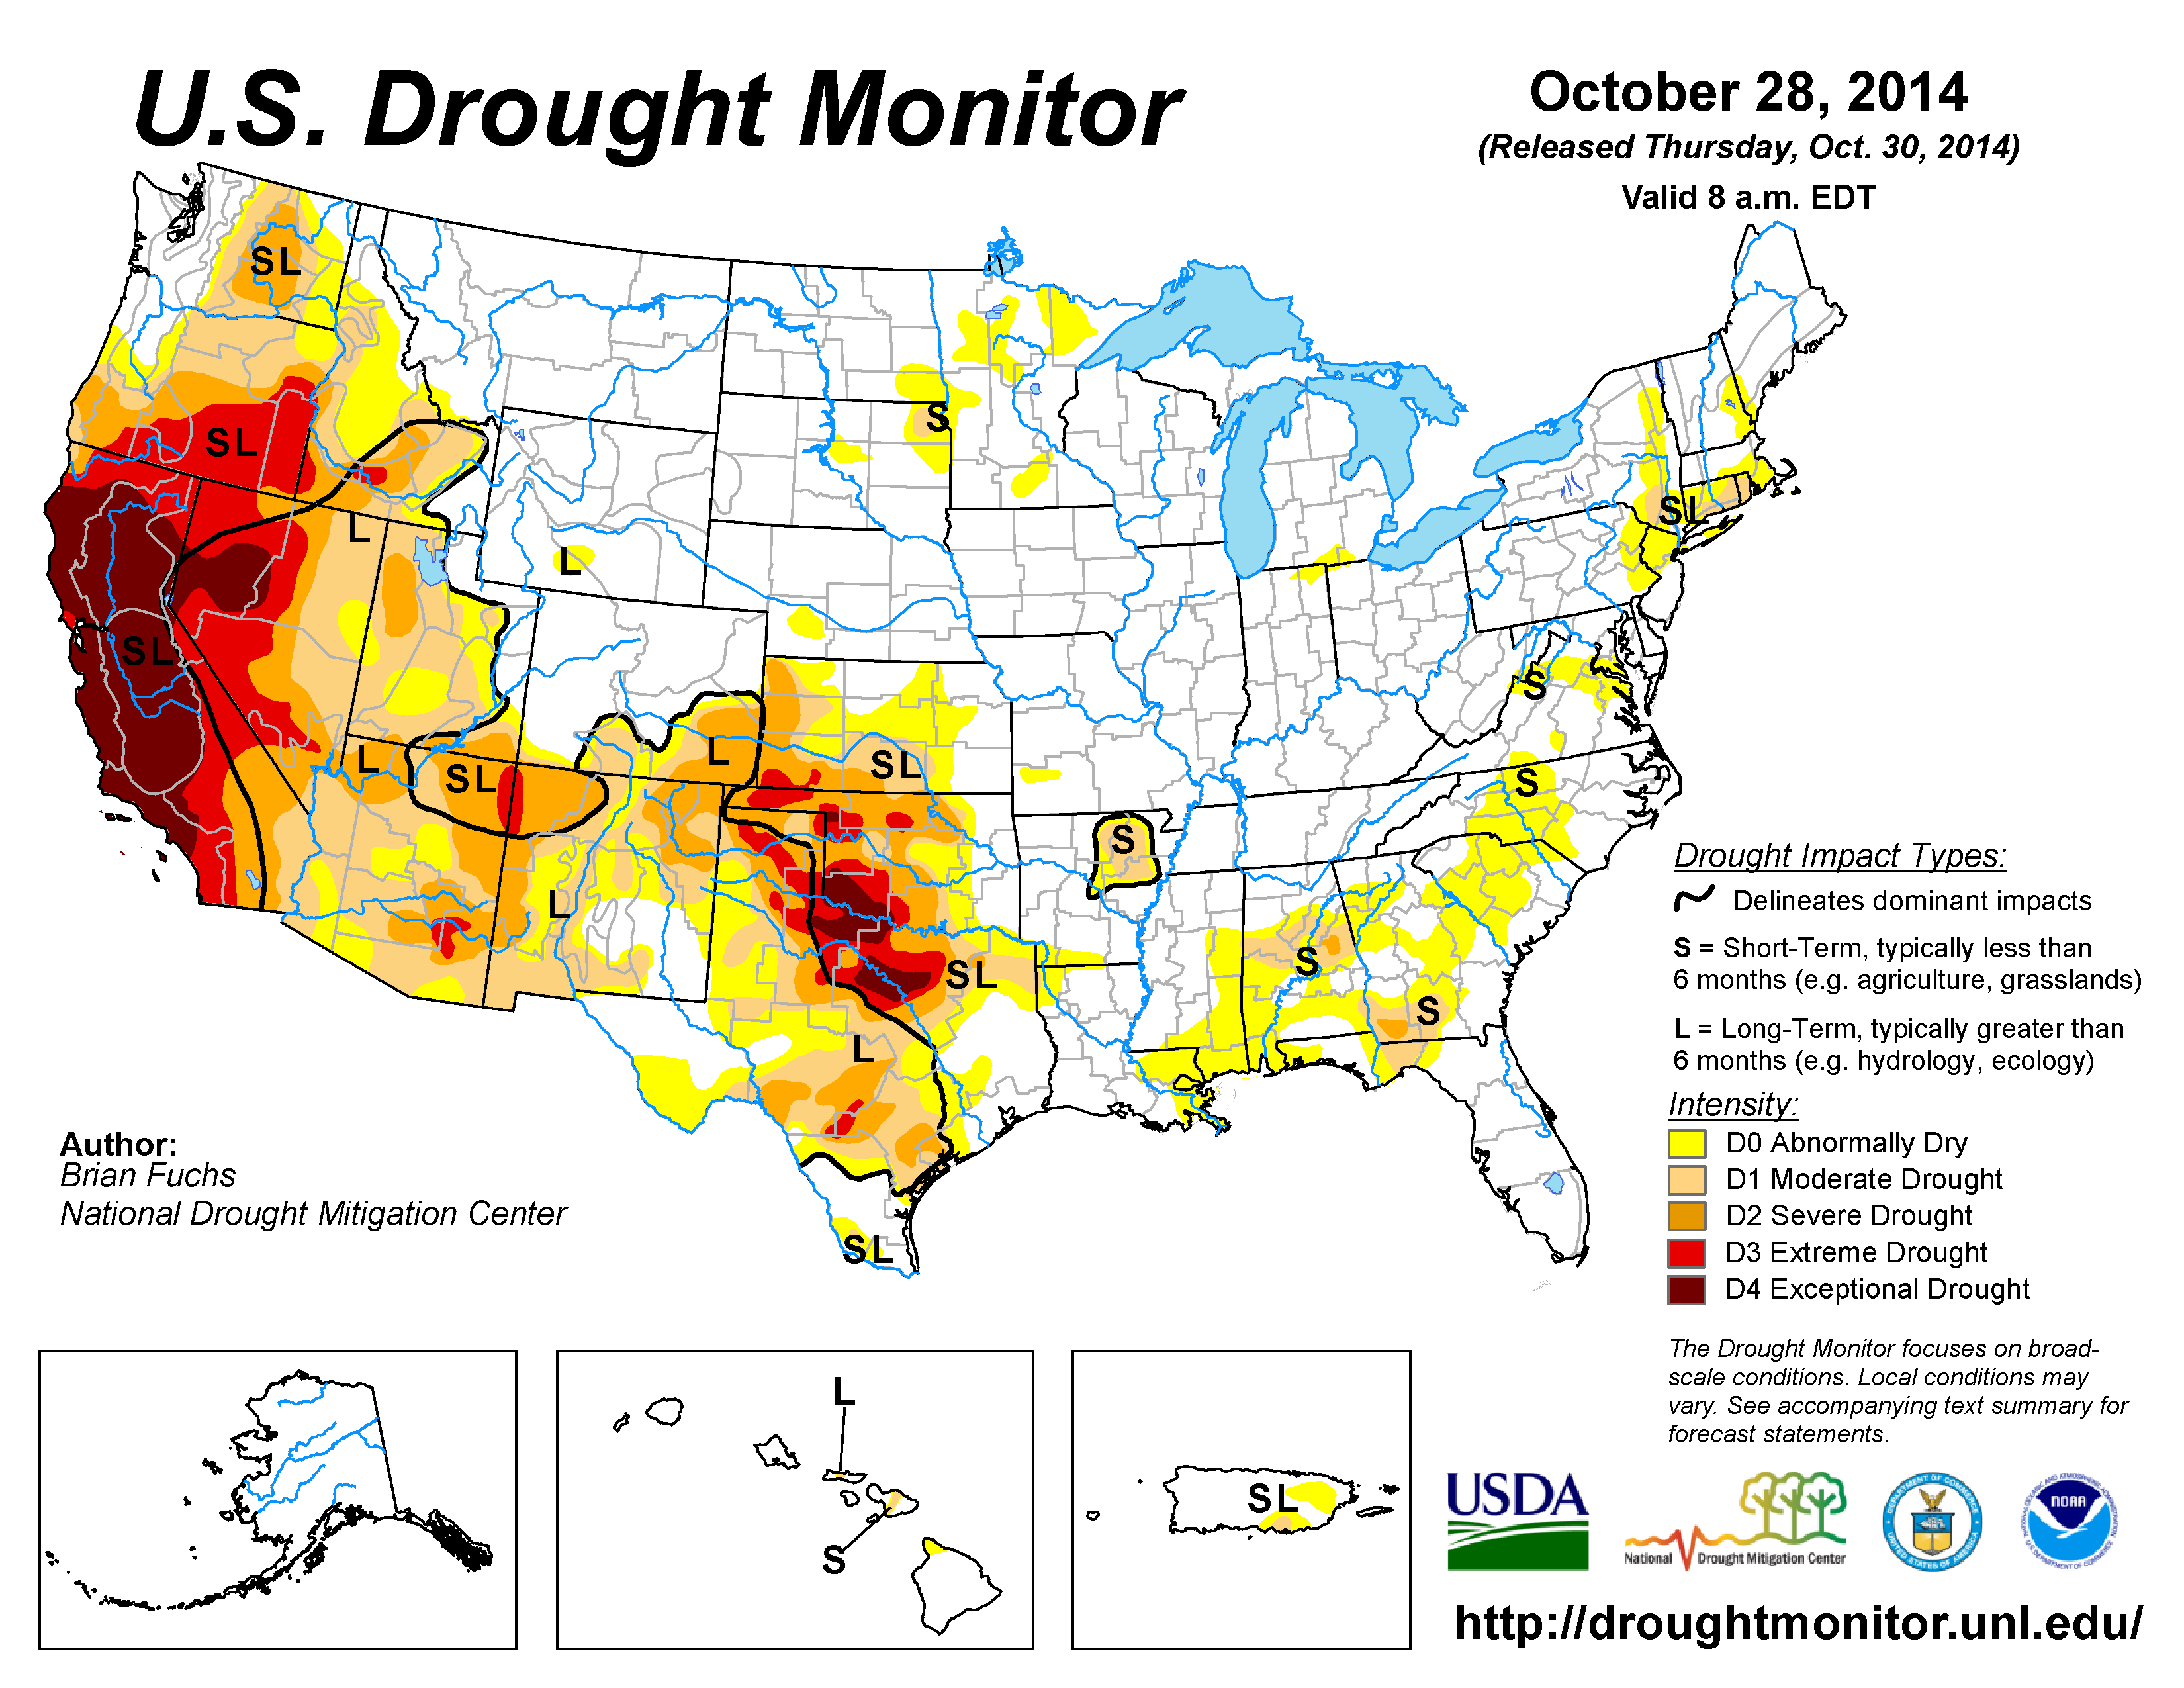
October 2014 was characterized by an active jet stream along the U.S.-Canadian border, with frequent vigorous short-wave troughs and ridges migrating through the upper-level circulation over the contiguous United States (CONUS). The competition between cold fronts cast southward by the jet stream and warm air masses associated with ridges and subtropical high pressure systems produced a net result of warmer-than-normal monthly temperatures across most of the country, with near- to below-normal temperatures beneath a dominating trough over the Great Lakes region. Fronts and surface low pressure systems, associated with the jet stream troughs, brought above-normal rainfall to parts of the country east of the Plains, along with areas of severe weather, but drier-than-normal weather beneath high pressure dominated much of the West, Plains, and coastal Southeast. The net result was a slight contraction in the national drought footprint. The upper-level circulation pattern, and temperature and precipitation patterns, suggest that the weather and climate of October 2014 were influenced, in part, by modes of variability associated with conditions in the North Pacific, North Atlantic, and Arctic Oceans, but that normal random variability of the atmosphere may have played a dominant role. See below for details.
Synoptic Discussion
 Animation of daily upper-level circulation for the month. In the Northern Hemisphere, October is in the middle of climatological fall (autumn), which is the time of year when solar heating decreases as the sun angle decreases and an expanding circumpolar vortex forces the jet stream to migrate southward. Polar air masses begin to influence the weather more, and the warm, dry subtropical high pressure belts influence the weather less. In October 2014, the jet stream hung back, staying active along the U.S.-Canadian border but sending frequent strong short-wave troughs over the CONUS, which frequently amplified the circulation into a strong meridional flow. Strong short-wave ridges were pushed up on either side of the troughs. The North Pacific and North Atlantic subtropical high pressure belts lingered in the southern CONUS and reinforced the short-wave ridges with warm air. |
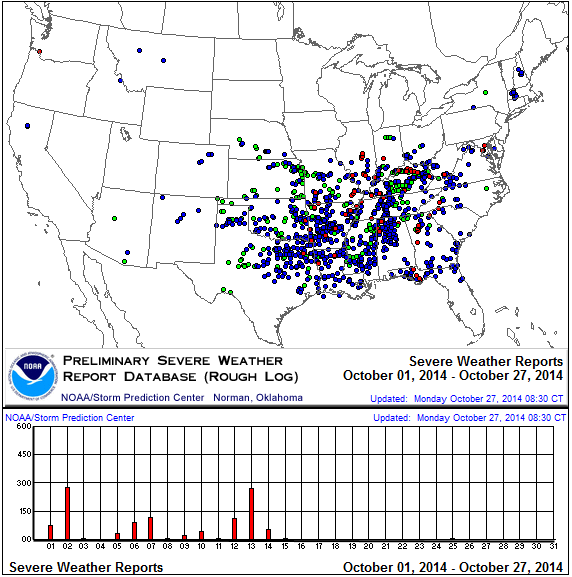
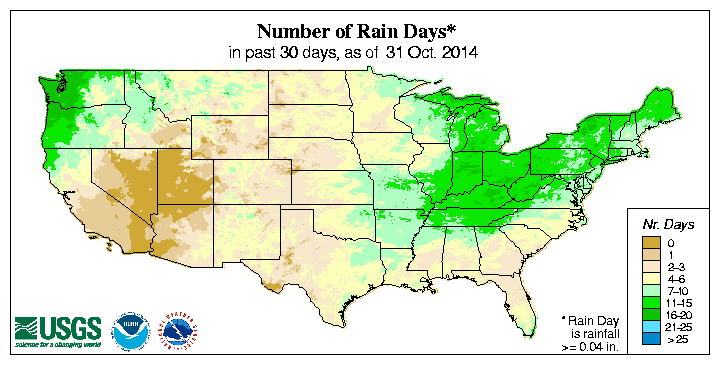
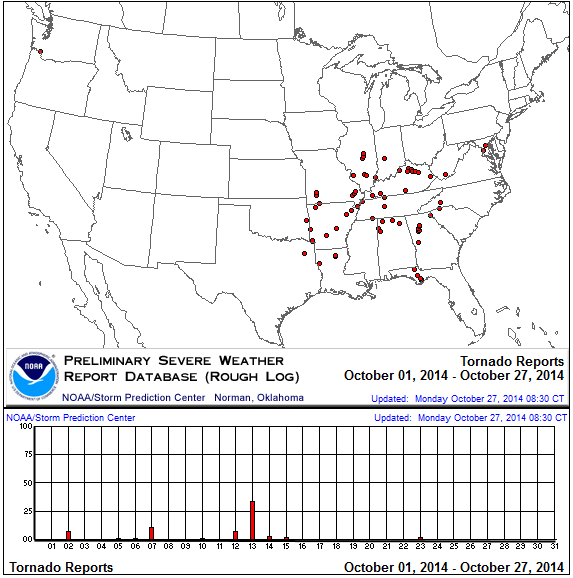
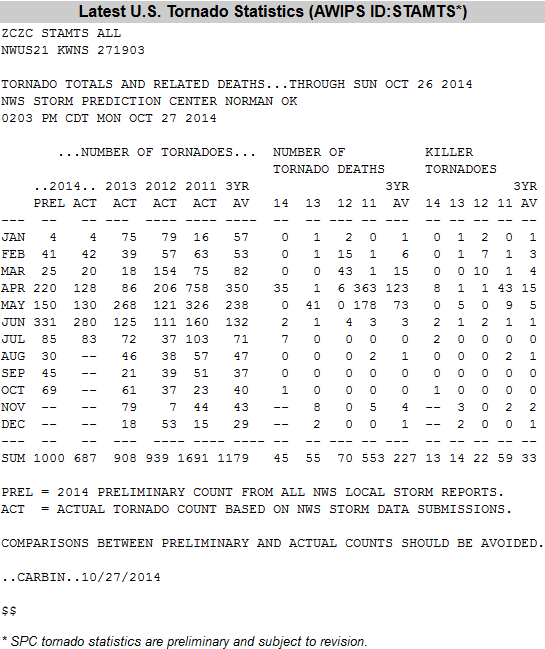
 Animation of daily surface fronts and pressure systems for the month. These upper-level weather systems generated low pressure systems with their associated cold fronts at the surface — warm air flowed ahead of the lows, with cooler air surging southward behind them. The alternating short-wave troughs and ridges moving in the jet stream flow caused the temperature anomaly pattern to change week to week (weeks 1, 2, 3, 4, 5). This seesaw of warm and cold fronts produced 712 record cold daily high (506) and low (206) temperature records but five times as many (3,562) record warm daily high (1,484) and low (2,078) temperature records. This was reflected in the national monthly average temperature which ranked October 2014 as the fourth warmest October in the 1895-2014 record. It was also reflected in the 13th lowest REDTI (Residential Energy Demand Temperature Index) for October, indicating that the widespread above-normal temperatures reduced the energy needed to heat homes. The fronts and surface low pressure systems associated with the jet stream troughs brought frequent days with rain and above-normal monthly total rainfall to the coastal Northwest and parts of the country east of the Plains. Subsiding air beneath the upper-level ridges and subtropical highs dominated much of the West, Great Plains, and coastal Southeast, reducing the number of rain days and keeping precipitation below normal. Drought contracted where it rained and expanded or intensified where it didn't, but the net change in drought area was a contraction of the moderate to exceptional national drought footprint compared to the end of September. The Climate Extremes Index (CEI) aggregates temperature and precipitation extremes across space and time. While the aggregated national CEI for October ranked slightly above average, the regional CEI reflected the extreme weather out west. The second highest warm minimum temperature component, fourth most extreme drought component, and 11th highest warm maximum temperature component contributed to the fourth most extreme October CEI for the West region. Areas of severe weather developed ahead of the troughs, especially during the first half of the month, with tornado outbreaks concentrated in the Midwest to Deep South. The preliminary count of 69 tornadoes compared to the average count of 61 tornadoes for October. The circulation pattern also helped to deflect the three North Atlantic tropical systems (Hurricanes Fay and Gonzalo and Tropical Storm Hanna) away from the CONUS. |
 Monthly upper-level circulation pattern and anomalies. When integrated across the month, the atmospheric circulation indicated a pattern of above-normal 500-mb heights (stronger-than-normal long-wave ridge) over the western CONUS, and another area of above-normal heights over north central and northeastern Canada and into the North Atlantic. The circulation pattern consisted of below-normal 500-mb heights (stronger-than-normal long-wave trough) over the eastern CONUS and northeastern North Pacific. This anomaly pattern masks the large variability in the circulation which resulted from the numerous short-wave ridges and troughs that migrated through the westerly flow. |
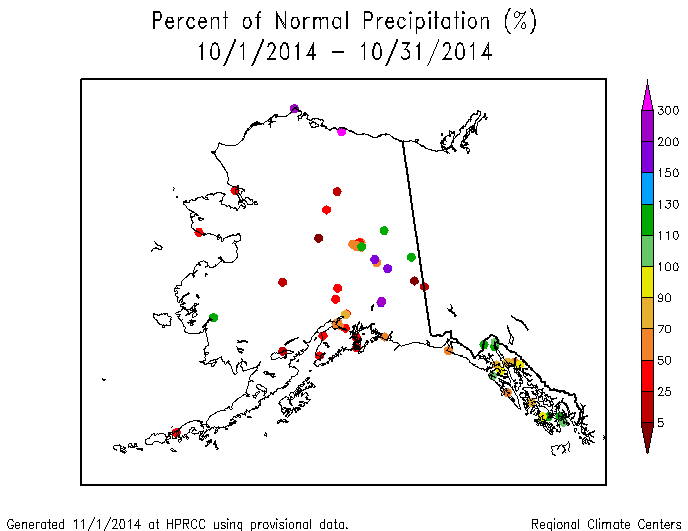
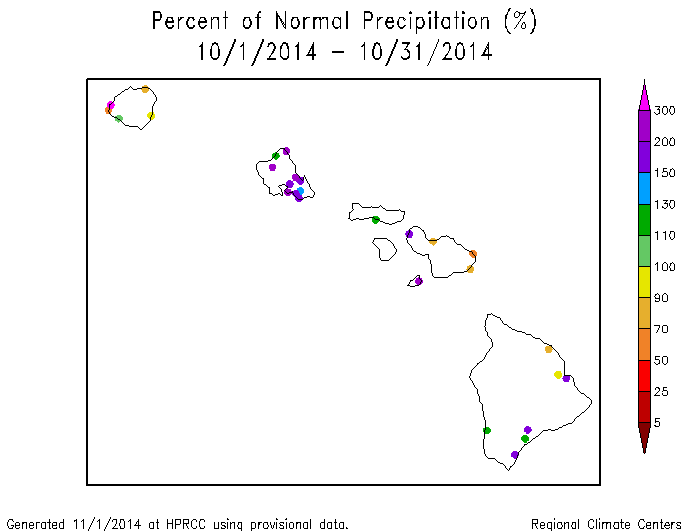
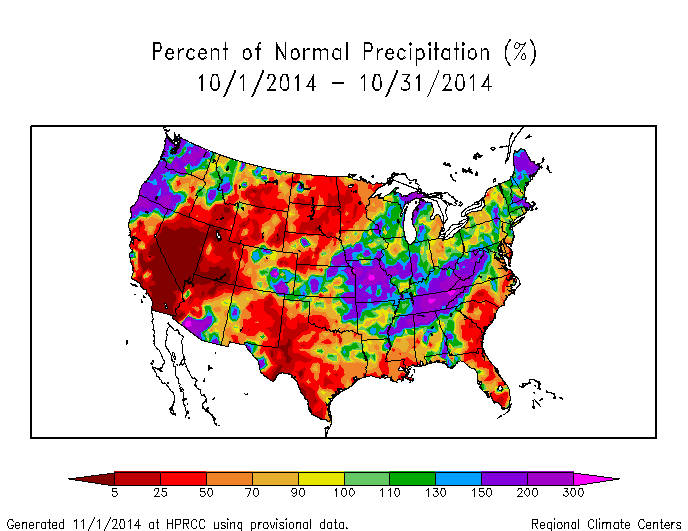 Map of monthly precipitation anomalies. Above-normal precipitation fell across parts of the Midwest, Tennessee Valley, Southern to Central Appalachians, New England, and coastal Northwest. Precipitation was below normal across the coastal Southeast and large parts of the West and Great Plains. October was drier than normal over much of Alaska and the northeast coasts of several of the Hawaiian Islands, but tropical system Ana contributed to above-normal rainfall across the rest of Hawaii. |
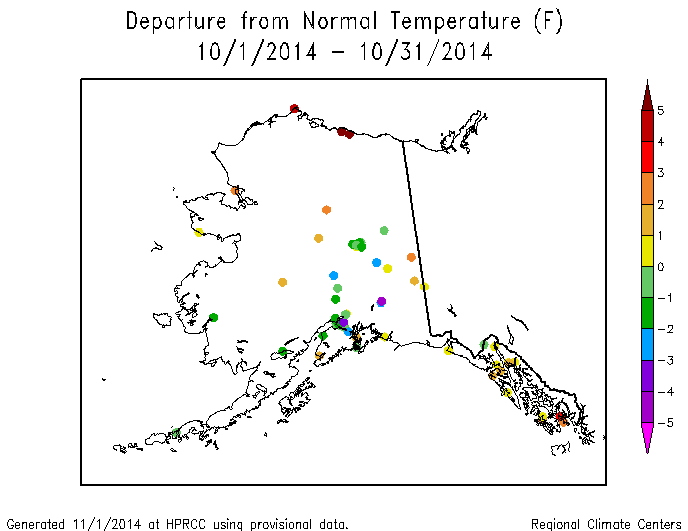
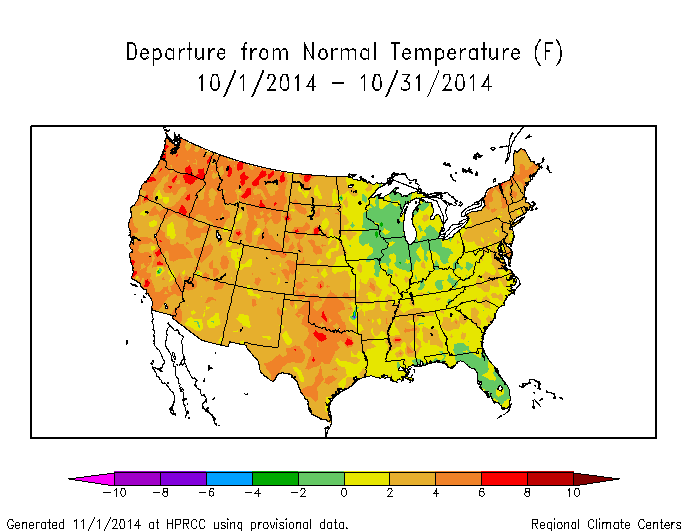 Map of monthly temperature anomalies. October temperatures were warmer than normal across most of the CONUS. Near- to below-normal temperatures occurred over the Great Lakes and Florida. The monthly temperature pattern was mixed over Alaska, but generally was warmer than normal in the north and in the panhandle, and cooler than normal in the southwest. |
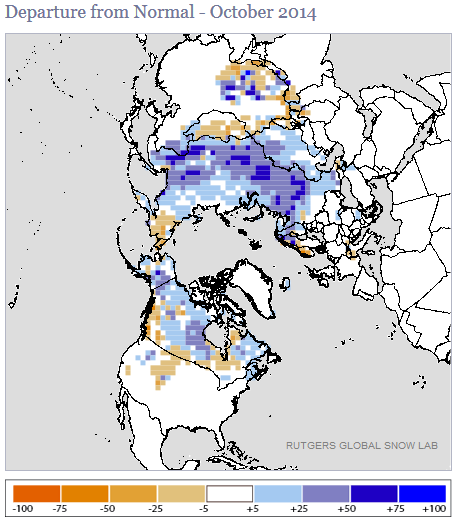
Global Linkages: The upper-level circulation over North America is part of the hemispheric mid-latitude westerly circulation. The circulation anomaly pattern over North America matches up with the anomaly pattern over Eurasia. The October mid-latitude (jet stream) pattern across the Northern Hemisphere consisted of four pairs of negative and positive anomalies — one pair spanned the North Atlantic and Europe, another covered Asia and the western North Pacific, and the remaining two pair stretched across North America from the eastern North Pacific to the western North Atlantic. Above-normal 500-mb heights, associated with ridging in the upper atmosphere, were reflected by above-normal temperatures at the surface over Europe, northeastern Siberia, and much of North America. Below-normal 500-mb heights, associated with troughs in the upper atmosphere, were reflected by below-normal temperatures and above-normal precipitation at the surface over central Siberia, and above-normal snow cover across much of Siberia.
Atmospheric Drivers
Subtropical highs, and fronts and low pressure systems moving in the mid-latitude storm track flow, are influenced by the broadscale atmospheric circulation. The circulation of the atmosphere can be analyzed and categorized into specific patterns. The tropics, especially the equatorial Pacific Ocean, provides abundant heat energy which largely drives the world's atmospheric and oceanic circulation. The following describes several of these modes or patterns of the atmospheric circulation, their drivers, the temperature and precipitation patterns (or teleconnections) associated with them, and their index values this month:
-
El Niño Southern Oscillation (ENSO)
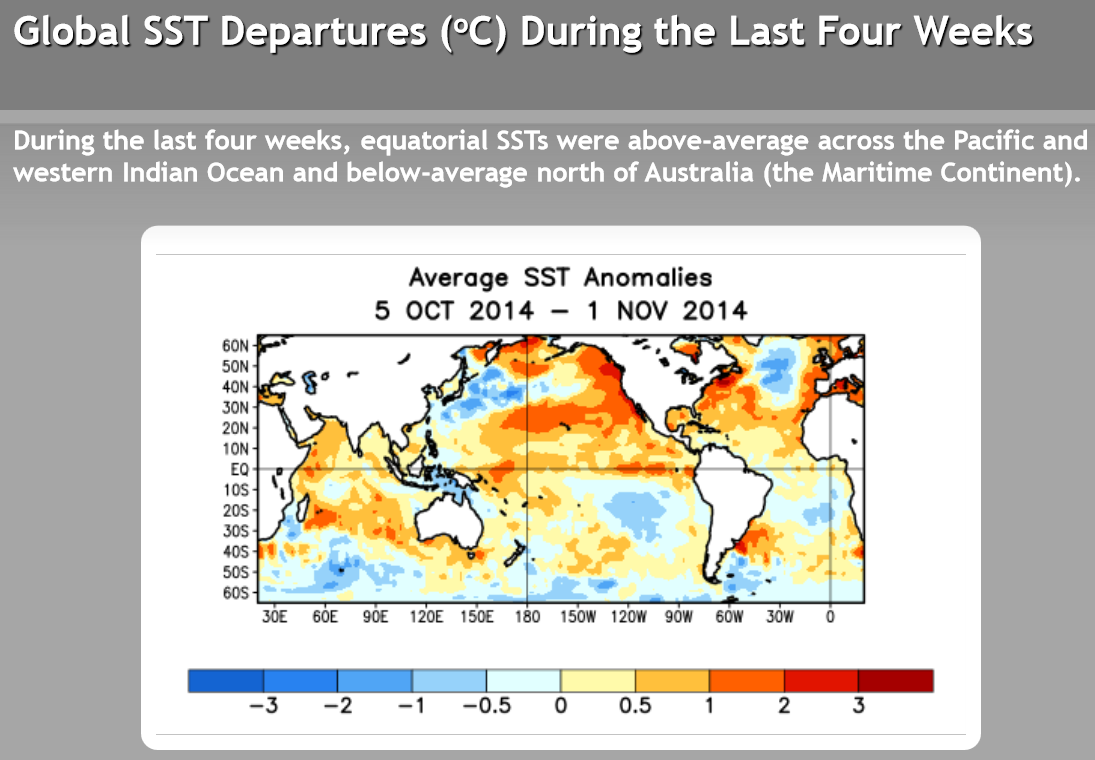
- Description: Oceanic and atmospheric conditions in the tropical Pacific Ocean can influence weather across the globe. ENSO is characterized by two extreme modes: El Niño (warmer-than-normal sea surface temperature [SST] anomalies in the tropical Pacific) and La Niña (cooler-than-normal SST anomalies), with the absence of either of these modes termed "ENSO-neutral" conditions.
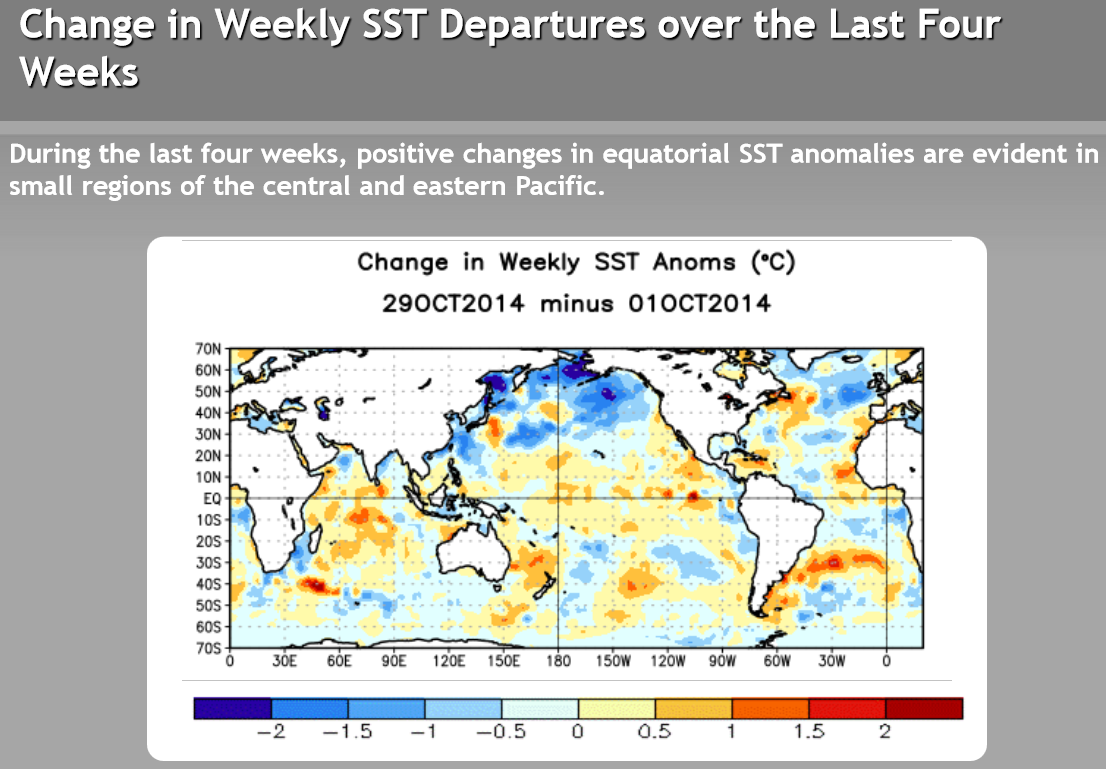
- Status: Ocean surface temperatures and several other features across the tropical Pacific were characteristic of borderline El Niño conditions, but collectively, the combined atmosphere and oceanic state remained ENSO-neutral during October.
- Teleconnections (influence on weather): To the extent teleconnections are known, while in a neutral state, ENSO normally is not a player in the month's weather. Historical data has been analyzed by NOAA to show typical temperature and precipitation patterns associated with El Niño and La Niña ENSO episodes. Teleconnections are not available for ENSO-neutral conditions at that NOAA web site. If an El Niño were happening during October, the typical precipitation pattern would consist of wetter-than-normal conditions in the Central Plains and Southern Plains, Tennessee Valley to Southern Appalachians, and parts of the West, and drier-than-normal conditions in the Great Lakes, Northeast, and coastal Mid-Atlantic. The typical temperature pattern would consist of below-normal temperatures across most of the southern tier states.
- Comparison to Observed: The October 2014 temperature anomaly pattern shows little resemblance to that expected with an El Niño, and the precipitation anomaly pattern has similarities in some areas (Southeast) but not most others.
-
Madden-Julian Oscillation (MJO)
- Description: The MJO is a tropical disturbance or "wave" that propagates eastward around the global tropics with a cycle on the order of 30-60 days. It is characterized by regions of enhanced and suppressed tropical rainfall. One of its indices is a phase diagram which illustrates the phase (1-8) and amplitude of the MJO on a daily basis. The MJO is categorized into eight "phases" depending on the pattern of the location and intensity of the regions of enhanced and suppressed tropical rainfall. The MJO can enter periods of little or no activity, when it becomes neutral or incoherent and has little influence on the weather. Overall, the MJO tends to be most active during ENSO-neutral years, and is often absent during moderate-to-strong El Niño and La Niña episodes.
- Status: The MJO started the month incoherent, transitioned weakly into phases 8 then 1 at mid-month, then became incoherent again for the rest of the month. The MJO indices appeared to be influenced by other modes of coherent subseasonal tropical variability, including Kelvin and Rossby waves, tropical cyclones, and the developing background state related to the transition to El Niño.
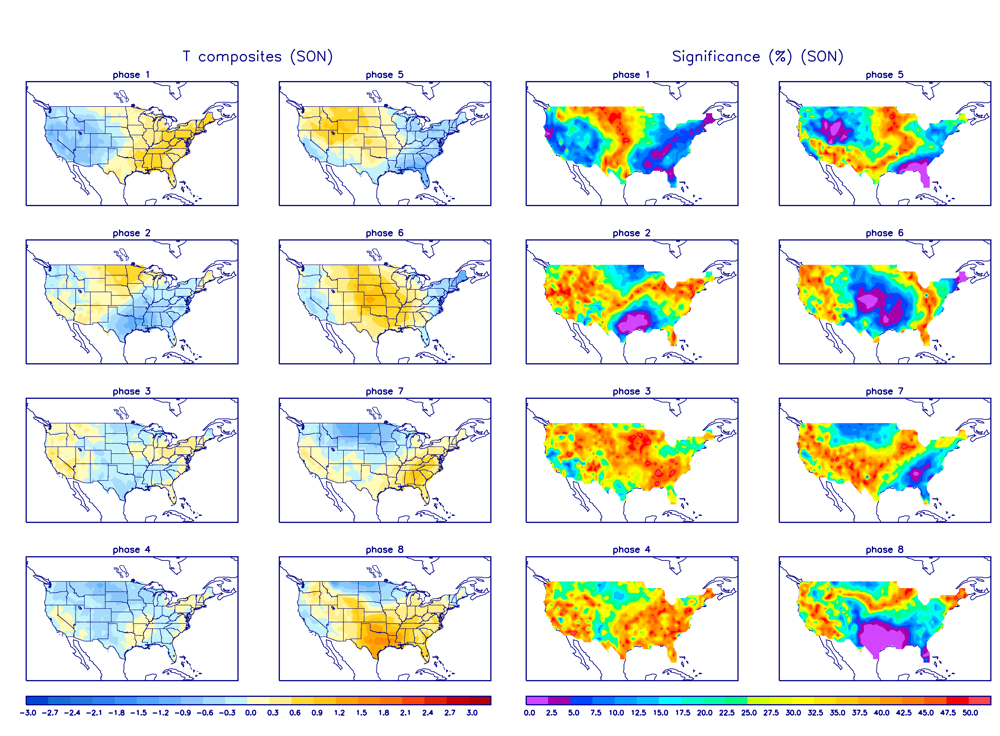
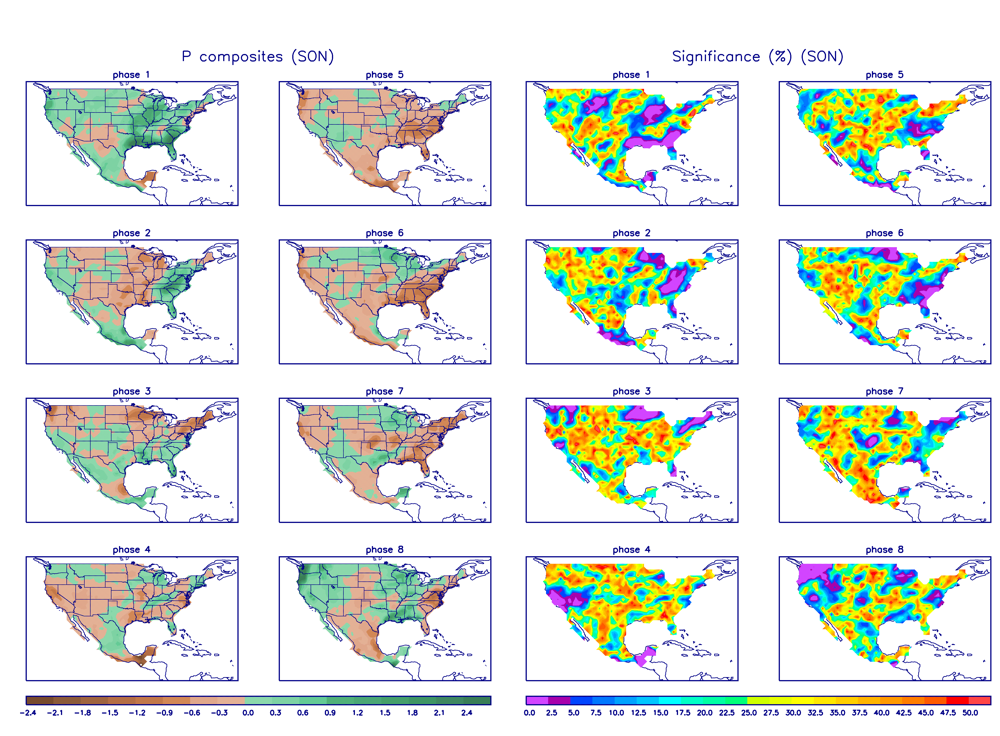
- Teleconnections (influence on weather): The MJO's temperature and precipitation teleconnections to U.S. weather depend on time of year and MJO phase. To the extent teleconnections are known, the September-November teleconnections for temperature are shown here and for precipitation are shown here.
- Comparison to Observed: The MJO is transitory and can change phases (modes) within a month, so it is more closely related to weekly weather patterns than monthly. The October 2014 monthly precipitation and temperature anomaly patterns show little resemblance to the teleconnections for MJO phases 8 and 1, but the week 3 precipitation anomaly pattern shows some resemblance to the phase 1 teleconnections in the Great Lakes to Southeast, and the week 4 precipitation anomaly pattern shows some resemblance to the phase 1 teleconnections in the coastal Northwest.
- The Pacific/North American (PNA) pattern
- Description: The PNA teleconnection pattern is associated with strong fluctuations in the strength and location of the East Asian jet stream. PNA-related blocking of the jet stream flow in the Pacific can affect weather downstream over North America, especially the West and especially in the winter half of the year.
- Status: The daily PNA index was positive to neutral for most of the month, averaging positive for the month as a whole. The 3-month-averaged index was positive in October after a long run of mostly negative for the last two years.
- Teleconnections (influence on weather): To the extent teleconnections are known, for a positive PNA, the temperature teleconnection map for this time of year (October on the teleconnection maps) shows warmer-than-normal temperatures in Alaska, western Canada, and the west coast of the U.S., and cooler-than-normal temperatures for the Southern Plains and southeastern CONUS. The precipitation teleconnection map shows drier-than-normal weather in the Great Lakes to Ohio Valley (although the teleconnections for precipitation are weak). The upper-level circulation anomaly teleconnections show above-normal heights over western Canada and the western CONUS, and below-normal heights over the southeastern and eastern CONUS.
- Comparison to Observed: The October 2014 upper-level circulation anomaly pattern shows some agreement over the CONUS and northeast Pacific, but the positions are shifted. The trend of the temperature anomaly pattern is consistent but the magnitude of the anomalies doesn't match. The precipitation anomaly pattern shows little agreement.
- The Arctic Oscillation (AO) pattern
- Description: The AO teleconnection pattern relates upper-level circulation over the Arctic to circulation features over the Northern Hemisphere mid-latitudes and is most active during the cold season.
- Status: The daily AO index was strongly negative for the first half of the month then neutral (near zero) for the last third of the month, averaging negative for the month. The 3-month-averaged index was negative in October reflecting the dominance of the negative monthly values for the last several months.
- Teleconnections (influence on weather): To the extent teleconnections are known, a negative AO this time of year (September-November) is typically associated with dry conditions in the coastal Northwest, Southern High Plains, and parts of the Midwest and Southeast, wet conditions in New England, below-normal temperatures in the Northern Plains and near normal temperatures elsewhere in the CONUS, and upper-level circulation anomalies which are below normal from the Northern Plains to the Mid-Atlantic and Northeast coasts and across much of the North Pacific, and above normal over the Canadian Archipelago and Arctic Sea.
- Comparison to Observed: The October 2014 monthly precipitation anomaly pattern matches where teleconnections exist in the Southern High Plains and New England and parts of the Southeast, but not the Northwest. The upper-level circulation anomaly pattern has some agreement in the eastern CONUS, northeast North Pacific, and Arctic Ocean, but not the western and central CONUS. The temperature anomaly pattern does not match.
- The North Atlantic Oscillation (NAO) pattern
- Description: The NAO teleconnection pattern relates upper-level circulation over the North Atlantic Ocean to circulation features over the Northern Hemisphere mid-latitudes.
- Status: The daily NAO index was negative for the first half of the month then neutral (near zero) for the last third of the month, averaging negative for the month. The 3-month-averaged index was negative this month, reflecting the net result of predominantly negative values for the last three months.
- Teleconnections (influence on weather): To the extent teleconnections are known, a negative NAO during this time of year (October on the teleconnection maps) is associated with drier-than-normal conditions in the Midwest and southwest Alaska (although the teleconnections are weak for precipitation), negative upper-level circulation anomalies across the North Atlantic and CONUS east of the Rockies, and positive upper-level circulation anomalies over the Canadian Archipelago. The temperature teleconnections show no correlation across the CONUS but slight negative correlation across southwest Alaska.
- Comparison to Observed: The October 2014 monthly precipitation shows no agreement over the CONUS. The temperature and precipitation anomaly patterns show weak agreement over southwest Alaska. The upper-level circulation anomaly pattern agrees over the Canadian Archipelago and eastern CONUS where teleconnections exist.
- The West Pacific (WP) pattern
- Description: The WP teleconnection pattern is a primary mode of low-frequency variability over the North Pacific and reflects zonal and meridional variations in the location and intensity of the (East Asian) jet stream in the western Pacific.
- Status: The monthly WP index was negative for the month, with the three-month average WP index negative for the last 12 to 18 months.
- Teleconnections (influence on weather): To the extent teleconnections are known, a negative WP during this time of year (October on the maps) is typically associated with below-normal temperatures in the Central Plains to Upper Midwest, wet conditions in the Deep South, Upper Midwest, and Northwest, and below-normal circulation anomalies over the Northern to Central Plains, Upper Midwest, and central to western Canada.
- Comparison to Observed: The October 2014 monthly temperature pattern shows some agreement in the Great Lakes, and the precipitation anomaly pattern agrees in most areas where teleconnections exist, but the upper-level circulation anomaly pattern does not match what is expected over the CONUS.
- The East Pacific-North Pacific (EP-NP) pattern
- Description: The EP-NP teleconnection pattern relates SST and upper-level circulation patterns (geopotential height anomalies) over the eastern and northern Pacific to temperature, precipitation, and circulation anomalies downstream over North America. Its influence during the winter is not as strong as during the other three seasons.
- Status: The magnitude of the warmth of the SSTs in the northeastern North Pacific significantly decreased this month, with the October SST pattern now showing above-normal SSTs along the North American coast and near-normal SSTs to the west. The monthly EP-NP index was negative during October, reflecting the shift in SST anomalies, but it has alternated between positive and negative in the last six months, pulling the 3-month running mean to near zero or slightly negative.
- Teleconnections (influence on weather): To the extent teleconnections are known, a negative EP-NP index during this time of year (October on the maps) is typically associated with warmer-than-normal temperatures east of the Rockies, cooler-than-normal temperatures across the extreme West Coast and in Alaska, wetter-than-normal conditions in the Northwest and drier than normal in southern Alaska (although the precipitation teleconnections are very weak), below-normal upper-level circulation anomalies (weaker upper-level ridge) over Alaska and western Canada and into the Pacific Northwest, and above-normal upper-level circulation anomalies (weaker upper-level trough) east of the Rockies.
- Comparison to Observed: The October 2014 temperature and upper-level circulation anomaly patterns show no agreement with the patterns expected with a negative EP-NP, but the precipitation anomaly pattern agrees where teleconnections exist.
Examination of these circulation indices and their teleconnection patterns, and comparison to observed October 2014 temperature, precipitation, and circulation patterns, suggest that the weather over the CONUS in October was related to the normal chaotic nature of the transition between seasons, but there were hints that the jet stream and ocean-atmosphere interactions over the North Pacific, North Atlantic, and Arctic exerted some limited influence. The MJO was mostly weak or incoherent and ENSO was neutral, but equatorial Pacific oceanic conditions were slowly evolving toward an El Niño state. The anomaly patterns suggest that Arctic (AO), Atlantic (NAO), and Pacific (PNA) drivers had some influence on the circulation, but the competition resulted in an upper-level circulation pattern that didn't perfectly match any of the teleconnections. The October temperature anomaly pattern over the CONUS did not match any of the teleconnections, except those for the WP over the Great Lakes, which suggests the WP had an influence on temperature. Monthly precipitation anomaly patterns are usually more chaotic than temperature patterns, but the limited agreement with the teleconnections suggested the EP-NP, WP, AO, and perhaps even the MJO may have contributed to the October precipitation anomalies; but, on the other hand, these agreements may have been pure coincidence.
This month illustrates how weather and climate anomaly patterns can be the manifestation of normal (random) atmospheric variability, but also how they reflect influences from several atmospheric drivers (or modes of atmospheric variability).