Note: This Synoptic Discussion describes recent weather events and climate anomalies in relation to the phenomena that cause the weather. These phenomena include the jet stream, fronts and low pressure systems that bring precipitation, high pressure systems that bring dry weather, and the mechanisms which control these features — such as El Niño, La Niña, and other oceanic and atmospheric drivers (PNA, NAO, AO, and others). The report may contain more technical language than other components of the State of the Climate series.
Synoptic Discussion

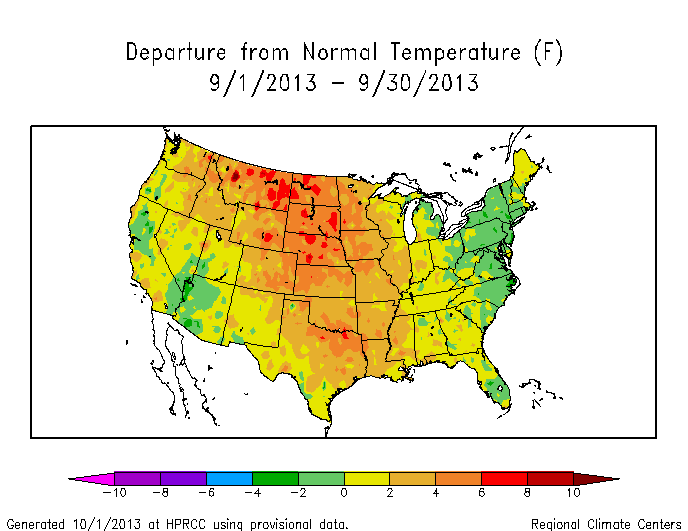
Monthly upper-level circulation pattern and anomalies.
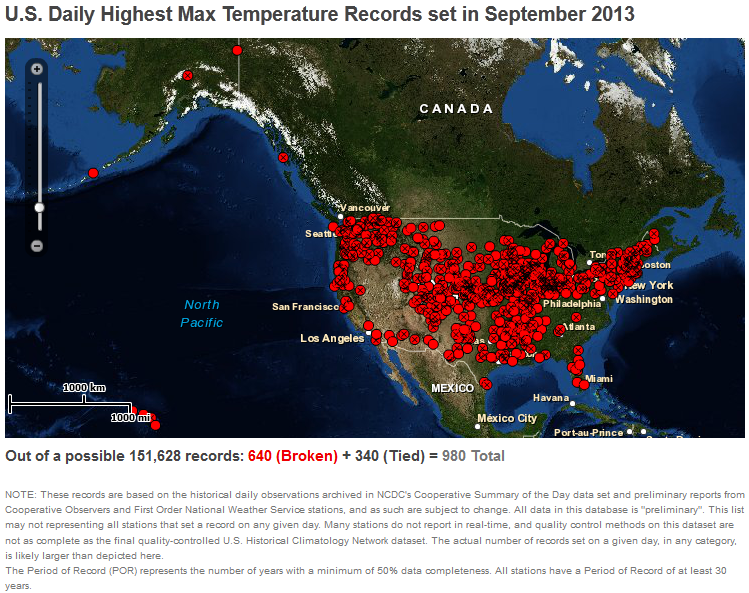
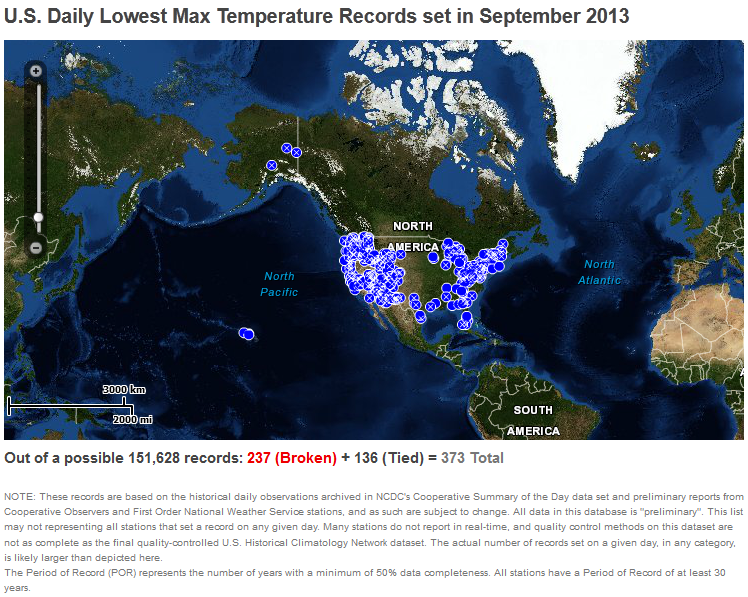
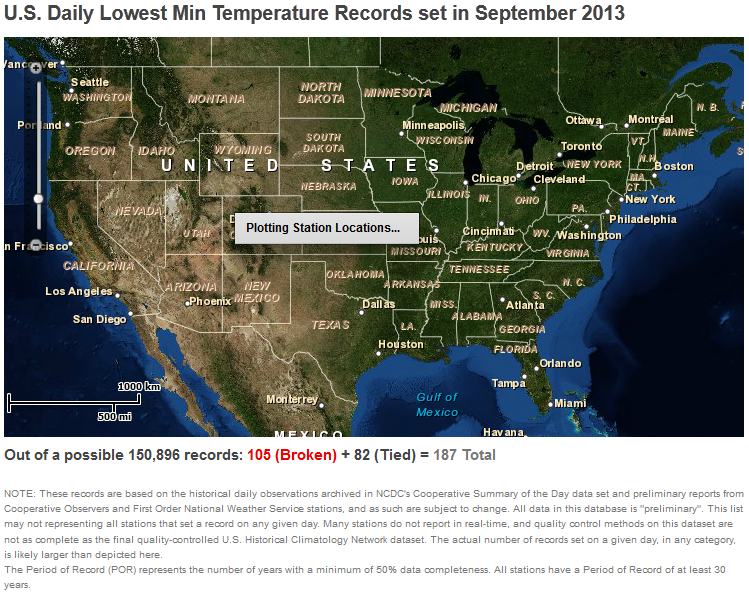
In the Northern Hemisphere, September marks the beginning of climatological fall which is the time of year when the jet stream becomes more active and spreads cooler air masses from the north across the United States. For September 2013, the subtropical high pressure belt, also called the Bermuda High (or Azores High), dominated the weather during the first half of the month, with warmer-than-average temperatures holding sway across much of the country during the first two weeks (week 1, 2). The Bermuda High retreated during the last half of the month, with a series of upper-level weather systems in the jet stream flow bringing below-normal temperatures to the eastern and western sections of the country. Warmth dominated for the month as a whole, with September 2013 ranking as the sixth warmest September, nationally, in the 1895-2013 record. Seven states, mostly in the Northern Rockies and Northern Plains, ranked in the top ten warmest category for September. There were nearly six times as many record warm daily highs (980) and lows (2294, or a total of about 3300) than record cold daily highs (373) and lows (187, or a total of about 560).
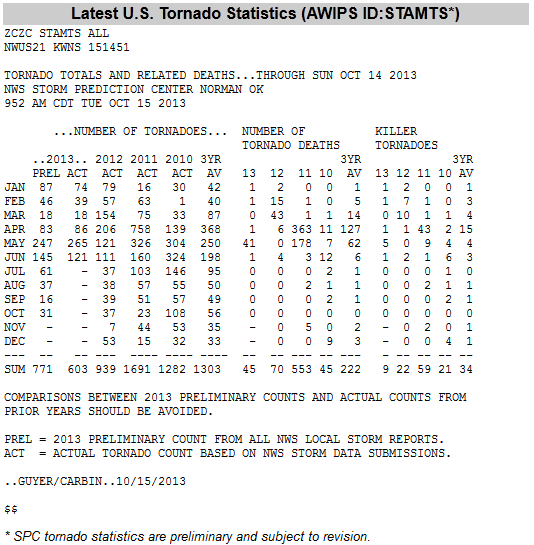
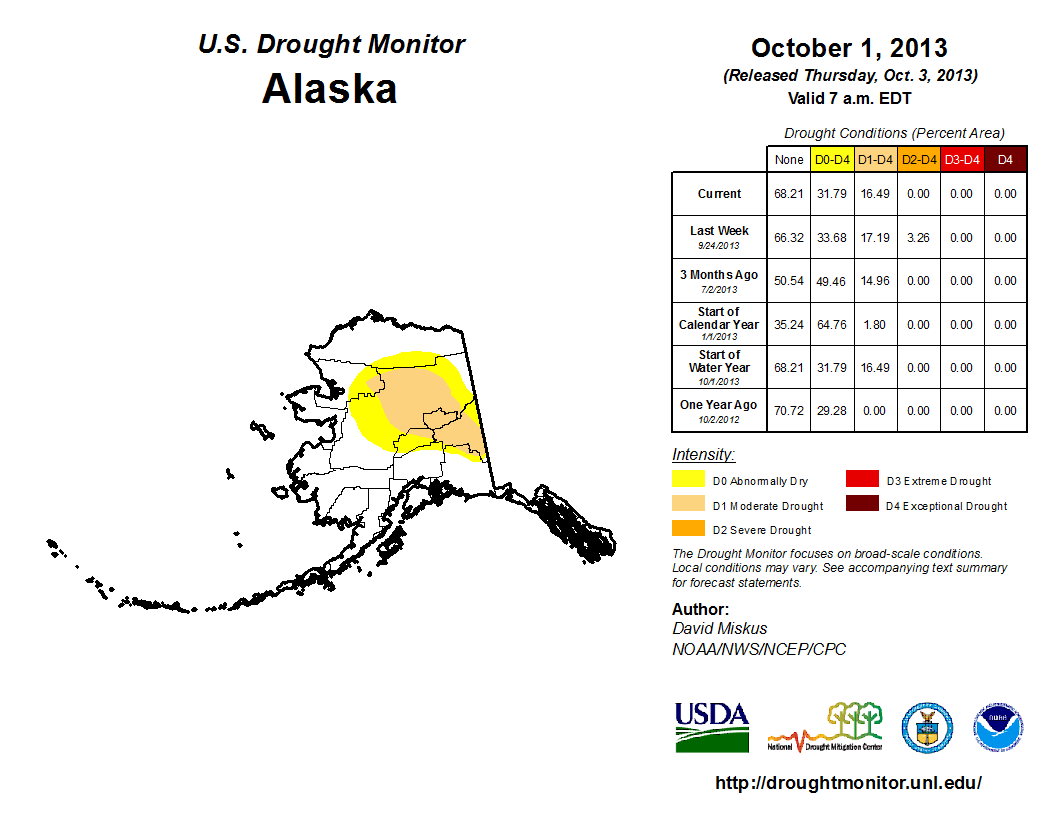
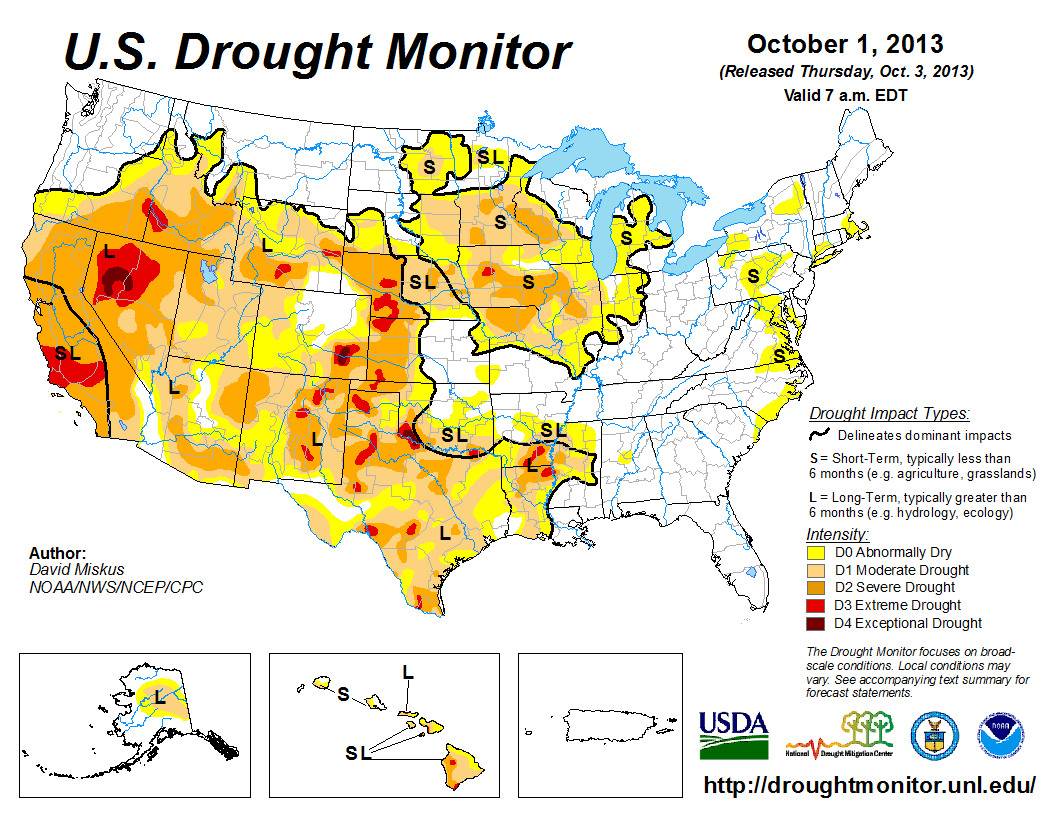
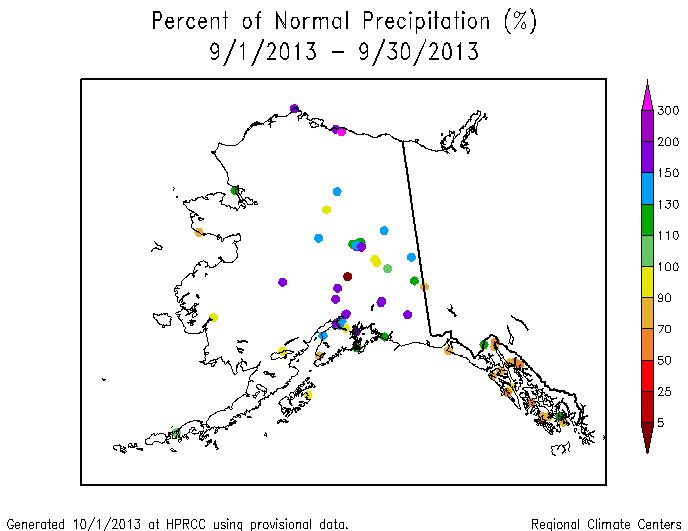
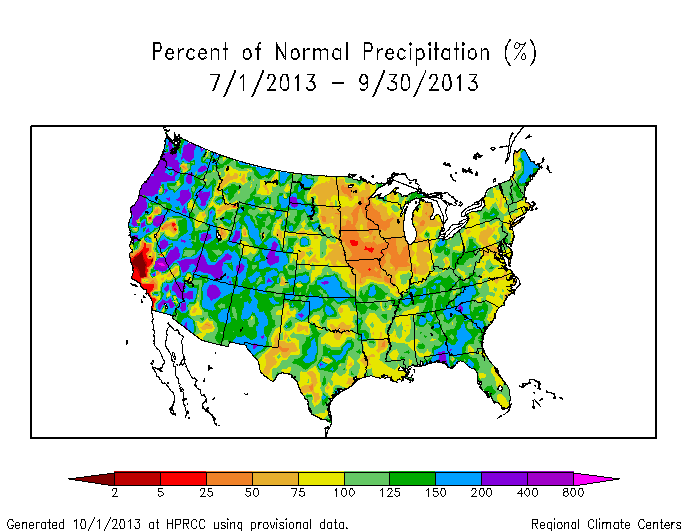
Numerous fronts moved across the country during the month, but the circulation pattern inhibited rain-producing systems over portions of the Midwest and East and contributed to a below-normal tornado count for September (preliminary count of 16 compared to an average count of 74). Upper-level troughs brought above-normal precipitation to much of the West, with Washington, Oregon, and Colorado having a record wet September and six other states ranking in the top ten wettest category. Six states in the Midwest and nine states in the East ranked in the driest third of the historical record, with Delaware and Maryland having the tenth driest, or drier, September. The Colorado rains produced significant flooding and resulted from a combination of an unusually deep, moist flow of tropical moisture pulled in by a slow-moving upper-level low pressure system that consistently focused the moisture towards the Front Range and along a stalled front. Tropical cyclone activity in the North Atlantic basin during September was near normal in terms of the number of named storms and hurricanes, but below normal in terms of the duration and strength of the cyclones, with none of the cyclones making landfall on the U.S. mainland. The wet conditions in the West contributed to a national precipitation rank of twelfth wettest September and reduced drought coverage in the region. Drought also shrank in the Great Plains and Alaska, but expanded in Hawaii and slightly in the Midwest. The national drought footprint shrank to 37.2 percent of the U.S. as a whole.
 |
 |
Subtropical highs, and cold fronts and low pressure systems moving in the storm track flow, are influenced by the broadscale atmospheric circulation. The following describes several such large-scale atmospheric circulation drivers and their potential influence this month:
-
El Niño Southern Oscillation (ENSO)
- Description: Oceanic and atmospheric conditions in the tropical Pacific Ocean can influence weather across the globe. ENSO is characterized by two extreme modes: El Niño (warmer-than-normal sea surface temperature [SST] anomalies in the tropical Pacific) and La Niña (cooler-than-normal SST anomalies), with the absence of either of these modes termed "ENSO-neutral" conditions.
- Status: Ocean temperatures and atmospheric circulation anomalies indicated that the equatorial Pacific continued in an ENSO-neutral state during September.
- Teleconnections (influence on weather): To the extent teleconnections are known, while in a neutral state, ENSO normally is not a player in the month's weather. Historical data can be analyzed to show typical temperature and precipitation patterns associated with El Niño and La Niña ENSO episodes. Teleconnections are not available for ENSO-neutral conditions.
-
Madden-Julian Oscillation (MJO)
- Description: The MJO is a tropical disturbance or "wave" that propagates eastward around the global tropics with a cycle on the order of 30-60 days. It is characterized by regions of enhanced and suppressed tropical rainfall. One of its indices is a phase diagram which illustrates the phase (1-8) and amplitude of the MJO on a daily basis. The MJO is categorized into eight "phases" depending on the pattern of the location and intensity of the regions of enhanced and suppressed tropical rainfall. The MJO can enter periods of little or no activity, when it becomes neutral or incoherent and has little influence on the weather. Overall, the MJO tends to be most active during ENSO-neutral years, and is often absent during moderate-to-strong El Niño and La Niña episodes.
- Status:The MJO began the month in phase 1, then transitioned weakly into phase 2 before becoming incoherent for the middle of the month, then transitioned into phase 5 before ending the month in phase 6. When the MJO was incoherent, other modes of convective variability in the tropics, such as Kelvin and Rossby waves, exerted some influence (as indicated by the MJO discussions for September 2, 9, 16, 23, 30).
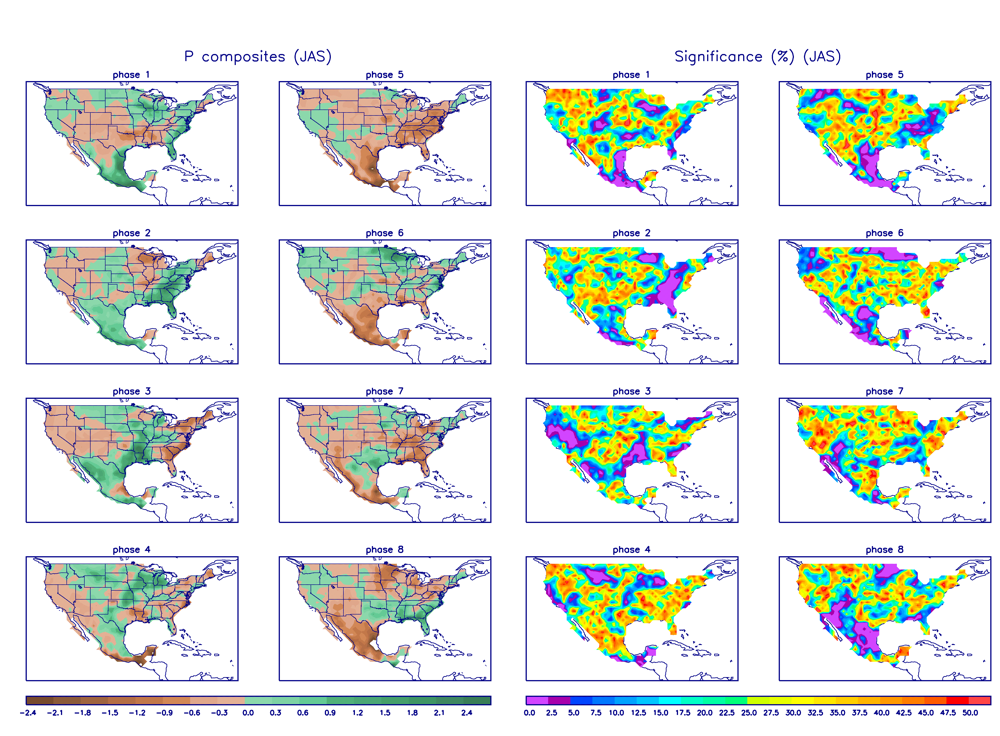
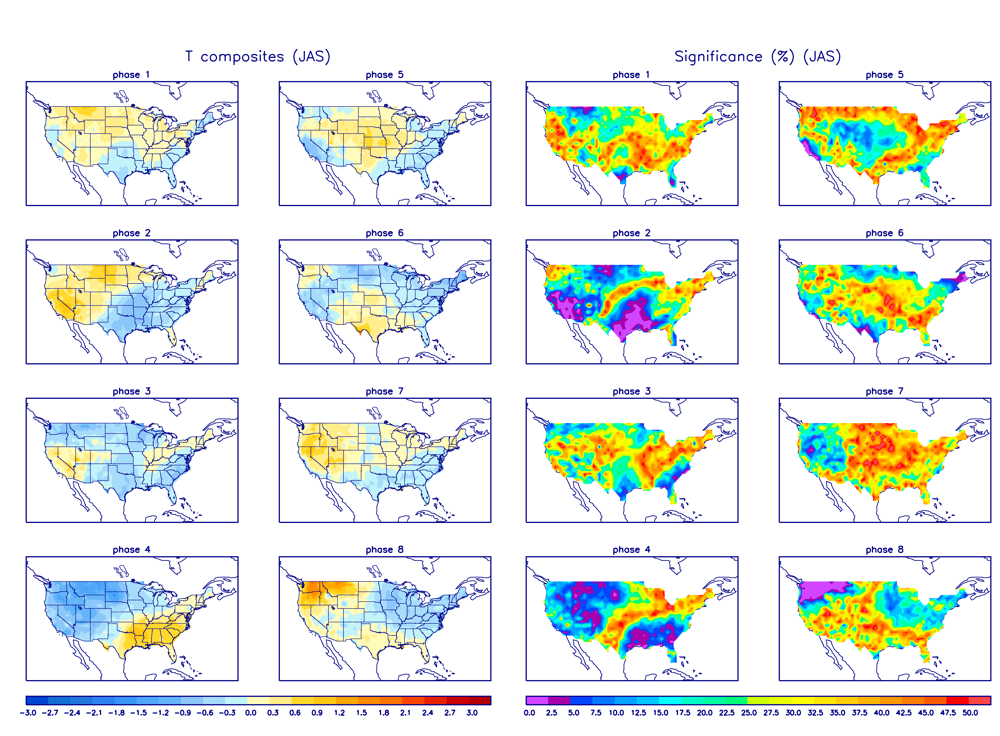
- Teleconnections (influence on weather): The MJO's temperature and precipitation teleconnections to U.S. weather depend on time of year and MJO phase. To the extent teleconnections are known, the July-September teleconnections for precipitation are shown here and for temperature are shown here.
- Observed: The MJO is transitory and can change phases (modes) within a month, so it is more closely related to weekly weather patterns than monthly. The September 2013 monthly precipitation pattern shows little correlation to the precipitation teleconnection pattern for MJO phases 1 and 2 this time of year, but there is some hint of agreement with dryness in the East for phase 5. The weekly precipitation anomalies (weeks 1, 2, 3, 4) do not show much agreement except for wet conditions in the Northwest during the last week which may correspond to phase 6. The September 2013 monthly temperature pattern shows some similarity to the teleconnections for MJO phases 1, 2, and 5 (warmer than normal in the West to Central U.S., and normal to cooler than normal in the East). Similar consistency can be seen on a weekly basis (weeks 1, 2, 3, 4) — warm anomaly patterns in the West to Central U.S. during weeks 1 and 2 are consistent with phases 1 and 2, and cool anomalies in the East and Southwest during weeks 3 and 4 are consistent with phases 5 and 6.
- The Pacific/North American (PNA) pattern
- Description: The PNA teleconnection pattern is associated with strong fluctuations in the strength and location of the East Asian jet stream. PNA-related blocking of the jet stream flow in the Pacific can affect weather downstream over North America, especially the West and especially in the winter half of the year.
- Status: The daily PNA index was slightly positive for most of the month, turning strongly negative at the end of September, averaging positive for the month as a whole.
- Teleconnections (influence on weather): To the extent teleconnections are known, the temperature teleconnection map for this time of year (October on the maps) shows a transition to above-normal temperatures along the West Coast to Northern Plains and below-normal temperatures in the Southeast with a positive PNA, with near-normal temperatures in between. The precipitation teleconnection map for this time of year (October on the maps) shows a hint of below-normal conditions in the Great Lakes to Ohio Valley. The upper-level circulation anomaly teleconnection shows the transition to above-normal heights over the western U.S. and below-normal heights over the southeastern U.S. with a positive PNA.
- Observed: The observed warm anomalies in the central U.S. have little relationship to a positive PNA, or to any phase PNA, this time of year, but drier-than-normal conditions in the Great Lakes were observed. The observed upper-level (500 mb) chart for September 2013 shows above-normal heights over south-central Canada to the north-central U.S. and below-normal heights over the northeast Pacific to Alaska and over the Atlantic just off the eastern U.S. coast. This pattern is similar to the teleconnection for a positive PNA, except it is shifted several degrees longitude to the east.
- The Arctic Oscillation (AO) pattern
- Description: The AO teleconnection pattern relates upper-level circulation over the Arctic to circulation features over the Northern Hemisphere mid-latitudes and is most active during the cold season.
- Status: The daily AO index was weakly positive during the first half of September and negative during the second half, averaging negative for the month.
- Teleconnections (influence on weather): To the extent teleconnections are known, a negative AO this time of year (July-September) is typically associated with wetness in the Central Plains, dryness in New England, spotty dry anomalies in the Southern Plains and wet anomalies in parts of the Southeast, below-normal temperatures in the north central U.S., and below-normal upper-level circulation anomalies along the central to eastern U.S.-Canadian border.
- Observed: The September 2013 monthly temperature and precipitation anomaly patterns are generally opposite that expected with a negative AO, and the September 2013 upper-level circulation anomaly pattern does not match the teleconnection pattern for a negative AO.
- The North Atlantic Oscillation (NAO) pattern
- Description: The NAO teleconnection pattern relates upper-level circulation over the North Atlantic Ocean to circulation features over the Northern Hemisphere mid-latitudes.
- Status: The daily NAO index was positive for the first half of the month and negative for the last half of September, averaging positive for the month.
- Teleconnections (influence on weather): To the extent teleconnections are known, a positive NAO during this time of year (October on the teleconnection maps) has little correlation with temperature, is weakly associated with wetter-than-normal conditions in the Ohio Valley, and is associated with positive upper-level circulation anomalies over the eastern half of the country.
- Observed: The September 2013 precipitation anomaly patterns match those expected for a positive NAO for parts of the Ohio Valley, while the September upper-level circulation anomaly pattern shows little correspondence to that expected for any phase of the NAO.
- The East Pacific-North Pacific (EP-NP) pattern
- Description: The EP-NP teleconnection pattern relates SST and upper-level circulation patterns over the eastern and northern Pacific to temperature, precipitation, and circulation anomalies downstream over North America. Its influence during the winter is not as strong as during the other three seasons.
- Status: The SST pattern over the North Pacific during September 2013 was dominated by a large, but weakening, pool of warmer-than-normal SSTs. The monthly EP-NP index was positive for much of 2013, but turned negative during August and continued negative during September, pulling down the 3-month running mean into negative territory.
- Teleconnections (influence on weather): To the extent these teleconnections are known, a negative EP-NP index during this time of year (October on the maps) is typically associated with warmer-than-normal temperatures across the U.S. east of the Rockies, cooler-than-normal temperatures along the West Coast and in Alaska, wetter-than-normal conditions in the Northwest, below-normal precipitation in southern Alaska, above-normal upper-level circulation anomalies (weaker upper-level trough) over the eastern half of North America, and below-normal upper-level circulation anomalies (weaker upper-level ridge) over western Canada and Alaska.
- Observed: The September monthly temperature anomalies for Alaska and the contiguous U.S. are consistent with a negative EP-NP, except along the East Coast. The September precipitation anomalies for the Pacific Northwest are consistent with a negative EP-NP, but those for Alaska are not. The September 2013 upper-level circulation anomaly pattern seems shifted slightly westward from that expected with a negative EP-NP, but is generally consistent with it.
- The Pacific Transition (PT) pattern
- Description: The PT teleconnection pattern relates upper-level circulation over the central subtropical North Pacific to circulation features over the eastern United States. It is most influential during August and September.
- Status: The PT index was positive for September.
- Teleconnections (influence on weather): To the extent teleconnections are known, a positive PT during this time of year is associated with above-normal temperatures across western North America, below-normal temperatures in the eastern U.S., drier-than-normal conditions in the Northern Rockies, Midwest, and Alaska, and a pattern of below-normal upper-level circulation anomalies over Alaska and the northeast Pacific, above-normal upper-level circulation anomalies over the western U.S. to central Canada, and below-normal circulation anomalies over the eastern United States.
- Observed: The September 2013 temperature anomaly pattern matches that for a positive PT across parts of the country, primarily the Mid-Atlantic Coast to Northeast and the Northern Plains to Pacific Northwest. The precipitation anomaly pattern matches that expected for a positive PT for the Midwest but not for Alaska. The September 2013 upper-level circulation anomaly pattern is similar in shape to that expected for a positive PT, but seems shifted a few degrees longitude to the east.
 |
 |

Examination of these circulation indices and their teleconnection patterns, and comparison to observed September 2013 temperature, precipitation, and circulation patterns, suggest that the MJO, PNA, NAO, EP-NP, and PT drivers each exerted some influence on September weather. ENSO was neutral, and thus not a player, and the AO did not seem to be influential. Those drivers associated with the Pacific (MJO, EP-NP, and PT) appeared to exert a controlling influence on the temperature patterns. The Pacific drivers (PNA, EP-NP, and PT) also seemed to have a strong influence on the upper-level circulation. Precipitation is not as strongly correlated to any of the atmospheric drivers during the early fall as it is during the winter, with random convective processes playing a greater role in precipitation during September, but the PNA, NAO, and PT seemed to have a common influence on the Great Lakes to Midwest dryness, while the EP-NP was the likely driver influencing the Pacific Northwest wetness. This month illustrates how competing atmospheric drivers may work in phase to create a complex weather pattern.