Monthly Report Summary Information
The Monthly Report Summary Information is a synopsis of the collection of national and global summaries released each month.
National Summary Information - July 2015
See Full Report
For extended analysis of regional temperature and precipitation patterns,as well as extreme events, please see our full report that will be released on August 12th.

Significant climate events for July 2015
July 2015 warmer and wetter than average for the US
The Northwest and Southeast were warm while the central U.S. was cool. Record precipitation in parts of California did little to improve long-term drought.
The July contiguous U.S. average temperature was 73.9°F, 0.2°F above the 20th century average and ranked near the middle in the 121-year period of record. The average contiguous U.S. temperature for January-July was 53.0°F, 1.7°F above the 20th century average, and the 10th warmest year-to-date on record.
The July precipitation total for the contiguous U.S. was 3.16 inches, 0.38 inch above average. This was the 14th wettest July on record, and marked the fourth consecutive month of above-average precipitation for the Lower 48. Above average precipitation was observed across much of the West, Great Plains, and Ohio Valley. Below-average precipitation was observed in parts of the Southern Plains, Southeast, and Northwest.
This analysis of U.S. temperature and precipitation is based on data back to January 1895, resulting in 121 years of data.
July
Temperature
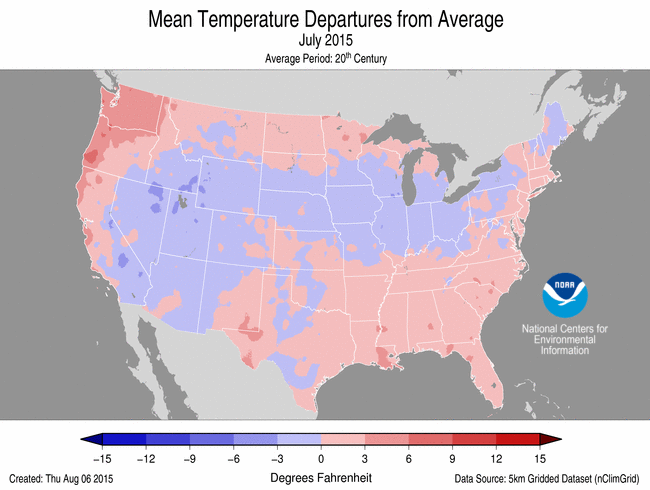

July 2015 Temperature Departure from Average (top)
and Precipitation Departure from Average (bottom)
- Above-average temperatures were observed in Alaska and the Northwest—Washington had its fourth warmest July. The Southeast was also warmer than average where Florida, Louisiana, Mississippi, and South Carolina were all much warmer than average. Louisiana had its third warmest July on record. No state was record warm.
- Below-average temperatures stretched from the Great Basin, through the Central Rockies, and into the Central Plains and Midwest. Above-average precipitation across these regions was associated with suppressed daytime temperatures. No state had July temperatures that were much cooler than average.
Precipitation
- In the West, California, Nevada and New Mexico were much wetter than average. California had its second wettest July on record with 0.64 inch of precipitation, 0.46 inch above average. This is the dry season for California—even small precipitation totals can cause large departures from average compared to history. In mid-July, the remnants of Hurricane Dolores impacted the state with record precipitation observed in Los Angeles and San Diego. Flash flooding caused significant impacts, including destroying a busy bridge on Interstate Highway 10. The precipitation did little to improve long-term drought conditions or improve wildfire conditions in northern parts of the state.
- Above-average precipitation was also observed in the Ohio Valley, where four states were much wetter than average. Kentucky had its wettest July on record with 8.99 inches of precipitation, 4.65 inches above average. This bested the previous record of 8.25 inches set in 1910. This is the second consecutive month with record wetness in parts of the Ohio Valley.
- Below-average precipitation was observed across parts of the Northwest, with worsening drought conditions in the region. Below-average precipitation was also observed across parts of the Great Lakes and Southeast. Louisiana had its ninth driest July on record.
- According to the August 4 U.S. Drought Monitor report, 27.1 percent of the contiguous U.S. was in drought, up slightly since the end of June. Drought conditions improved across parts of the Southwest and Northeast. In the Southeast, drought improvement and degradation were mixed, with only scattered precipitation impacting the region. Drought conditions remain dire across California, with 46.0 percent of the state experiencing the worst category of drought (D4, exceptional).
- Outside of the contiguous U.S., drought conditions worsened across both Alaska and Puerto Rico. In Alaska, rains in the southern parts of the state improved drought, but drought expanded into the North Slope. Wildfires continue to ravage the dry, central regions of the state. In Puerto Rico, precipitation deficits continue to accumulate across the eastern half of the island. By early August, 20.3 percent of Puerto Rico was in extreme drought.
U.S. climate highlights: Year-to-date (January-July)
Temperature

Jan-Jun 2015 Temperature Departure from Average (top)
and Precipitation Departure from Average (bottom)
- Above-average temperatures were observed from the Great Plains to the West Coast, as well as in the Southeast. Oregon and Washington each had their warmest year-to-date on record, with temperatures more than 5.0°F above average. Ten additional states were much warmer than average, including Alaska which had its second warmest January-July in the 91-year period of record. After a record warm first half of 2015 in California, the near-average July temperature bumped 2015 to the second warmest year-to-date, behind 2014.
- Below-average year-to-date temperatures were observed across the Midwest and Northeast mostly due to a very cold start to the year. Maine, New York, and Vermont were each much cooler than average, while no state was record cold.
Precipitation
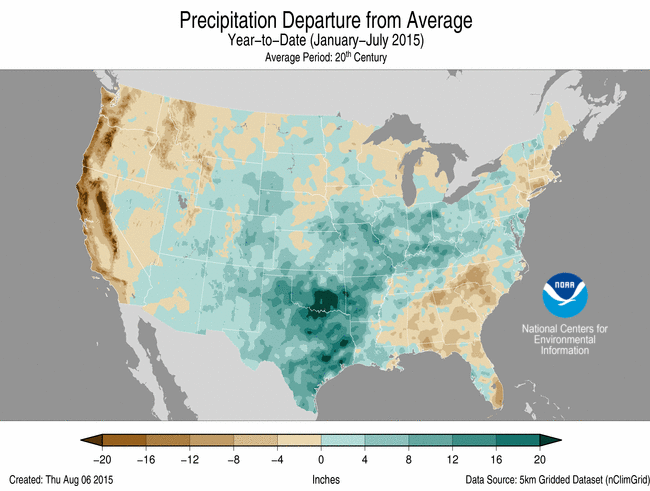
- The year-to-date contiguous U.S. precipitation total was 19.71 inches, 1.62 inches above the 20th century average, the 17th wettest January-July on record and wettest since 1998.
- Above-average precipitation was observed across the Great Plains, Southern Rockies, and Midwest where eight states were much wetter than average. No state was record wet, but Oklahoma and Texas each had their second wettest January-July on record. Below-average precipitation was observed across the West, Southeast, Northeast, and parts of the Great Lakes. California had its fifth driest start to the year, while Connecticut had its seventh driest and Oregon its ninth driest.
Extremes
- The U.S. Climate Extremes Index (USCEI) for the year-to-date was 50 percent above average and the 10th highest value on record. On the national-scale, extremes in warm maximum and minimum temperatures, one-day precipitation totals, and days with precipitation were much above average. The USCEI is an index that tracks extremes (falling in the upper or lower 10 percent of the record) in temperature, precipitation, land-falling tropical cyclones, and drought across the contiguous U.S.
For extended analysis of regional temperature and precipitation patterns, as well as extreme events, please see our full report that will be released on August 12th.