Monthly Report Summary Information
The Monthly Report Summary Information is a synopsis of the collection of national and global summaries released each month.
Global Summary Information - May 2015
See Full Report
Note: With this report and data release, the National Centers for Environmental Information is transitioning to improved versions of its global land (GHCN-M version 3.3.0) and ocean (ERSST version 4.0.0) datasets. Please note that anomalies and ranks reflect the historical record according to these updated versions. Historical months and years may differ from what was reported in previous reports. For more, please visit the associated FAQ and supplemental information.
May 2015 was warmest May on record;
March–May and year-to-date also record warm
The globally averaged temperature over land and ocean surfaces for May 2015 was the highest for the month of May since record keeping began in 1880. March–May and the year-to-date (January–May) globally averaged temperature were also record high.
Global highlights: May 2015
- During May, the average temperature across global land and ocean surfaces was 1.57°F (0.87°C) above the 20th century average. This was the highest for May in the 1880–2015 record, surpassing the previous record set last year in 2014 by 0.14°F (0.08°C).
- The May globally-averaged land surface temperature was 2.30°F (1.28°C) above the 20th century average. This tied with 2012 as the highest for May in the 1880–2015 record.
- The May globally-averaged sea surface temperature was 1.30°F (0.72°C) above the 20th century average. This was the highest for May in the 1880–2015 record, surpassing the previous record set last year in 2014 by 0.13°F (0.07°C).
- The average Arctic sea ice extent for May was 730,000 square miles (5.5 percent) below the 1981–2010 average and 27,000 square miles larger than the smallest sea ice extent that occurred in May 2004. This was the third smallest May extent since records began in 1979, according to analysis by the National Snow and Ice Data Center using data from NOAA and NASA.
- Antarctic sea ice during May was 500,000 square miles (12.1 percent) above the 1981–2010 average. This was the largest May Antarctic sea ice extent on record, surpassing the previous record-large May extent of 2014 by 20,000 square miles.
- According to data from NOAA analyzed by the Rutgers Global Snow Lab, the Northern Hemisphere snow cover extent during May was 780,000 square miles below the 1981–2010 average. This was the sixth smallest May Northern Hemisphere snow cover extent in the 49-year period of record. Six of the seven small May snow cover extents have occurred in the past six years. North America had its third smallest May snow cover extent, while the Eurasian snow cover extent was the 12th smallest.

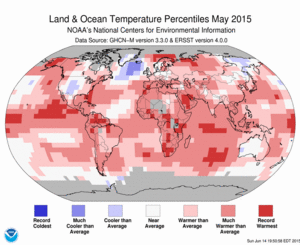
May 2015 Blended Land and Sea Surface
Temperature Percentiles May 2015 Blended Land & Sea Surface Temperature Anomalies in °C
Global highlights: Seasonal (March–May 2015)
- During March–May, the average temperature across global land and ocean surfaces was 1.53°F (0.85°C) above the 20th century average. This was the highest for March–May in the 1880–2015 record, surpassing the previous record of 2010 by 0.07°F (0.04°C).
- During March–May, the globally-averaged land surface temperature was 2.39°F (1.33°C) above the 20th century average. This was the highest for January–May in the 1880–2015 record, surpassing the previous record of 2010 by 0.07°F (0.04°C).
- During March–May, the globally-averaged sea surface temperature was 1.19°F (0.66°C) above the 20th century average. This was the highest for March–May in the 1880–2015 record, surpassing the previous record of 2010 by 0.07°F (0.04°C).
- During January–May, the average temperature across global land and ocean surfaces was 1.53°F (0.85°C) above the 20th century average. This was the highest for January–May in the 1880–2015 record, surpassing the previous record of 2010 by 0.16°F (0.09°C).
- During January–May, the globally-averaged land surface temperature was 2.56°F (1.42°C) above the 20th century average. This was the highest for January–May in the 1880–2015 record, surpassing the previous record of 2007 by 0.09°F (0.05°C).
- During January–May, the globally-averaged sea surface temperature was 1.13°F (0.63°C) above the 20th century average. This was the highest for January–May in the 1880–2015 record, surpassing the previous record of 2010 by 0.02°F (0.01°C)

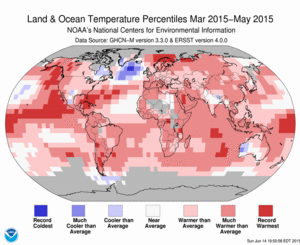
March–May 2015 Blended Land and Sea Surface
Temperature Percentiles March–May 2015 Blended Land & Sea Surface Temperature Anomalies in °C
Global highlights: Year-to-date (January–May 2015)
For extended analysis of global temperature and precipitation patterns, please see our full May report
 NOAA's National Centers for Environmental Information
