Monthly Report Summary Information
The Monthly Report Summary Information is a synopsis of the collection of national and global summaries released each month.
Global Summary Information - April 2014
See Full Report
April 2014 global temperature ties for record highest
Year-to-date sixth warmest on record
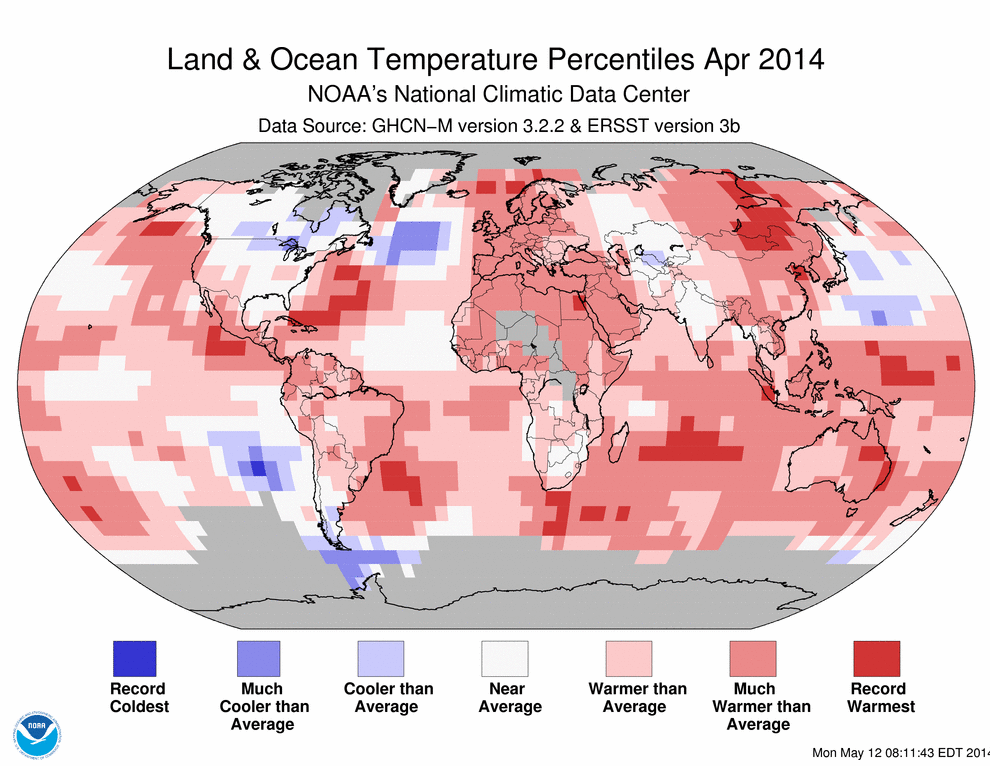
Many areas of the world were much warmer than average, with much of central Siberia observing temperatures more than 9°F (5°C) above the 1981–2010 average. This region, along with parts of eastern Australia and scattered regions in every major ocean basin, were record warm, as indicated by the Land & Ocean Percentiles map below. No land areas were record cold.
Global temperature highlights: April
- The combined average temperature over global land and ocean surfaces tied with 2010 as the highest on record for April, at 58.09°F (14.47°C) or 1.39°F (0.77°C) above the 20th century average. The margin of error associated with this temperature is ±0.14°F (0.08°C).
- April marked the 38th consecutive April and 350th consecutive month with a global temperature above the 20th century average. The last below-average temperature for April was in 1976 and the last average or below-average temperature for any month was February 1985.
- The average global land temperature was the third highest on record for April, at 2.43°F (1.35°C) above the 20th century average. The margin of error is ±0.20°F (0.11°C).
- Some national highlights are included below:
- Although the global temperature tied for record highest, the contiguous U.S. observed only its 46th warmest April and much of Canada had cooler-than-average to near-average temperatures for the month. This contrast is an example of how a globally-averaged temperature can differ from a single smaller region.
- It was the third warmest April since records began in 1910 for the United Kingdom, at 3.2°F (1.8°C) above the 1981–2010 average. April also marked the fifth month in a row of above-average temperatures for the UK.
- Following its third warmest March on record, the average April temperature across Norway was the seventh highest for the month since national records began in 1900, at 4.3°F (2.4°C) above the 1981–2010 average.
- Denmark had its fourth warmest April on record, at 5.4°F (3.0°C) higher than the 1961–1990 average, with records dating back to 1874. Including this year, the four warmest Aprils for the country have all occurred since 2007.
- Australia observed its seventh highest average temperature for April since records began in its 105-year period of record, at 2.02°F (1.12°C) higher than the 1961–1990 average. The average minimum temperature was fourth highest for April, at 2.38°F (1.32°C) above average, with Queensland setting a new record high monthly minimum temperature for the state.
- For the ocean, the April global sea surface temperature was 0.99°F (0.55°C) above the 20th century average of 60.9°F (16.0°C), the third highest for April on record. The margin of error is ±0.09°F (0.05°C).
- Neither El Niño nor La Niña conditions were present across the central and eastern equatorial Pacific Ocean during April. However, according to NOAA's Climate Prediction Center, the chance of El Niño increases for the rest of the year, exceeding 65 percent during the Northern Hemisphere summer 2014.
- As is typical, monthly precipitation varied greatly across the globe during April, with many areas seeing either much below-average or much above-average precipitation. Notably, a few areas of western South America, northern Africa, and Southeast Asia were record dry. Part of the southeastern U.S., southern Argentina, and the southeastern tip of South Africa were record wet.
- Severe Tropical Cyclone Ita made landfall in Queensland Australia north of Cooktown on April 11. According to satellite data, rain was falling at a rate of 3.6 inches (91 mm) per hour near the center of the storm as it approached land. The storm also severely impacted the Solomon Islands, along with Papua New Guinea and nearby islands.
- On April 29 and 30, torrential rain fell across the Southeast, Mid-Atlantic, and northeastern United States. In Pensacola, Florida, the two-day precipitation total was 20.47 inches (520 mm). With 15.55 inches (395 mm) of the total falling on the 29th, this marked the all-time wettest calendar day in Pensacola since records began in 1880, breaking the previous record of 15.29 inches (388 mm), recorded on October 5th 1934 when an unnamed tropical storm impacted the area.
- According to NOAA data analyzed by the Rutgers Global Snow Lab, the Northern Hemisphere snow cover extent for April was the sixth smallest in the 48-year period of record at 11.0 million square miles, which was 0.6 million square miles below the 1981–2010 average. Eurasian snow cover extent was the smallest on record for April, dipping below the previous record small April snow cover extent that occurred in 2008. The North American snow cover extent was the 14th largest on record.
- The average Arctic sea ice extent for April was 5.46 million square miles, 240,000 square miles (4.1 percent) below the 1981–2010 average, resulting in the fifth smallest monthly April extent on record, according to the National Snow and Ice Data Center.
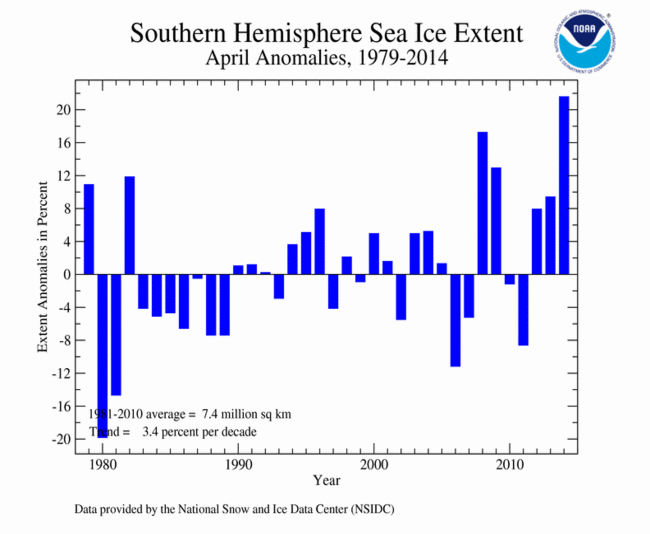
- On the opposite pole, the Antarctic sea ice extent for April was 3.47 million square miles, 610,000 square miles (21.6 percent) above the 1981–2010 average. This marked the largest April Antarctic sea ice extent on record, surpassing the previous record large April Antarctic sea ice extent that occurred in 2008 by more than 120,000 square miles. Much of the above-average ice extent occurred in the Weddell Sea off the West Antarctic coast.
- Combining the Arctic and Antarctic sea ice, April global sea ice was 8.93 million square miles, 4.5 percent above the 1981–2010 average. This was the third largest global April sea ice extent on record, behind April 1982 and 1979.
- January–April was the sixth warmest such period on record, with a combined global land and ocean average surface temperature of 1.15°F (0.64°C) above the 20th century average of 54.8°F (12.6°C). The margin of error associated with this temperature is ±0.18°F (0.10°C).
- The January–April worldwide land surface temperature was 1.89°F (1.05°C) above the 20th century average, tying with 2005 as the sixth warmest such period on record. The margin of error is ±0.43°F (0.24°C).
- The global ocean surface temperature for the year to date was 0.88°F (0.49°C) above average, tying with 2004 as the third warmest such period on record. The margin of error is ±0.09°F (0.05°C).
 NOAA's National Centers for Environmental Information


