Monthly Report Summary Information
The Monthly Report Summary Information is a synopsis of the collection of national and global summaries released each month.
Global Summary Information - June 2013
See Full Report
June 2013 global temperatures were fifth highest on record; first half of 2013 seventh warmest on record
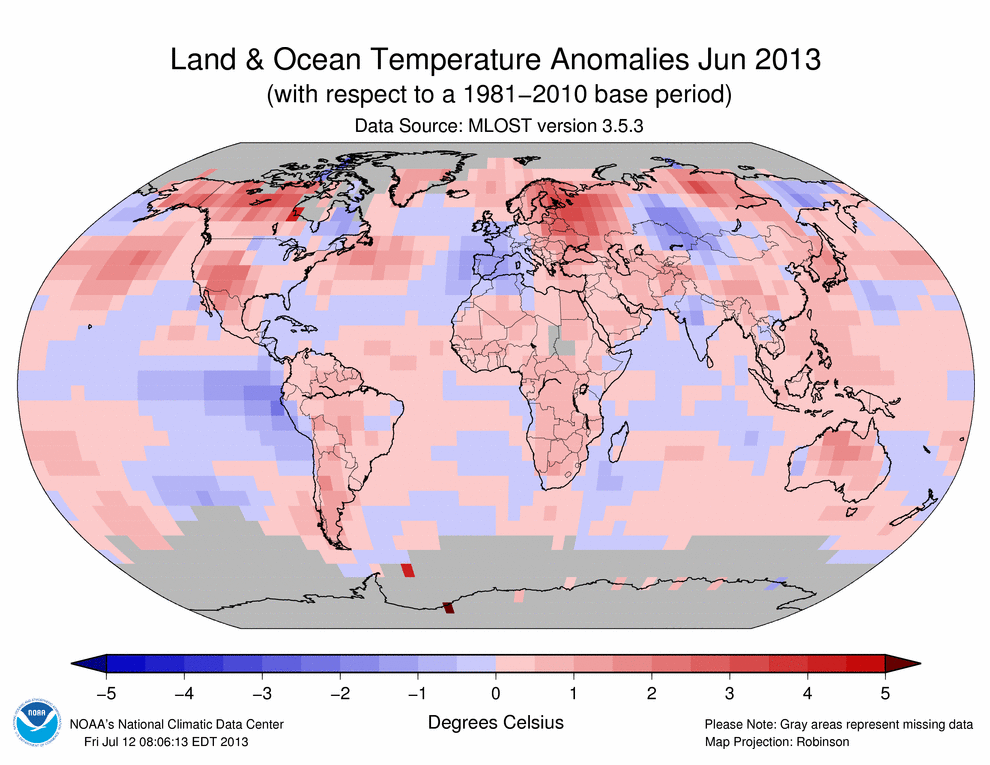
The globally-averaged temperature for June 2013 tied with 2006 as the fifth warmest June since record keeping began in 1880. June 2013 also marks the 37th consecutive June and 340th consecutive month with a global temperature above the 20th century average.
Many areas of the world experienced higher-than-average monthly temperatures, including north-central Canada, most of Alaska and the western United States, much of northern and eastern Europe, western Russia, part of northern Siberia, and north-central Australia. Meanwhile, northeastern Canada, much of western and southern Europe, central Asia, Far East Russia, and most of India were notably below average.
Global temperature highlights: June
- The combined average temperature over global land and ocean surfaces during June tied with 2006 as the fifth highest on record for June, at 61.05°F (16.14°C) or 1.15°F (0.64°C) above the 20th century average. The margin of error associated with this temperature is ±0.14°F (0.08°C).
- June marked the 37th consecutive June and 340th consecutive month with a global temperature above the 20th century average. The last below-average June temperature was June 1976 and the last below-average temperature for any month was February 1985.
- The June global land temperature was the third highest on record, at 1.89°F (1.05°C) above the 20th century average of 55.9°F (13.3°C). The margin of error is ±0.25°F (0.14°C).
- Some national highlights are included below:
- June was warmer than average across all of Japan, with temperatures ranging from 0.5°F to 2.5°F (0.3°C to 1.4°C) above the 1981–2010 average. According to the Japan Meteorological Agency, Hokuriku and the southern island of Okinawa had temperatures that were significantly above average.
- Much of Croatia was warmer than the 1961–1990 average. Scattered areas in the northwestern part of the country were "very warm" (falling in the 91st–98th percentile), according to Drzavni Hirometeoroloski Zavod.
- The United Kingdom temperature was 0.4°F (0.2°C) below the long-term average for June; however, it was also the warmest June since 2010. In England, East Anglia observed its coolest June since 1995.
- Spain observed its coolest June since 1997, with the average monthly temperature 0.5°F (0.3°C) below the 1971–2000 average. The north-central region of the country had temperatures up to 4°F (2°C) below average.
- For the ocean, the June global sea surface temperature was 0.86°F (0.48°C), above the 20th century average of 61.5°F (16.4°C), the 10th warmest for June on record. The margin of error is ±0.07°F (0.04°C).
- Continuing a pattern that has persisted for more than a year, neither El Niño nor La Niña conditions were present across the central and eastern equatorial Pacific Ocean during June, with sea surface temperatures below average across the eastern half of the equatorial Pacific. According to NOAA's Climate Prediction Center, neutral conditions continue to be favored over the next few months.
Precipitation highlights: June
- As is typical, precipitation varied greatly around the globe during June. The eastern United States and much of India were much wetter than average, with record rainfall across portions of India. Record precipitation was also observed in part of central North America and in eastern Europe in Moldova and the Ukraine. Record dryness was present across southeastern Algeria, eastern Niger, and parts of the Ivory Coast and Ghana in Africa, as well as part of the southwestern United States, a region of eastern Australia, and far northwestern Russia.
- June marks the onset of the annual southwest Asian monsoon season. For the month, India as a whole received rainfall that was 27 percent above the 1951–2000 average. Northwest India received nearly double (97 percent) of its June average rainfall; flooding devastated regions in Uttarakhand.
- Norway had its fourth wettest June since national records began in 1900, with average rainfall 60 percent higher than the monthly average.
- June was drier than average across the Republic of the Marshall Islands in the western Pacific Ocean as drought gripped the area. A state of disaster had been declared for the northern region on May 8th and was renewed on June 7th, with the atolls of Wotje and Utirik hardest hit.Please visit the June U.S. drought report for more details.
- Some regions in New Zealand were record wet for June. Eastern and northern parts of the South Island and southern and southeastern parts of the North Island had rainfall that ranged from two to four times higher than the monthly average in regions.
Polar ice highlights: June and Seasonal
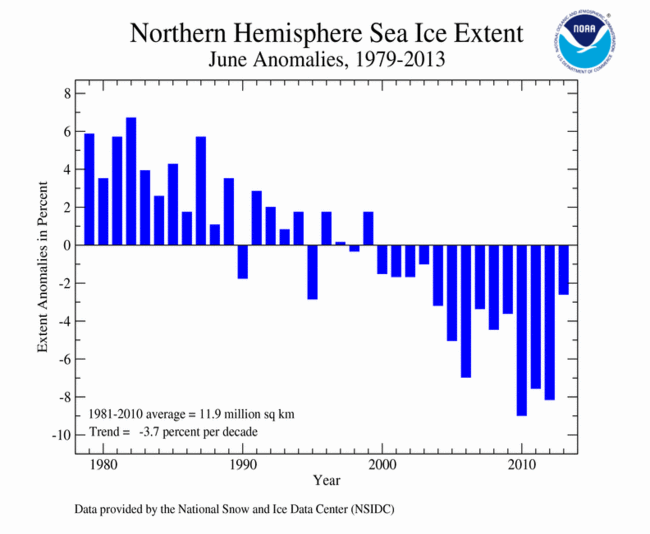
- According to data from the National Snow and Ice Data Center, the average June Arctic sea ice extent was 4.47 million square miles, approximately 120,000 square miles (2.61 percent) below the 1981–2010 average of 4.59 million square miles. This was the 11th smallest June Arctic sea ice extent in its 35-year period of record and the largest June Arctic sea ice extent since 2003.
- The June Antarctic sea ice extent was 5.66 million square miles, approximately 280,000 square miles (5.18 percent) above the 1981–2010 average of 5.38 million square miles. This marked the third largest June Antarctic sea ice extent in its 35-year period of record.
Global temperature highlights: Year-to-date
- The first half of 2013 (January–June) tied with 2003 as the seventh warmest such period on record, with a combined global land and ocean average surface temperature of 1.06°F (0.59°C) above the 20th century average of 56.3°F (13.5°C). The margin of error is ±0.18°F (0.10°C).
- The January–June worldwide land surface temperature was 1.80°F (1.00°C) above the 20th century average, the sixth warmest such period on record. The margin of error is ±0.38°F (0.21°C).
- The global ocean surface temperature for the year-to-date was 0.79°F (0.44°C) above average, tying with 2007 and 2009 as the seventh warmest such period on record. The margin of error is ±0.09°F (0.05°C).
 NOAA's National Centers for Environmental Information


