Overview:
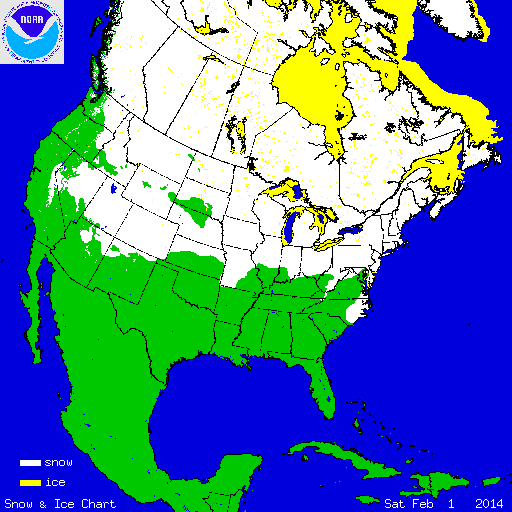
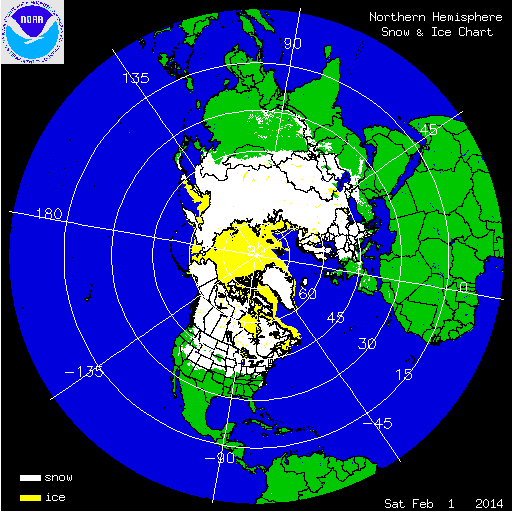
During February, numerous storms impacted the country, continuing an active pattern that began in January. The first half of the month was particularly active, with several large winter storms impacting the Great Plains, Southeast, and Northeast. According to NOAA's National Snow Analysis, at the beginning of February, 53.1 percent of the contiguous U.S. was snow covered — the Great Basin, the Central and Northern Rockies and Great Plains, the Midwest, parts of the Southeast and Mid-Atlantic, and the Northeast. Monthly snow cover peaked on February 7th, when 67.4 percent of contiguous U.S. had snow on the ground. By the 28th, snow cover shrank to 36.9 percent of the country — the high terrain of the West, the Northern Plains, Midwest, and the Northeast. The storms that impacted the Midwest and Northeast during the 2013/14 winter caused numerous major cities to have one of their ten snowiest December—February periods on record including New York City, Philadelphia, Chicago, and Boston. Detroit had its snowiest three-month period with 78.0 inches of snow. The 1981-2010 average snowfall for Detroit is 32.8 inches. A list of snowfall totals from select U.S. cities for the December 2013 – February 2014 period is available here.

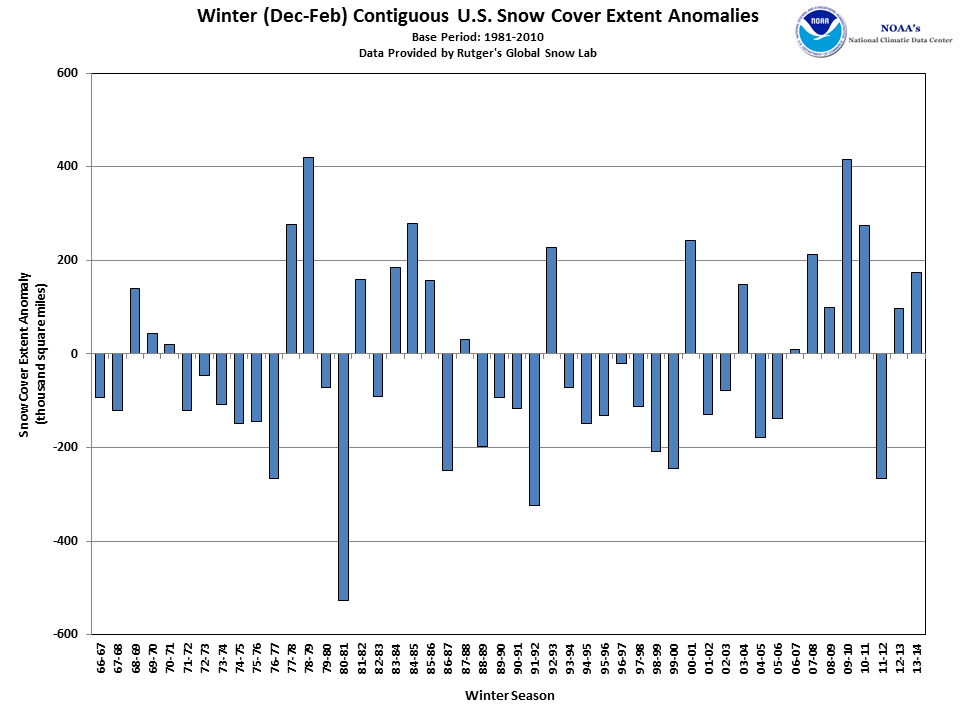
According to data from the Rutgers Global Snow Lab, the February snow cover extent for the contiguous U.S. was 1.48 million square miles, 282,000 square miles above the 1981-2010 average. This was the ninth largest February snow cover extent in the 48-year period of record for the contiguous U.S. and the largest since 2010. Above-average snow cover was observed in the Northwest, the Northern Rockies, much of the Great Plains, Midwest, and Northeast. Below-average snow cover was observed across the Southwest and Far West. For the winter season (December 2013 – February 2014), the snow cover extent for the contiguous U.S. was 1.42 million square miles, which was 170,000 square miles above the 1981-2010 average. This marked the 10th largest seasonal snow cover extent in the 1966-present period of record, and the largest since the winter of 2010/11.

Winter and spring mountain snowpack provide a crucial water source across much of the western United States. The total annual water budget for agriculture and human use in the mountainous West is highly dependent on the amount of snow melt that will occur in spring and is proportional to the amount of snow on the ground. During February, a persistent onshore flow and storm track helped increase snowpack totals across the Pacific Northwest, while two separate storms helped to marginally increase snowpack across California and the Southern Rockies. Snowpack continued to be much-above average across the Northern and Central Rockies, where storms moving from Canada, the Pacific, as well as from the south, brought heavy snow accumulations. As of March 1st, in the Sierra Nevada Mountains, the southern Cascades, and the Southern Rockies snowpack totals were less than 25 percent of normal in some locations, while snowpack was below to near average across the Great Basin and much of the Pacific Northwest. In the Central and Northern Rockies, snowpack was greater than 180 percent of normal at stations in Colorado, Wyoming, and Montana. Snowpack was also mixed across Alaska, with southern locations in the state having below average snowpack, with totals less than 50 percent of normal. Snowpack was above average across central parts of the state.
Summary of Notable Snow Events:

Back-to-back winter storms impacted the eastern half of the contiguous U.S. between February 3rd and 6th, with heavy snow and ice accumulations reported from the Southern Plains to the Northeast. The first storm system moved from the Southern Plains, through the Southeast, and off the Virginia coast on February 3rd and 4th, bringing wintry weather along its northern edge. Across the Southern Plains and Lower Mississippi River Valley, snowfall accumulations of six inches were widespread in Texas, Oklahoma, and Arkansas. As the storm moved off the Atlantic coast, snow accumulations approaching one foot were reported across a large swath of the coastal Northeast. The second, and larger storm, followed a more northerly path, with a much larger shield of wintry precipitation. Across the Central Rockies, Great Plains, and Midwest snowfall exceeded 6 inches from Colorado to Texas and to Indiana. In the Lower Mississippi River Valley, Midwest, and Mid-Atlantic, heavy ice accumulations were reported. As the storm exited the Northeast, it left behind over a foot of snow across the region. Both storms caused massive travel disruptions across the regions impacted, including widespread power outages, road closures, and thousands of cancelled flights.

11-14 February snow accumulations
On February 11th, a low pressure system moved from the Gulf of Mexico into the Southeast. The storm moved into a very cold air mass, causing widespread wintry precipitation as it moved from the Southeast and along the East Coast into the Northeast through February 14th. In the Southeast, heavy snow was reported along the northern edge of the storm, with over a foot of snow reported in North Carolina, Tennessee, and Virginia. To the south, freezing rain accumulated in Georgia, South Carolina, and eastern North Carolina. Freezing rain and ice accumulations greater than 1.0 inch were widespread causing massive power outages. As the storm moved into the Northeast, it strengthened, bringing over two feet of snow across parts of the Mid-Atlantic and Northeast. Examining only the snow's impacts on population, the storm was rated at Category 3, or major winter storm, on the Northeast Snowfall Impact Scale (NESIS). The storm caused massive interruptions along the East Coast, with several governors in the Southeast declaring a state of emergency. Many southeastern cities received the most snow and/or ice in over a decade. At least 21 fatalities were blamed on the storm and approximately 700,000 homes lost power, with half of those being in South Carolina and Georgia alone. Thousands of flights were cancelled as the storm moved into the densely populated Northeast corridor.

From February 26th through March 3rd, a powerful Pacific storm slammed into the West Coast, bringing hurricane force winds, heavy snowfall, and flooding rains. The storm eventually moved across the country, bringing heavy snow the Mid-Atlantic region the first week of March. In California, the precipitation was a welcomed sight. The state had been dealing with record dry conditions over the past year with drought engulfing almost the entire state. While this storm did bring heavy precipitation to California, large long-term precipitation deficits persisted. Impressive snowfall totals, measured in feet, were observed across the high terrain of California. Volcanic Knob measured 48 inches of snow. Heavy rainfall was also observed across California, with locations in the central part of the state receiving over 12 inches of rain. Big Bear Lake, in Southern California, had a wind gust of 102 mph. Rainfall totals across Southern California were over two inches, with many locations, including Los Angeles, receiving the most single-storm rainfall in nearly three years. The combination of recently charred lands due to wildfires and drought with the heavy rain caused landslide threats across Southern California with numerous neighborhoods being evacuated as a precaution. The heavy precipitation only marginally improved long-term drought conditions across the state, with locations in the central and northern regions still needing over 18 inches of precipitation in the next three months to end the current drought.

The cold temperatures that impacted the Great Lakes region during January and February contributed to a large portion of the lakes freezing over. According to data from the Canadian Ice Service and the Great Lakes Environmental Research Lab, during the first week of March, approximately 91 percent of the Great Lakes were ice covered. The total ice coverage was more than twice the 1981-2010 median value and the largest for the date. When examining the maximum Great Lakes ice each season back to 1973, this is the second largest ice cover for the Great Lakes, behind the 95 percent coverage in 1979. Lakes Superior, Huron, and Erie were completely ice covered. Lake Michigan was mostly ice covered, while about half of Lake Ontario was ice covered. The ice cover significantly slowed commercial shipping across the lakes. However, there were some potential positives for the large ice coverage. The ice helped to limit lake effect snow during the second half of winter. The ice cover also helps to slow evaporation from the lakes. In January 2013, Lakes Huron and Michigan reached record low levels. A contributing factor then was the increased evaporation from the lakes due lower ice cover in the past.