National Overview

February Highlights
February Temperature
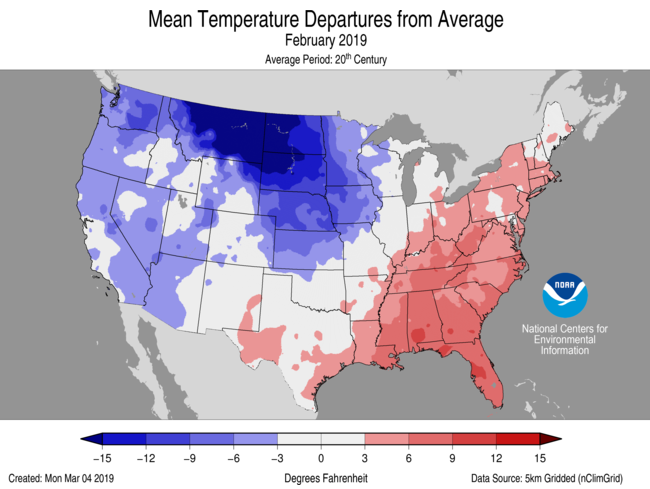
- The average contiguous U.S. temperature during February was 32.0°F, 1.8°F below the 20th century average. This ranked among the coldest third of the 125-year period of record and was the coolest February since 2010.
-
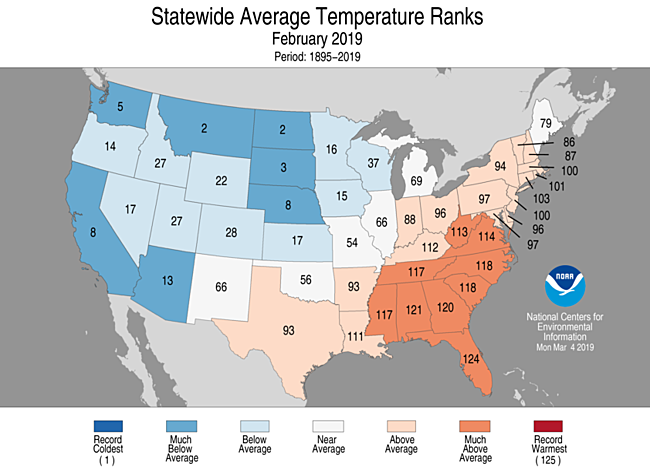
Much-above-average temperatures were observed across the Southeast. Florida had its second warmest February on record. Six additional states across the Southeast had a top 10 warm February.
- Naples, Florida, recorded its warmest February day on the 19th and also the earliest occurrence for a 90°F day on record during the calendar year. Records for Naples began in 1942.
-
Much-below- to below-average temperatures were observed from the West Coast to the Great Lakes. Montana and North Dakota ranked second coldest on record. California, Nebraska, South Dakota and Washington ranked among their 10 coldest Februaries on record. This was the coldest February for the state of Montana since 1936.
- The average monthly temperature for Great Falls, Montana, was nearly 28°F below normal and more than 10°F colder than the previous record set back in 1989.
- Havre, Montana, also broke a record which was 28°F below normal for the month and bested the previous record by 7°F, set just 12 months ago.
- High temperatures in Los Angeles, California, did not reach or exceed 70°F for the first time in February since records began in 1877.
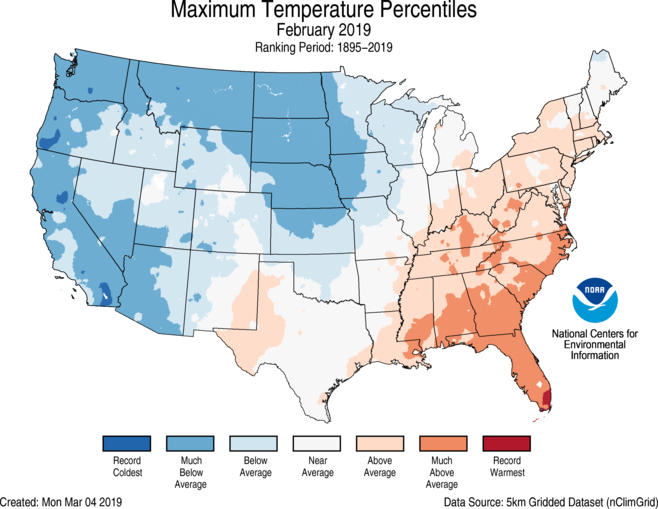
- The contiguous U.S. average maximum (daytime) temperature during February was 41.9°F, 2.9°F below the 20th century average, ranking in the coldest third of the record. Much-above-average maximum temperatures were observed across the Southeast and Ohio Valley. A small pocket of record warm maximum temperatures occurred across southern Florida. Much-below-average maximum temperatures were observed over much of the West and northern and central Plains with some record cold maximum temperatures in the far West.
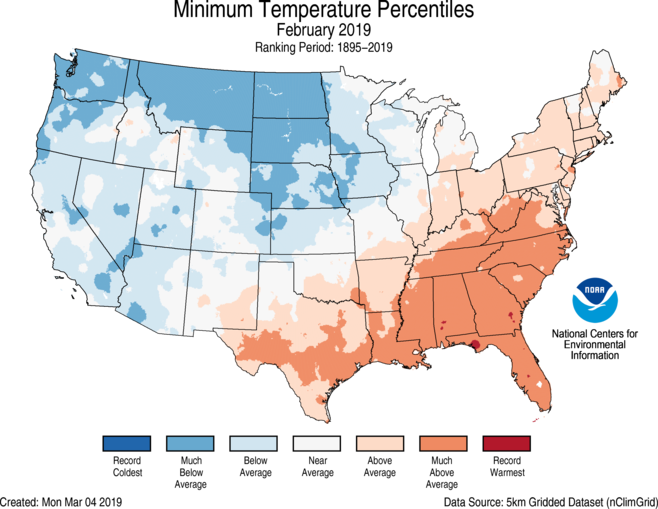
- The contiguous U.S. average minimum (nighttime) temperature during February was 22.1°F, 0.72°F below the 20th century average, ranking near the median. Much-above-average minimum temperatures were observed over a broad swath of the South, the lower Mississippi Valley, Southeast, and Mid-Atlantic states. Much-below-average minimum temperatures were observed from the Northwest to the northern and central Plains.
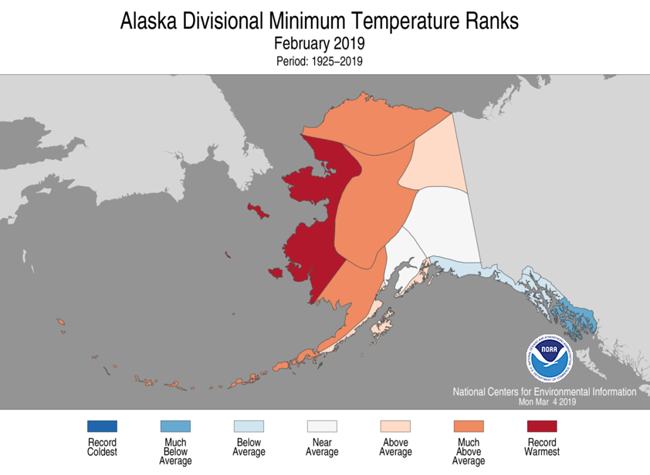
- The Alaska February temperature was 14.6°F, 9.8°F above the long-term average. This was the ninth warmest February in the 95-year period of record for the state. The western half of Alaska was much warmer than average, with below- to much-below average temperatures confined to the panhandle. Minimum temperatures for the West Coast division were record warmest during February. Bethel, Cold Bay and Kotzebue had their warmest February on record, while St. Paul had its third warmest. Conversely, Ketchikan had its coldest February since 1936.
- During February there were 4,302 record cold daily high (2,847) and low (1,455) temperature records, which was more than the 3,412 record warm daily high (1,401) and low (2,011) temperature records.
- Based on NOAA's Residential Energy Demand Temperature Index (REDTI), the contiguous U.S. temperature-related energy demand during February was 14 percent below average and the 44th lowest value in the 125-year period of record.
February Precipitation

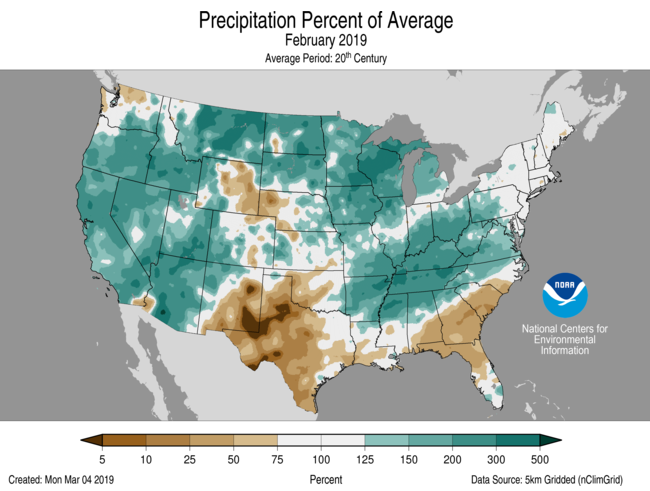
- The February precipitation total for the contiguous U.S. was 3.22 inches, 1.09 inches above average. This was the second highest February precipitation total on record for the nation and only 0.10 inch behind 1998.
-
Nineteen states from coast-to-coast had a top ten wettest February. Tennessee was record wet for the month with Kentucky and Wisconsin ranking second wettest. Texas, Florida, Georgia and South Carolina precipitation ranked below-average for the month.
- Rainfall records for the month of February were observed in Knoxville, TN (13.08 inches), Nashville, TN (13.47 inches), Bristol, TN (10.47 inches), Tupelo, MS (15.61 inches), Muscle Shoals, AL (14.13 inches), and Huntsville, AL (13.63 inches), with widespread flooding occurring along rivers and tributaries as well as mudslides impacting travel for many.
- Record February snowfall occurred across much of the northern tier of the U.S. from Washington to Wisconsin. Seattle, WA (20.2 inches), Pendleton, OR (32.5 inches), Rochester, MN (40.0 inches), Minneapolis, MN (39.0 inches), and Eau Claire, WI (53.7 inches), all broke February records by impressive margins. In Eau Claire, February 2019 snowfall also set a record for the snowiest of any month on record and surpassed the previous record (32.1 inches in January 1999) by more than 21 inches.
- As a result of the excessive rainfall occurring upstream, the Army Corps of Engineers decided to open up the Bonnet Carre Spillway in Louisiana to alleviate the pressure on the Mississippi River levee system. This is the second time in two years the spillway has been opened and the thirteeenth time since 1937. Opening the spillway can have negative impacts on the coastal oyster industry as an over abundance of fresh water contaminates the environment as it drains into the Gulf of Mexico.
- According to the February 26 U.S. Drought Monitor report, 11.9 percent of the contiguous U.S. was in drought, down from 16.5 percent at the end of January. Drought conditions improved across the Four Corners region and other parts of the West, while drought conditions worsened across portions of Texas and Puerto Rico.
Winter Highlights
December-February Temperature
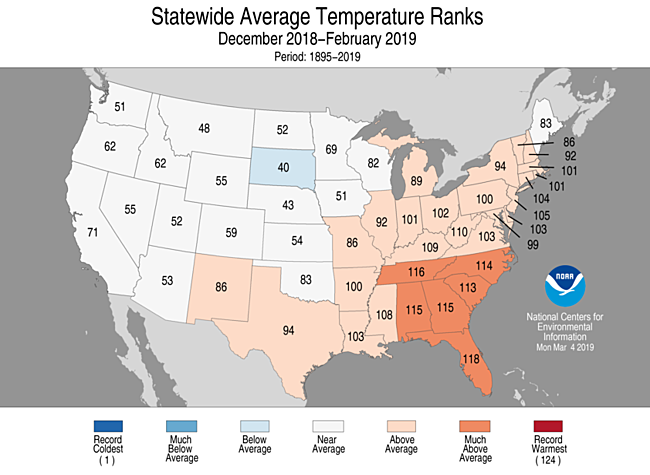
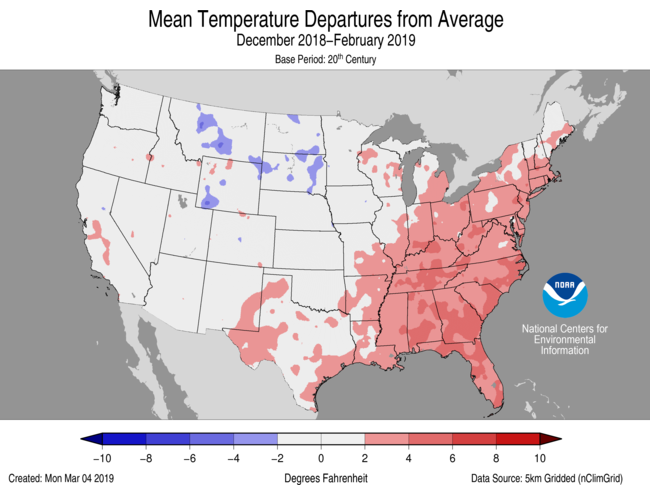
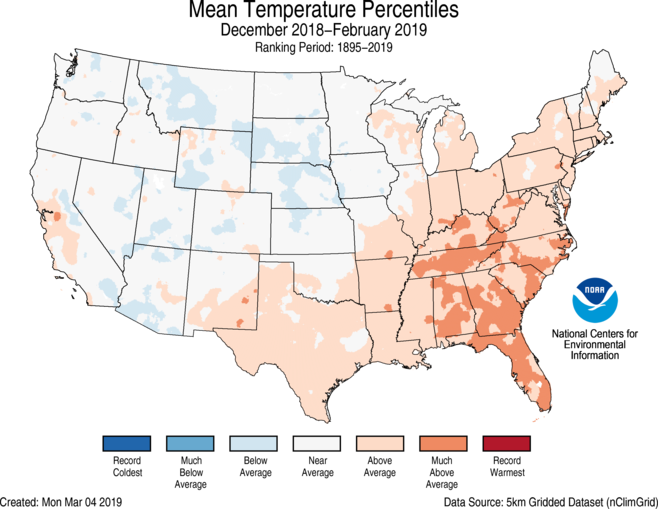
- The winter (December-February) average contiguous U.S. temperature was 33.4°F, 1.2°F above average, ranking among the warmest third of the record.
- Above-average winter temperatures were observed across much of the eastern half of the U.S. and also across parts of the Deep South. Florida, Georgia, Alabama and Tennessee had winter temperatures that ranked among their 10 warmest.
- Despite a very cold two-week stretch across much of the Midwest in late January, cooler-than-average winter temperatures were primarily observed in parts of Montana, Wyoming, South Dakota and Nebraska. No state was record warm or record cold.
- The contiguous U.S. average maximum (daytime) temperature during December-February was 43.1°F, 0.3°F below the 20th century average, ranking near the median. Above-average conditions were primarily observed east of the Mississippi River. Below-average winter maximum temperatures were observed in the Plains and parts of the West.
- The contiguous U.S. average minimum (nighttime) temperature during December-February was 23.7F, 2.0°F above the 20th century average, ranking in the warmest third of the record. Much-above-average temperatures were observed across the Southeast with above-average conditions present from the southern Plains to the Great Lakes and into the Northeast as well as in California and Nevada. Below-average minimum temperatures were observed across parts of the Rocky Mountains.
- The Alaska December–February temperature was 10.5°F, 6.9°F above the long-term average, ranking in the warmest third for the state. Much-above-average temperatures occurred in parts of the West Coast as well as throughout the North Slope and the Aleutians. Utqiaġvik (Barrow) ranked third warmest winter.
- The Arctic blast, which occurred in late January, was responsible for many cold records, including the newly verified all-time coldest temperature for Illinois reported in Mt. Carroll on January 31. The -38°F value broke the previous record of -36°F which occurred in Congerville on 5 January 1999.
December-February Precipitation
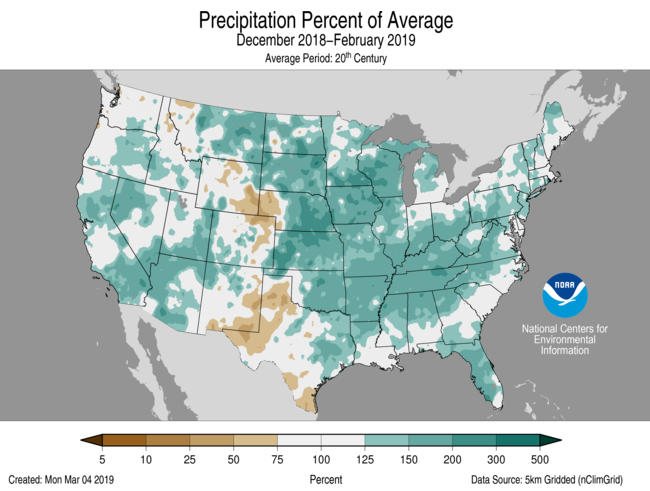
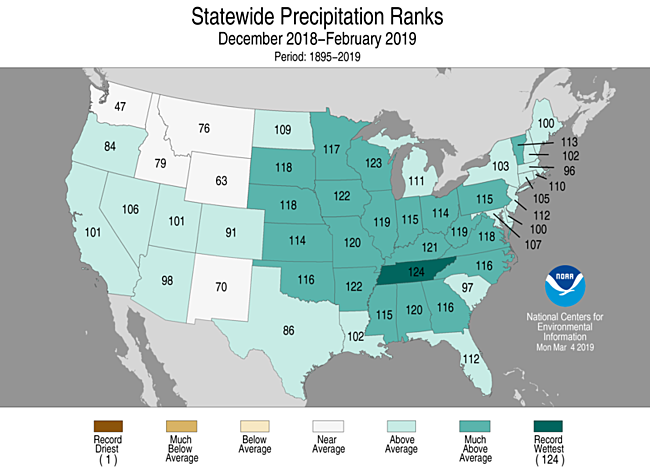
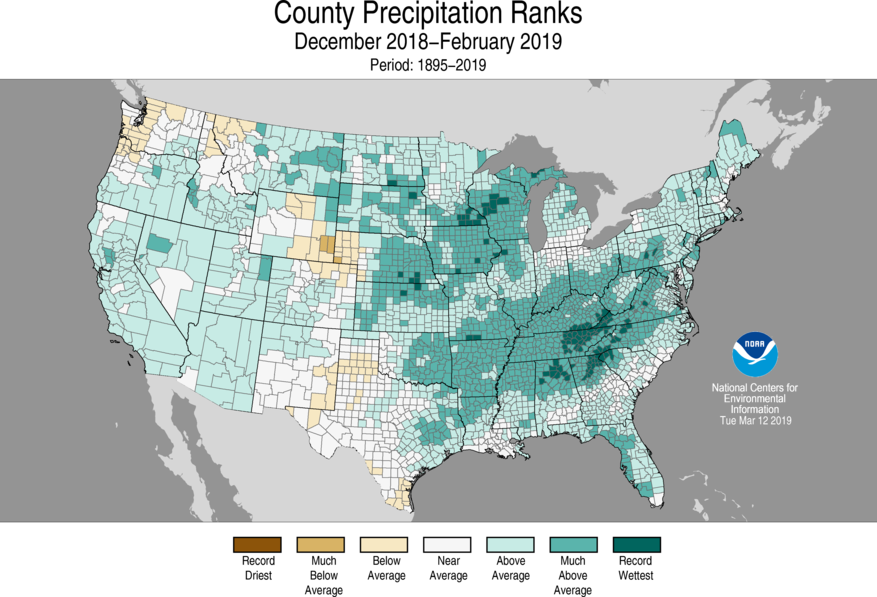
- The winter precipitation total was 9.01 inches, 2.22 inches above average, and ranked as the wettest winter on record, surpassing the winter of 1997–98 by 0.02 inch.
-
Above-average precipitation was observed across all but five of the Lower-48 states. Tennessee ranked wettest, while Wisconsin ranked second wettest. Nineteen states from the Great Plains to the East Coast and south to the Gulf of Mexico ranked in the top 10 wettest on record for winter. No state ranked below-average for winter precipitation.
- Nome, AK, had its second highest winter snowfall (69.8 inches), due in large part to the February snowfall of 35.6 inches — the highest February snowfall reported in Nome since 1920.
- Omaha, NE, set a new record (46.1 inches) for snowiest winter. The previous record was 44.3 inches and occurred in the winter of 2003–04.
- At least one county in eighteen different states had a record wettest winter.
Extremes
-
The U.S. Climate Extremes Index (USCEI) for the winter was near average and ranked in the middle third of the 109-year period of record. Despite the near-average national value, there were elevated extremes in the spatial extent of wet conditions and the number of days with precipitation. The USCEI is an index that tracks extremes (falling in the upper or lower 10 percent of the record) in temperature, precipitation and drought across the contiguous United States.
- On the regional scale, only the Southeast had a CEI value that ranked in the top 10 for the season. The Southeast CEI value was the sixth highest on record due to extremes in warm minimum temperatures, the spatial extent of wet conditions, heavy one-day rainfall, and the number of days with precipitation. In the Northeast, Upper Midwest, Central, and South regions, the component that measures extremes in the extent of wet conditions ranked in the top ten for the season. On a whole, the majority of extremes observed were based on widespread, heavy and prolonged wet periods during the winter.
**A comparison of the national temperature departure from average as calculated by NCDC's operational dataset (nClimDiv), the U.S. Historical Climatology Network (USHCN), and the U.S. Climate Reference Network (USCRN) is available on our National Temperature Index page.**
Regional Highlights
These regional summaries were provided by the six Regional Climate Centers and reflect conditions in their respective regions. These six regions differ spatially from the nine climatic regions of the National Centers for Environmental Information.
Northeast Region (Information provided by the Northeast Regional Climate Center)
- The Northeast's average temperature for February was 27.4 degrees F (-2.6 degrees C), 1.2 degrees F (0.7 degrees C) warmer than normal. Nine of the region's twelve states experienced a warmer-than-normal February. Average temperature departures for all states ranged from 0.8 degrees F (0.4 degrees C) below normal in Maine to 4.5 degrees F (2.5 degrees C) above normal in West Virginia, making it the state's 13th warmest February since recordkeeping began. With above-normal temperatures in December and February and a near-normal January, the winter season also wrapped up on the warm side of normal for the Northeast. The region's average temperature of 26.9 degrees F (-2.8 degrees C) was 1.0 degree F (0.6 degrees C) above normal. All but two states were warmer than normal for the season, with average temperature departures ranging from 0.5 degrees F (0.3 degrees C) below normal in Maine to 2.8 degrees F (1.6 degrees C) above normal in West Virginia, the state's 15th warmest winter on record.
- For the ninth consecutive month, the Northeast was wetter than normal. The region received 3.33 inches (84.58 mm) of precipitation in February, 123 percent of normal. Eight states were wetter than normal, with precipitation for all states ranging from 92 percent of normal in Connecticut to 178 percent of normal in West Virginia, the state's 7th wettest February. All three winter months (December, January, and February) featured above-normal precipitation for the Northeast. With that, the region had its 11th wettest winter since 1895, receiving 11.91 inches (302.51 mm) of precipitation, 129 percent of normal. All states experienced a wetter-than-normal winter, with seven ranking this winter among their 20 wettest on record: West Virginia, sixth wettest; Pennsylvania, 10th wettest; Vermont, 12th wettest; New Jersey, 13th wettest; Rhode Island, 15th wettest; Maryland, 18th wettest; and Connecticut, 20th wettest. Precipitation ranged from 114 percent of normal in Massachusetts to 146 percent of normal in West Virginia.
- February kicked off with the coldest air of the winter season entrenched in the region. High temperatures were as much as 30 degrees F (17 degrees C) colder than normal, and low temperatures were subzero or in the single digits (degrees F) for most areas. Strong winds created dangerously low wind chills, causing some schools to close. A sudden and dramatic warm up occurred a few days later. From February 3 to 8, temperatures up to 75 degrees F (24 degrees C) set daily high temperature records at several major climate sites. Snow melt, rain, and ice jams caused flooding in western Pennsylvania and parts of New York. A winter storm brought a messy mix of precipitation to the Northeast from February 11 to 13. The greatest precipitation totals included up to 12 inches (30 cm) of snow in northern New England, up to 0.50 inches (13 mm) of ice accretion in parts of Maryland and eastern West Virginia, and up to 1.60 inches (40.64 mm) of rain in western Pennsylvania and northern West Virginia. Strong winds accompanied the storm. Travel was difficult in some areas, with numerous crashes and cancelled flights. Ice accumulation led to several roads being closed in New Jersey and downed tree branches in Maryland. Power outages were also reported. On February 20, a winter storm brought a mix of snow, sleet, freezing rain, and rain to southern and eastern parts of the region. The greatest accumulations were up to 10 inches (25 cm) of snow in south-central Pennsylvania and western Maryland and up to 0.25 inches (0.64 cm) of ice in the eastern half of Pennsylvania, northern New Jersey, and southeastern New York. Lightning and thunder were reported in parts of western Maryland and the Eastern Panhandle of West Virginia. Impacts from the storm included difficult travel conditions, thousands of power outages, and schools and government offices being closed. On February 24 and 25, wind gusts of up to 88 mph (39 m/s) caused damage across the Northeast. The National Weather Service noted that the Pittsburgh International Airport in Pennsylvania had a wind gust of 61 mph (27 m/s), which was the site's highest non-thunderstorm-related wind gust since the airport was built in 1952. Numerous trees, branches, and wires were downed, leading to road closures and more than 450,000 power outages across the region. Roofs, shingles, and siding were blown off buildings, and poles and signs were knocked down. In some areas, schools were closed. Significant blowing and drifting of snow, with some drifts as high as 10 feet (3 m), made numerous roads impassable in northern Maine. Near Buffalo, New York, lake ice was shoved on shore close to several houses, leading to voluntary evacuations. Lake ice also breached the ice boom at the mouth of the Niagara River, allowing ice to flow down the river and causing some ice jam flooding. Wind-whipped waves contributed to some flooding along Lake Ontario's shoreline. In addition, lake-effect snow and strong winds created blizzard conditions east of Lake Ontario.
- For more information, please visit the Northeast Regional Climate Center Home Page.
Midwest Region (Information provided by the Midwest Regional Climate Center)
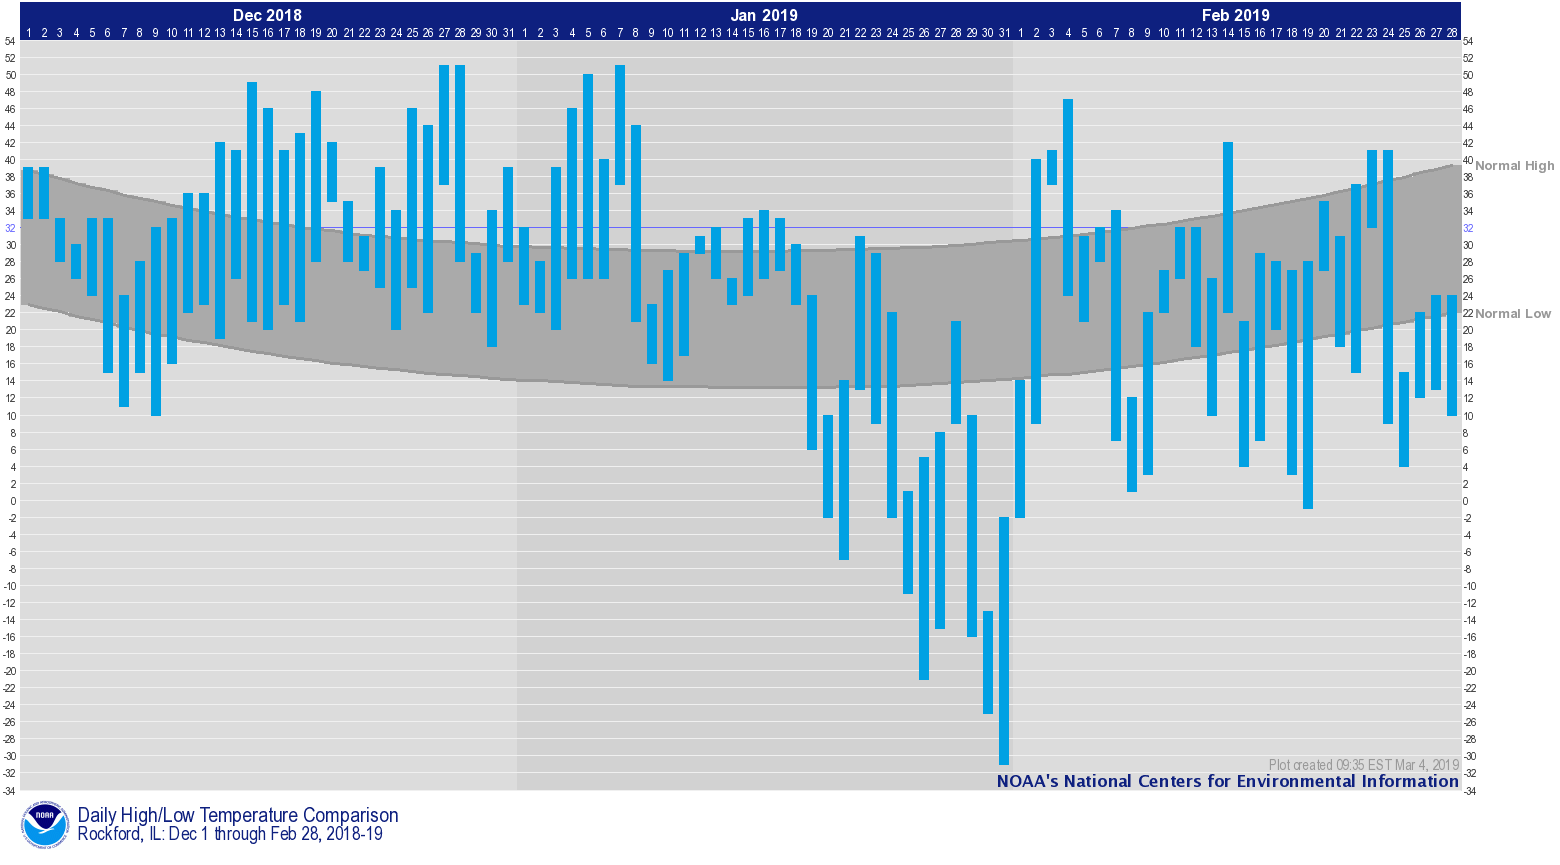
- February precipitation was well above normal with 2019 ranking as the 2nd wettest February for the Midwest (125 year record starting in 1895), trailing only last February. The region wide values of 3.47 inches (215 mm) exceeded the normal value for February by 48 percent. Eight of the nine Midwest states ranked among the wettest 10 percent of their histories for February, with two states ranking 2nd wettest (Kentucky and Wisconsin), two ranking 4th wettest (Michigan and Minnesota), Iowa ranking 6th, Indiana and Ohio ranking 7th, Missouri ranking 12th, and Illinois ranking 15th out of 125 years. The wettest areas were the Ohio River Valley, with precipitation values running two to three times normal, and the northwestern part of the Midwest, with values running from two to five times normal. More than 110 stations in the region set a new February precipitation record, at least one in every state. Some notable locations with new records included Dayton, Ohio (100 year period of record), Rockford, Illinois (119 years), Sault Ste Marie, Michigan (131 years), Marquette, Michigan (148 years), Rochester, Minnesota (105 years), Wausau, Wisconsin (118 years), and Eau Claire, Wisconsin (127 years). Wet conditions were common throughout the winter, with December at 123 percent of normal and January at 132 percent of normal, the winter season ranked as the 3rd wettest on record. Wisconsin recorded its 2nd wettest winter, Iowa ranked 3rd, Kentucky 4th, Missouri 5th, Illinois 6th, Minnesota 8th, Indiana 10th, Ohio 11th, and Michigan 20th.
- February temperatures ranged from well below normal in the northwestern states to well above normal in the southeastern states. Temperatures were 10 degrees F (6 C) or more below normal in western parts of Iowa and Minnesota and 5 degrees F (3 C) or more above normal in the southeastern half of Kentucky. Statewide values ranged from 15th coldest in Iowa and 16th coldest in Minnesota to 14th warmest in Kentucky. The Arctic outbreak at the end of January and into the first of February came to an end in many locations (more than 500 stations) with a warmup of 70 to 90 degrees F (39 to 50 C) in just a few days (January 29 to February 4) with some of the biggest warmups in eastern Iowa, southeastern Minnesota, northern Illinois, and southwestern Wisconsin. The city with the biggest warmup was Rockwell City, Iowa which went from a minimum temperature on January 31st of -35 degrees F (-37 C) to a maximum temperature on February 4th of 59 degrees F (15 C). Mather, Wisconsin had nearly as big a swing in temperatures, but did so in even fewer days recording a minimum of -47 degrees F (-44 C) on February 1st to 44 degrees F (7 C) on February 3rd. Winter temperatures followed a similar pattern with colder than normal conditions in the northwest and warmer than normal conditions in the southeast. Temperature departures ranged from about 4 degrees F (2 C) below normal in western Minnesota to about 3 degrees F (2 C) above normal in southern Kentucky. The winter was generally above normal for the first half of the season followed by cold conditions for the latter half of January and February particularly in the northwestern half of the region.
- Snowfall in February ranged from record values in parts of the northern Midwest to less than an inch (3 cm) for much of Kentucky. Record snowfall in Eau Claire for February of 53.7 inches (136.4 cm) not only set a February record (127 period of record), but also a record for any month at that location. Snowfall totals of greater than 30 inches (76 cm) extended from northern Iowa and southern Minnesota, across parts of Wisconsin, and all of the Upper Peninsula of Michigan. Totals exceeding four feet (122 cm) of snow stretched from southeastern Minnesota to much of Upper Michigan. Numerous February snow storms led to above normal snow for the northern half of the Midwest as well as some above normal snow in the southern half of the region. In the northern Midwest, snowfall totals were as much as five times normal from southeastern Minnesota to central Wisconsin. More than 115 stations across the Midwest set February snowfall records, mainly across Iowa, Minnesota, Wisconsin, and Michigan. Some large cities with long records that also set records included Des Moines (135 year record) and Waterloo (122 years) in Iowa, Duluth (129 years) and Minneapolis-St. Paul (135 years) in Minnesota, Houghton (99 years) and Sault Ste Marie (130 years) in Michigan, and La Crosse (123 years) and Wausau (97 years) in Wisconsin. Impacts on travel were significant due to the heavy and frequent snows. On February 24th, one of the worst accidents in Wisconsin history, involving 131 vehicles, led to 70 injuries and one fatality.
- The wet conditions across the Midwest have saturated soils across the region. In addition, there is substantial water stored in the snow pack in the upper Midwest. Both of these factors put the region at risk for continued major flooding (Ohio River Valley) or for the development of major flooding (Mississippi River Valley). Another factor in the flood risk was relatively deep frost levels which developed where snow cover was minimal prior to the cold outbreak at the end of January. Many rivers in the northern Midwest have substantial ice development which could also lead to ice jam flooding. With all the moisture in the winter, there has been no drought in the region since the start of the year. February precipitation even wiped out the remaining areas noted as abnormally dry. Having no areas in the region noted as abnormally dry, according to the US Drought Monitor, has not happened since May 2017 and only two other times in the history of the US Drought Monitor (since 2000).
- For further details on the weather and climate events in the Midwest, see the weekly and monthly reports at the Midwest Climate Watch page.
Southeast Region (Information provided by the Southeast Regional Climate Center)
- Overall, temperatures in the Southeast region were above normal this February (excluding Puerto Rico and the U.S. Virgin Islands), especially portions of Florida, southern Georgia, Alabama and the eastern Carolinas, where mean temperatures ranged from 5 to 15 degrees F (2.8 to 8.3 degrees C) above normal. Cape Hatteras NC (1874-2019) recorded its warmest February on record, with an average mean temperature of 57.2 degrees F (14 degrees C). This was 1.6 degrees F (0.9 degrees C) warmer than the previous warmest Februarys on record: 2017 and 2018. Wilmington, NC (1871-2019) had 12 days with high temperatures in the 70s degrees F (21 degrees C), five of those days being consecutive. In Florida, it was the warmest February on record at Gainesville (1890-2019) and Key West (1871-2019), second warmest at Orlando (1952-2019), and tied for the second warmest at both Miami (1895-2019) and Tampa (1890-2019). The warmest temperatures of the month occurred February 5-8, as the Bermuda High and a large upper level ridge brought record-breaking temperatures to portions of the region. Daily maximum temperatures reached 85 degrees F (29.4 degrees C) in Jacksonville, FL (1871-2019) and 83 degrees F (28.3 degrees C), in both Wilmington NC (1871-2019) and Columbia, SC (1887-2019). Atlanta, GA (1878-2019) tied for the warmest winter (DJF) max temperature, reaching 80 degrees F (26.6 degrees C). Other stations experienced their warmest winter (DJF) day on record as well, including Montgomery, AL (1872-2019) at 86 degrees F (30 degrees C), and Gainesville, FL (1890-2019) at 91 degrees F (32.7 degrees C) on February 23rd. Daily temperature minimums were exceptionally high over parts of the region, as a persistent influx of subtropical moisture suppressed nighttime cooling during the month. The coldest reported temperature in Atlanta GA during the month was 34 degrees F (1.1 degrees C), setting a monthly record for the warmest daily minimum temperature. It is the first time since 1957 Atlanta, GA (1878-2019) experienced its lowest February minimum temperature above 32 degrees F (0 degrees C). The large-scale pattern did not usher in much cold air this month. The coldest weather occurred at the beginning of the month in association with the intense Arctic outbreak that affected the Plains and Midwest. Even as some of this cold air reached the extreme northern sections of the region, high temperatures were only 3 to 5 degrees F (1.6 to 2.7 degrees C) below average. Monthly mean temperatures were near average in Puerto Rico and the U.S. Virgin Islands.
- For the month of February, above average precipitation was seen in the northern and western parts of the Southeast region, while below average precipitation was observed across the southern and eastern parts. Muscle Shoals (1893-2019) and Huntsville (1894-2019), AL both had their wettest February on record at 14.13 inches (358.9 mm) and 13.72 inches (348.5 mm), respectively. Reidsville, NC (1962-2019) recorded 6.56 inches (166.6 mm) of rain, which was its wettest February on record. Brevard (1902-2019; 13.8 inches, 350.5 mm), Cullowhee (1909-2019; 10.4 inches, 264.1 mm), and Waynesville (1894-2019; 9.1 inches, 231.1 mm) in western NC each recorded their second wettest February on record. Cape Hatteras, NC (1874-2019) reported 3.50 inches (88.9 mm) of rain on the 4th, which was their third highest 1-day February total. The system that caused severe weather in parts of Alabama and Georgia also brought heavy rains to parts of western North Carolina that caused minor flooding and mudslides near the North Carolina, Tennessee border. In contrast, Montgomery, AL (1872-2019) reported its 4th driest February on record at 1.65 inches (41.9 mm) of precipitation. Although western North Carolina was wet this month, it wasn't very snowy. Mount Mitchell, NC (1980-2019) recorded 3.0 inches (76.2 mm) of snow on February 20th, and this turned out to be the total snowfall for the entire month, making it the second-lowest February snowfall since 1980. Washington Dulles, VA (1962-2019) reported the region's highest snow total for the month at 6.4 inches (162.6 mm), with 4.7 inches (119.4 mm) occurring on February 20th. Blacksburg, VA (1952-2019) and Roanoke, VA (1912-2019) reported 3.8 inches (96.5 mm) and 2.5 inches (63.5 mm). of snow, respectively, which was below normal for both locations.
- There were 83 severe weather reports during February. This is less than 90 percent of the median monthly frequency of 95 severe weather reports during 2000 – 2016. Of those, 85 percent (71 of 83) were wind reports. A total of 10 tornadoes (4 EF-1s and 6 EF 0s) were confirmed across the region, which is higher than the median frequency of 7 tornadoes observed during February. They were spawned by severe thunderstorms associated with two strong cyclones that crossed region during the month. A line of severe thunderstorms moved east through the region on February 12th with high winds and wind damage across parts of Alabama, Georgia, South Carolina and North Carolina. There was an EF-1 tornado with estimated wind speed of 95 mph (42.5 m/s) confirmed in Orangeburg County South Carolina. It damaged several trees and three structures. There were 3 confirmed EF-0 tornadoes in Fayette County, Henry County, and Clayton County Georgia. Several trees were uprooted and branches snapped, as well as damage to shingles from these tornadoes with winds around 75 mph (33.5 m/s). On February 23rd-24th 4 confirmed tornadoes were observed across western and central Alabama. In Lamar and Coosa counties two EF-1 tornadoes with winds 95 – 105 mph (42.5 – 46.9 m/s) were reported; and in Pickens and Fayette counties, two EF-0 tornadoes with winds 75-80 mph (33.5 – 35.8 m/s) were reported. These tornadoes snapped power poles, uprooted trees, and caused minor structural damage and even lifted a manufactured home off its foundation. On the morning of the 24th, an EF-1 tornado was confirmed in Coweta county Georgia. It had winds around 90 mph (40.2 m/s) and damaged several large trees. Two houses received damage from a falling trees, and the metal roofing was removed from a barn. Power lines and power poles were also knocked down. Damaging straight-line winds were observed across western Alabama and western Georgia as well. Grandfather Mountain in North Carolina reported the highest wind gust for the month at 121.95 mph (54.5 m/s) on February 24th, as the center of an intense low pressure system responsible for the severe weather moved across the Great Lakes.
- Small areas of moderate drought (D1) and slightly larger areas of abnormally dry (D0) conditions were present in parts of the Southeast throughout February. Although drought improvement occurred in eastern Florida, it was not enough to keep it out of abnormally dry (D0) conditions. The heavier precipitation in the northern and western parts of the region, missed the coastal areas of South Carolina, southern North Carolina and eastern Georgia, leading to an expansion of abnormally dry conditions (D0) there. Puerto Rico's drought conditions only worsened by the end of the month with abnormally dry (D0) conditions expanding, and moderate drought conditions covering more than 32 percent of the commonwealth by the end of the month. The warmer than normal February means that plants are blooming ahead of schedule. In Georgia, livestock producers, field crops, fruit and vegetable growers all noted negative impacts from too much moisture. Florida reported that most seasonal agricultural activities proceeded normally.
- For more information, please visit the Southeast Regional Climate Center Home Page.
High Plains Region (Information provided by the High Plains Regional Climate Center)
- February was cold and snowy across portions of the High Plains, causing many locations to be ranked in the top 10 coldest and snowiest Februaries on record. Dickinson, North Dakota and Rapid City, South Dakota had their coldest Februaries on record, while Fargo, North Dakota, Grand Forks, North Dakota, and Omaha, Nebraska had their snowiest. This cold end to the winter did not result in very many records for coldest winter, however, because the beginning of winter was quite warm. On the other hand, numerous locations experienced a wet and/or snowy winter, as storm systems crossed the region quite often and brought periodic snowfall. In addition to February, Omaha also had its snowiest winter on record. Several locations are on track to have their snowiest season (July-June) on record, such as Lincoln, Nebraska, which had already had its 2nd snowiest season as of the end of February and only had 5.1 inches (13 cm) to go to tie the record.
- These recent conditions have caused several impacts around the region. On a positive note, mountain snowpack in Wyoming and Colorado has been plentiful thus far this season, and it has helped ease drought conditions in these areas. However, it is yet to be determined how spring runoff may impact low streamflows. The abundant snowpack in the Plains has raised concerns for spring flooding, especially due to the high water content of the snowpack. Furthermore, the frequent snowfall and need for clearing roads caused a shortage of snow removal supplies in some urban areas. The extreme cold conditions have caused some issues for the energy industry, as wind turbines were shut down and energy demand for heating buildings was especially high. Recent conditions have brought about concerns for agriculture as well. As calving season is getting into full swing, livestock producers are concerned about losing calves in harsh conditions. Frost depths are particularly deep in portions of the Dakotas, which is likely to delay planting in these areas, especially of spring wheat. In Kansas, late-planted winter wheat may be at risk, as prolonged cold and snowy/wet conditions will promote little growth of the crop and delay the application of fertilizer.
- February was quite cold across the High Plains. Nearly the entire region experienced below-normal temperatures for the month. Departures ranged from approximately 2.0 degrees F (1.1 degrees C) below normal in western areas of Wyoming and Colorado to an astounding 21.0 degrees F (11.7 degrees C) below normal in western North Dakota. It was among the top 10 of coldest Februaries for many locations across the High Plains, particularly in the Dakotas where Dickinson, North Dakota and Rapid City, South Dakota had their coldest Februaries on record. In North Dakota, several places had an average February temperature that was below 0.0 degrees F (-17.8 degrees C), such as Williston, where the average February temperature was only -4.5 degrees F (-20.3 degrees C). A combination of cold temperatures and abundant snow cover produced impressive frost depths across the Dakotas. For instance, according to the North Dakota Agricultural Weather Network (NDAWN), in early March the station at Adams had a frost depth of 69 inches (175 cm), while Minot had a frost depth of 59 inches (150 cm). In northern South Dakota, several South Dakota mesonet stations were reporting frost depths of 50-65 inches (127-165 cm).
- Despite the extremely cold end to the winter, average winter temperatures were only slightly below normal, with departures ranging from 1.0-5.0 degrees F (0.6-2.8 degrees C) below normal. This was due to the very warm start to the winter, as much of the region experienced above-normal temperatures in December. One exception was McCook, Nebraska, which tied for its 6th coldest winter on record (period of record 1894-2019).
- Much of the High Plains experienced wet and snowy conditions during February. Precipitation exceeded 200 percent of normal in eastern portions of the region, and this February ranked among the top 10 of wettest and snowiest Februaries for numerous locations throughout the Dakotas and Nebraska. For instance, Fargo, North Dakota had it snowiest and 6th wettest February on record, while it was the 3rd snowiest and 8th wettest February for Pierre, South Dakota. Meanwhile, dry conditions prevailed in eastern Wyoming and the Nebraska Panhandle, which received less than 50 percent of normal precipitation for the month. Chadron, Nebraska and Laramie, Wyoming each had their 5th driest Februaries on record.
- Periodic winter storms pounded the region during the month, causing numerous impacts. In early February, heavy snow and high winds caused blizzard conditions in eastern North Dakota, prompting the closure of Interstates 29 and 94, as well as many other roads. Snow drifts were quite impressive, nearly reaching up to the roofs of some homes. In the middle part of the month, a winter storm caused a large vehicle pileup on Interstate 70 near Concordia, Kansas, killing one person. A few days later, a winter storm caused a pileup of several semis on Interstate 80 near Grand Island, Nebraska. An extremely impactful winter storm crossed the region on the 22nd-23rd. High snowfall rates caused numerous flights to be delayed or cancelled at Denver International Airport. Over 200 miles of Interstate 80 were closed in southern Nebraska due to heavy snow and low visibility. The official snowfall total for Lincoln, Nebraska on the 23rd was 8.0 inches (20 cm), which was its 4th highest 1-day total snowfall on record for the month of February. Given that precipitation began as rain, there was a layer of ice underneath the snow, which hampered snow removal efforts. In fact, the city ran low on snow removal materials, further complicating the issue.
- Not only was February wet and snowy for the Dakotas and Nebraska, but for the winter season too. For instance, Omaha, Nebraska had its snowiest winter on record with 46.1 inches (117 cm), beating the old record of 44.3 inches (113 cm) set in 2003-2004 (period of record 1881-2019). Lincoln, Nebraska had its 2nd wettest winter on record and was only 0.3 inches (1 cm) shy of having its snowiest winter. However, western portions of the region experienced a dry winter. Laramie, Wyoming had its 4th driest winter on record, while it was the 9th driest for Akron, Colorado.
- Snowpack conditions continued to improve in Wyoming and Colorado in February. By the end of the month, Snow Water Equivalent (SWE) was above normal in all Colorado basins, including southwestern basins where drought was most severe during the past year. SWE was above normal in nearly all Wyoming basins, including the Wind River Basin where SWE was below normal at the end of January. In the Upper Missouri Basin, mountain SWE above Fort Peck Reservoir and between Fort Peck and Garrison Reservoirs vastly improved to 108 percent of average and 102 percent of average, respectively, by the end of February. SWE was below average in both reaches one month ago. Plains snowpack was ample in February, as the Dakotas, most of Nebraska, northern Kansas, and eastern Colorado were covered with snow by the end of the month.
- Overall, drought conditions continued to improve throughout the High Plains in February. The area experiencing abnormal dryness or drought (D0-D4) on the U.S. Drought Monitor decreased from approximately 33 percent to 31 percent from late January to the end of February, while the area in drought (D1-D4) decreased from 17 percent to 14 percent.
- Widespread improvements in drought conditions occurred throughout Colorado, which has been dealing with drought since late 2017. Frequent storms occurred throughout February, bringing beneficial snowfall to Colorado's southwestern basins where drought was most intense. As a result, exceptional drought (D4) was completely removed, and extreme drought (D3) was nearly eliminated with the exception of extreme southern areas of the state.
- Plains snowpack has been ample this season as well, which helped improve drought conditions in the Dakotas. Snowy weather in February prompted a reevaluation of conditions, ultimately leading to the removal of moderate drought (D1) in North Dakota and abnormally dry conditions (D0) across both states.
- Despite overall improvements, degradations in drought conditions occurred as well. D0 was introduced to northern Wyoming, northeastern Colorado, and the Nebraska Panhandle. These areas missed out on abundant precipitation during the winter months, receiving less than 50 percent of normal precipitation.
- For more information, please visit the High Plains Regional Climate Center Home Page.
Southern Region (Information provided by the Southern Regional Climate Center)
- Temperatures for the month of February varied spatially across the Southern Region, with below normal temperatures in the northwestern part of the region and above normal temperatures in the southeastern part of the region. Parts of northern, northeastern, and far western Oklahoma as well as a small part of northern Texas experienced temperatures 3 to 6 degrees F (1.67 to 3.33 degrees C) below normal. Parts of northern Texas as well as western, northern, northeastern, central, and southwestern Oklahoma experienced temperatures 0 to 3 degrees F (0.00 to 1.67 degrees C) below normal. Parts of western, central, and eastern Texas, southwestern, central, and northeastern Louisiana, southeastern Oklahoma, west-central, southeastern, and eastern Arkansas, northern and southwestern Mississippi, and much of Tennessee experienced temperatures 3 to 6 degrees F (1.67 to 3.33 degrees C) above normal. Parts of southeastern Louisiana, southern, central, and northeastern Mississippi, and central and eastern Tennessee experienced temperatures 6 to 9 degrees F (3.33 to 5.00 degrees C) above normal. The statewide monthly average temperatures were as follows: Arkansas – 46.00 degrees F (7.78 degrees C), Louisiana – 57.50 degrees F (14.17 degrees C), Mississippi – 54.80 degrees F (12.67 degrees C), Oklahoma – 40.70 degrees F (4.83 degrees C), Tennessee – 46.70 degrees F (8.17 degrees C), and Texas – 51.90 degrees F (11.06 degrees C). The statewide temperature rankings for February were as follows: Arkansas (thirty-fourth warmest), Louisiana (fifteenth warmest), Mississippi (ninth warmest), Oklahoma (fifty-sixth coldest), Tennessee (ninth warmest), and Texas (thirty-fourth warmest). All state rankings are based on the period spanning 1895-2019.
- Precipitation values for the month of February varied spatially across much of the Southern Region, with above normal values in the northeastern part of the region and below normal values in the western part of the region. Parts of northern, western, southern, central, and eastern Texas; central and southwestern Oklahoma, southwestern and southeastern Louisiana, and coastal Mississippi received 50 percent or less of normal precipitation. Parts of southwestern Oklahoma as well as northern, central, southern, and western Texas received 25 percent or less of normal precipitation. Parts of northern and western Texas as well as extreme southeastern Louisiana received 5 percent or less of normal precipitation. In contrast, parts of eastern and southeastern Oklahoma, northern Louisiana, northern Mississippi, southeastern, central, western, and northern Arkansas, and practically all of Tennessee received 150 percent or more of normal precipitation. Parts of western, central, northern, southeastern, and northeastern Arkansas, northern Mississippi, northeastern Louisiana, and most of Tennessee received precipitation 200 to 300 percent of normal. Parts of northeastern Arkansas, northern Mississippi, and northwestern, northern, and northeastern Tennessee received precipitation 300 percent or more above normal. Precipitation in Tennessee was exceptional, with almost two-thirds of the state's rain gauges recording over 12 inches (304.80 mm) during the month. The statewide precipitation totals for the month were as follows: Arkansas – 7.67 inches (194.82 mm), Louisiana – 4.22 inches (107.19 mm), Mississippi – 7.90 inches (200.66 mm), Oklahoma – 1.52 inches (38.61 mm), Tennessee – 11.90 inches (302.26 mm), and Texas – 0.88 inches (22.35 mm). The state precipitation rankings for February were as follows: Arkansas (ninth wettest), Louisiana (fifty-ninth driest), Mississippi (fifteenth wettest), Oklahoma (fifty-seventh wettest), Tennessee (first wettest), and Texas (twenty-ninth driest). All state rankings are based on the period spanning 1895-2019.
Drought and Severe Weather
- At the end of February, drought conditions degraded across parts of the Southern Region. Moderate drought classifications were still present in parts of extreme western Texas while new areas appeared in northern, central, and southern Texas as well as southwestern Oklahoma. There were no drought conditions in Tennessee, Louisiana, Arkansas, and Mississippi. There was an increase in the overall area experiencing abnormally dry conditions, with areas developing in southern Louisiana while areas expanded in Texas and Oklahoma.
- In February, there were a total of 67 storm reports across Oklahoma, Texas, Arkansas, Louisiana, Mississippi, and Tennessee. There were 7 tornado reports, 13 hail reports, and 47 wind reports. Mississippi tallied the most tornado (4) and wind reports (19) while Texas tallied the most hail reports (6). Mississippi tallied the most reports total (26) while Louisiana tallied the least (4). Three states (Arkansas, Mississippi, and Tennessee) reported tornadoes. There were 10 days in February with at least one storm report, with almost three-quarters of the monthly total occurring on three days (15 on February 6, 13 on February 7, and 22 on February 23).
- On February 6, 2019, there were 15 storm reports across Texas, Oklahoma, Arkansas, and Tennessee. Two EF-0 tornadoes were reported in Tennessee while an EF-1 tornado was reported in Arkansas. A wind gust of 58 mph (93.34 kph) was reported near Dallas, Texas, and there were several reports of trees downed and property damage.
- On February 7, 2019, there were 13 wind reports across Arkansas. Numerous trees and power lines were downed and property damage was also reported.
- On February 11, 2019, a brief, weak tornado was reported in Mississippi. Also, there were reports of power lines, power poles, and trees blown down in central and western Mississippi.
- On February 12, 2019, a wind gust of 59 mph (94.95 kph) was reported near Shell Beach, Louisiana.
- On February 16, 2019, a wind gust of 64 mph (103.00 kph) was reported near Guadalupe Pass, Texas.
- On February 23, 2019, there were 22 storm reports across Mississippi, Tennessee, and Louisiana. There were two EF-0 tornadoes and one EF-3 tornado reported in Mississippi. The EF-3 was the first significant (EF-2 or greater) tornado of 2019 and resulted in 1 confirmed fatality.
- On February 26, 2019, golf ball sized hail was reported near Town Bluff, Texas and Cameron, Louisiana.
Western Region (Information provided by the Western Region Climate Center)
- An active weather pattern persisted throughout the month of February, bringing abundant precipitation, snowfall, and below normal temperatures to the majority of the western US.
- Below normal temperatures dominated across the West. Montana's eastern two-thirds observed the greatest departures from normal, with several locations averaging more than 20 F (11 C) below normal. Great Falls, Montana, reported an average February temperature of -0.2 F (-17.9 C), 27.5 F (15.3 C) below normal and the 3rd coldest of any month on record. Bellingham and Wenatchee, Washington, both recorded their coldest February on record at 32.5 F (0.3 C) and 21.9 F (-5.6 C), 8.3 F (4.6 C) and 12.9 F (7.2 C) below normal, respectively. The Desert Southwest was also much cooler than normal. Imperial, California, reported its coldest February in a 56-year record at 50.9 F (10.5 C), 8 F (4.4 C) below normal. Prescott, Arizona, recorded an average temperature of 35.8 F (2.1 C), 5.8 F (3.2 C) below normal and the 4th coolest February since records began in 1948. Los Angeles, California, did not observe any daily temperature meeting or exceeding 70 F (21 C) during the entire month of February for the first time since records began in 1877.
- In conjunction with development of weak El Niño conditions in the equatorial Pacific Ocean, an active storm cycle brought above normal precipitation, drought relief, as well as flooding to many areas of the West. Much of California, Arizona, Oregon, Nevada, southern Idaho, and Montana received greater than 150% of normal precipitation, improving drought conditions across this region. Palomar, in southern California, received 10.10 in (255 mm) on February 14th, marking the wettest day on record since observations began in 1901. In northern California, Santa Rosa recorded its all-time record wettest day on February 26 when it received 5.66 in (144 mm) associated with a persistent atmospheric river. Santa Rosa also recorded its second wettest February in a 117-year record at 17.09 in (485 mm), 284% of normal. Helena, Montana and Boise, Idaho observed their wettest February on record with 2.30 in (58 mm), 360% of normal, and 3.71 in (94 mm), 266% of normal, respectively. Winnemucca, Nevada, and Flagstaff, Arizona, recorded their second wettest February on record with 1.68 in (43 mm), 360% of normal, and 6.51 in (165 mm), 331% of normal, respectively. In addition, Redmond, Oregon observed its second wettest February on record since 1948 with 2.31 in (59 mm), 281% of normal. Several locations in eastern New Mexico recorded less than 5% of normal precipitation allowing drought conditions to persist or intensify in the far southeastern corner of the state.
- Snowfall records were set at many western locations. Bozeman, Montana, reported 27.1 in (69 cm) for the snowiest month since records began in 1941. Seattle, Washington recorded 20.2 in (50.3 cm), its snowiest February and 4th snowiest month in the station's 75-year record. By the end of February, snowpack was above normal in all large river basins (HUC-2) of the West, with the Rio Grande at 117% of median, Upper Colorado at 116% of median, the Lower Colorado at 150 % of median, Great Basin at 141% of median, and California and the Sierra Nevada at 162% of median. The Pacific Northwest and Missouri regions were marginally above median snowpack, both reaching 108%.
- A persistent ridge of high pressure located south of the Aleutian Islands resulted in warmer than average temperatures throughout the western and northern regions of Alaska. Bethel and Cold Bay observed their warmest February on record (29.4 F/-1.4 C and 37.8 F/3.2 C, respectively). Kotzebue recorded a monthly average temperature of 17.7 F (-7.9 C), tying the record set in 1989.
- Warm conditions rapidly deteriorated sea ice conditions in the Bering Sea. Sea ice was nearly absent south of 64 N latitude by the end of February. Meanwhile, the atypical western positon of the high pressure produced below normal temperatures in southeastern Alaska. Ketchikan recorded an average temperature of 29.6 F (-1.3 C), 6.2 F (3.4 C) below normal and the second coldest February since records began in 1910. Precipitation was confined primarily to western and northern Alaska. Central and southeastern Alaska remained well below normal, which has continued the moderate drought conditions in the panhandle.
- Several winter storms brought cooler than average temperatures and above average precipitation to Hawaii. On Maui, Hana observed 20.18 in (513 mm) of precipitation, more than 400% of normal and the second wettest February since records began in 1950. The Big Island observed the greatest temperature departures from normal, with most locations ranging from 2-5 F (1-3 C) below average. In mid-February, a cold storm brought snowfall to all summits on the Big Island. Snow levels were reported as low as 6,200 feet (1890 m).
Significant Events
- February 9: Blizzard in Washington's Yakima Valley: An unexpected blizzard killed approximately 1,800 dairy cows in Washington's Lower Yakima Valley. Sustained winds of 30- to 50 mph (48-80 kph), gusting to 80 mph (129 kph), accompanied a snowstorm totaling upwards of 18-24 in (46-61 cm) of snowfall. The Washington State Daily Federation estimates $3.2 million in damages.
- February 9-10: Potent winter storm in Hawaii: A dangerous winter storm impacted the Hawaii islands with dangerous surf, heavy snow, and damaging winds. Reports of a 191 mph (307 kph) wind gust on the Big Island Mauna Kea peak, several inches of snow reported in Maui, 45-60 foot waves, and a reported 27,000 people were without power.
- February 14: Heavy rain and flooding in southern California: A strong atmospheric river event produced heavy rainfall, triggered numerous mudslides, and severe flooding in the counties of San Diego, Orange, Riverside, San Bernardino, among several others.
- February 25-28: Major flooding in northern California: Heavy rains during a persistent atmospheric river event resulted in major flooding along the Russian River in Sonoma County. The river crested at 45.31 ft (13.8 m), the highest level observed since 1995, and stranded more than 4,500 residents of Guerneville, CA.
- For more information, please go to the Western Regional Climate Center Home Page.