Climate Extremes Index | Tornadoes | Tropical Cyclones | Snow
Map of U.S. Climate Regions | Map of U.S. Climate Divisions

2014 National Events Map
Click for more information
Issued January 12, 2015: The data presented in this report are preliminary. Ranks, anomalies, and percent areas may change as more complete data are received and processed.
National Temperature and Precipitation Analysis

In 2014, the contiguous United States (CONUS) average temperature was 52.6°F, 0.5°F above the 20th century average, and tied with 1977 as the 34th warmest year in the 120-year period of record. 2014 was slightly warmer than 2013 for the CONUS when the annual average temperature was 52.4°F. This marks the 18th consecutive year with an annual average temperature above the 20th century average for the CONUS. The last year with a below-average CONUS temperature was 1996. Since 1895, when national temperature records began, the CONUS has observed an average temperature increase of 0.13°F per decade. Precipitation averaged across the CONUS in 2014 was 30.76 inches, 0.82 inch above the 20th century average. This was the 40th wettest year on record for the CONUS. Over the 120-year period of record, precipitation across the CONUS has increased at an average rate of 0.14 inch per decade.
On a statewide and seasonal level, 2014 was a year of temperature extremes, with precipitation extremes more muted. Above-average temperatures during 2014 were observed across much of the West, Northeast, and Florida. In the West, eight states had one of their 10 warmest years on record. Arizona, California, and Nevada were each record warm, in addition to Alaska. The Arizona average temperature was 62.3°F, 2.9°F above the 20th century, besting the previous record set in 2012 by 0.2°F. The California average temperature was 61.5°F, 4.1°F above the 20th century average, besting the previous record set in 1934 by 1.8°F. The Nevada average temperature was 53.1°F, 3.6°F above the 20th century average, besting the previous record set in 1934 by 0.1°F. Below-average temperatures were observed for most locations east of the Rockies, with the coolest temperatures stretching from the Midwest to the Lower Mississippi River Valley. Seven states had an annual temperature that ranked among their 10 coolest on record. Despite several months being record and near-record cold in the region, no state had an annual temperature that was record cold, or even ranked among their five coolest years. Several cities in the western U.S. had a record, or near-record, warm year, while several cities in the central U.S. had a record, or near-record, cool year (a map of those cities is available here). Based on NOAA's Residential Energy Demand Temperature Index (REDTI), the contiguous U.S. temperature-related energy demand during 2014 was 3 percent above average and ranked as the 60th highest in the 1895-2014 period of record. On a local level during 2014, approximately 39,527 daily warm temperature records were tied or broken (14,122 warm daily maximum records and 25,405 warm daily minimum records); while approximately 49,459 daily cool temperature records were tied or broken (28,522 cool daily maximum records and 20,937 cool daily minimum records).
Overall, much of the CONUS had near-average precipitation for the year. Above-average precipitation stretched across the northern tier, from the Pacific Northwest to the Upper Midwest, and into the Northeast. Michigan and Wisconsin each had their seventh wettest year on record with precipitation totals 117 percent and 118 percent of average, respectively. Below-average precipitation was observed across the Southern Plains and parts of the Central Appalachians, but no state was top 10 dry. Despite near-average annual precipitation for California, long-term precipitation deficits (dating back over 3-years) in the state, combined with a record warm year in 2014, were associated with the exacerbation of drought conditions across the state. Several stations across the nation had either their wettest or driest calendar year, despite much of the nation having near-average precipitation (a map of those cities is available here). In terms of drought, according to the U.S. Drought Monitor, drought conditions improved across the Midwest and Central Plains, with both drought improvement and deterioration intermittent across parts of the Southern Plains, Southwest, and Southeast. Drought worsened for much of the Far West. Parts of the East had drought develop and disappear during the year. The CONUS drought footprint was 31.0 percent on Jan 1st, peaked at 40.1 percent in May, and ended the year at 28.7 percent, the smallest footprint at any point in 2014.
Seasonal highlights in 2014 included:
- The CONUS had its 33rd coolest winter on record, with much of the country east of the Rockies being cooler than average, mainly due to several Arctic cold-air outbreaks. Many states had their coldest winter since the 1970s. Seven states were top 10 cold, but no state was record cold. The cold winter in the Midwest resulted in the second largest Great Lakes ice cover in the 1973-2014 record. The western U.S. was warm during winter. Arizona had its fourth warmest winter, while California was record warm. The winter was dry for the CONUS, with a precipitation total 0.97 inch below average, the 17th driest on record. Below-average precipitation was observed in the West and Southern Plains where three states had a top 10 dry winter. The dry winter exacerbated drought conditions in California, where winter is the wet season, as well as in the Southwest and Southern Plains. The winter snow cover extent was the 10th largest on record.
- The CONUS spring temperature was near-average, which masked regional extremes. The West was warm, with California tying its fifth warmest spring on record. Cool conditions in the East continued, particularly in the Midwest and Lower Mississippi River Valley. The cool spring in the Upper Midwest allowed ice to remain in parts of Lake Superior into June, the latest observed date of such an occurrence. Other than California, no state had a spring temperature that ranked among the 10 warmest or coolest on record. The CONUS spring precipitation total was also near average, with above-average precipitation across the Northwest, Midwest, Northeast, and Southeast. Florida tied its tenth wettest spring, while Washington had its fourth wettest. Below-average precipitation was observed across the Southwest, Central and Southern Plains, and into parts of the Ohio Valley. Kansas had its third driest spring on record. The spring snow cover extent was slightly larger than average.
- The contiguous U.S. had a near-average summer temperature that was the coolest since 2009. As with much of 2014, the West was particularly warm during summer, while the East was cooler than average. California, Oregon, and Washington each had a top 10 warm summer, while Florida tied its ninth warmest. July was particularly cool in the central U.S., when three states — Arkansas, Illinois, and Indiana — were record cool during the typically hottest month of the year. The summer precipitation total for the CONUS was 9.43 inches, 1.11 inches above average, and the ninth wettest summer on record. A majority of the summer precipitation occurred in June and August. Six states across the northern tier had a top 10 wet summer. Dry conditions were observed in the Southeast, where Georgia had its 10th driest summer on record. In the Upper Midwest, Minnesota observed 8.07 inches of precipitation during June, marking the wettest month of any month for the state. During summer, the CONUS drought footprint shrank from 37.3 percent to 32.8 percent.
- Autumn was the 40th warmest on record for the CONUS, with a warmer than average September, the fourth warmest October, and the 15th coolest November. California had its warmest autumn on record, in addition to five additional states in the West that were top 10 warm. Below-average seasonal temperatures were observed in the Midwest and Southeast. Illinois and Indiana each had one of their 10 coldest autumns. The CONUS autumn precipitation total was near-average with regional and monthly extremes. A wet and cool year across the Midwest allowed water levels in the Great Lakes to rebound to above-average levels for the first time in 15 years.
- December ended the year on a warm note. The CONUS December temperature was 4.5°F above the 20th century average, the second warmest December on record, behind only 1939. Each state had above-average December temperatures. Nine states across the West, Southern Plains, and Northeast had a top 10 warm December. No state was record warm. The monthly precipitation was near average, with above-average precipitation observed across the West, Central Plains, Southeast, and Northeast. Maine had its seventh wettest December on record. Below-average precipitation was observed across the Southern Plains and Northern Plains. North Dakota had its ninth driest December. No state had its wettest or driest December on record.
This annual report places the temperature and precipitation averages into historical perspective, while summarizing the notable events that occurred in 2014. More detailed analysis on individual months can be found through the Climate Monitoring home page.
Seasonal Analysis
Winter

The winter of 2013/14 was cooler than average for the contiguous U.S. with a temperature of 31.2°F, 1.0°F below the 20th century average, marking the 33rd coolest winter and the coolest since 2009/10. The season consisted of the 29th coolest December, a near-average January, and the 37th coolest February. Over the course of the winter season, numerous cold Arctic-air outbreaks impacted locations from the Rockies eastward. The Midwest bore the brunt of the cold air, with many locations having their coldest winter since the 1970s. Seven states in the Midwest had one of their ten coldest winters in the 119-year record, while no state was record cold. The largest departure from average occurred in Wisconsin, where the state average temperature for the season was 7.3°F below the 20th century average, ranking as the fourth coldest winter for the state. The cold winter contributed to 92.2 percent of the Great Lakes freezing, which is the second largest ice cover for the lakes in the 1973-2014 period of record. Only the winter of 1978/79 had a larger ice cover for the lakes at 94.7 percent. Above-average temperatures were observed in the Southwest. Arizona had its fourth warmest winter on record, while California was record warm. The California average winter temperature was 48.0°F, 4.4°F above the 20th century average, and 0.8°F warmer than the previous record warm winter of 1980/81.
The 3-month average CONUS precipitation of 5.83 inches was 0.97 inch below the 20th century average and the 17th driest on record. This was the driest winter since 2001/02 for the Lower-48. Both December and February had near-average precipitation, while the January precipitation total for the contiguous U.S. was the fifth driest on record. During the winter season, below-average precipitation was observed across the West Coast, through the Southwest, and into the Southern and Central Plains. Arizona, California, and New Mexico had one of the ten driest winters on record. The dry and warm winter across the Southwest and Southern Plains exacerbated long-term drought conditions. By the end of February, statewide reservoirs in Texas averaged 64 percent capacity, their lowest level for the time of the year since 1990. In California, conditions were even direr after the third consecutive winter of below-average precipitation set the stage for drought conditions to engulf the entire state later in the year. The majority of California's annual precipitation comes during the winter season. Above-average precipitation was observed across the northern tier of the country, stretching from the Northern Plains, through the Midwest, and into the Northeast. No state had a top 10 wet winter season. The cool and somewhat wet conditions across the central United States contributed to the 10th largest winter snow cover extent for the winter season and the largest since 2010/11. By the end of the winter season, 35.9 percent of the contiguous U.S. was in drought, up from 31.0 percent at the beginning of the season. During winter, drought conditions improved in parts the Midwest, but worsened in the Southern Plains and West.
Spring

The national spring temperature of 51.1°F was 0.2°F above the 20th century average and ranked near the median value in the 120-year period of record. Each month had near-average temperatures during spring, but some regional extremes were observed. The West continued to be much warmer than average. California had its fifth warmest spring on record. Below-average temperatures persisted in the East, particularly the Upper Midwest and the Lower Mississippi River Valley. The cool conditions in the Great Lakes region allowed ice cover to remain on the lakes much later than the average ice-out date. Ice was observed into June on parts of Lake Superior. Other than California, no state had a spring temperature that ranked among the 10 warmest or coolest on record.
The March-May precipitation total was 8.06 inches, 0.12 inch above average and ranked near the median value. March and May had near-average precipitation for the CONUS, while April was wetter than average. Above-average spring precipitation was observed across the Northwest, Midwest, Northeast, and Southeast. Florida tied its tenth wettest spring, while Washington had its fourth wettest. Below-average precipitation was observed across the Southwest, Central and Southern Plains, and into parts of the Ohio Valley. Kansas had its third driest spring on record. The spring snow cover extent was slightly larger than average. March was particularly wet across the Northwest. Washington's climate division 3 (Puget Sound Lowlands) had its wettest March on record, with 8.82 inches of precipitation, 4.67 inches above average. The record-breaking precipitation contributed to a massive landslide near Oso, Washington that resulted in 43 fatalities. In late April, a strong storm system moving through the central part of the country spawned over 80 tornadoes in the Midwest and Southeast causing 33 fatalities and over $1 billion U.S. dollars in damage; this was the deadliest tornado outbreak of 2014. The storm system also dropped 20.47 inches of precipitation in Pensacola, Florida, shattering the city's 48-hour precipitation record. Despite localized heavy precipitation events, during the spring season, the CONUS drought footprint expanded from 35.9 percent to 37.3. Drought intensified in the West, Southwest, and the Central and Southern Plains. Drought conditions improved across the Midwest.
Summer

The contiguous U.S. summer temperature was 71.7°F, 0.3°F above the 20th century average, ranking near the 120-year median value. This was the coolest summer for the Lower 48 since 2009. June was warmer than average while July and August had near-average temperatures. As with the previous two seasons, summer was generally marked by warm temperatures west of the Rockies and cool temperatures east of the Rockies. The near-average contiguous U.S. temperatures masked these regional extremes. The West Coast was particularly warm, where California, Oregon, and Washington each had a top 10 warm summer. New England was also warmer than average, as was Florida, which had its ninth warmest summer. Below-average temperatures were observed from Great Plains, through the Midwest, and into the Southeast. Summer had a late arrival in the Northeast, where Central Park in New York City didn't reach 90°F until July 2nd, the fourth latest occurrence on record. July was particularly cool in the central U.S. where three states were record (or tied the record) cold — Arkansas, Illinois, and Indiana.
The contiguous U.S. average precipitation during June-August was 9.43 inches, 1.11 inches above the 20th century average. This was the ninth wettest summer on record for the CONUS and the wettest since 2004. June was the fifth wettest on record, and the wettest since 1989. August was the 10th wettest on record and wettest since 1977. July was slightly drier than average. Much of the country was wetter than average during summer, with the largest departures from average across the Northern Plains, Midwest, Northeast, and Southwest. Six states across the northern tier had a top 10 wet summer. Dry conditions were observed in the Southeast, where Georgia had its 10th driest summer on record. In the upper Midwest, Minnesota observed 8.07 inches of precipitation during June, marking the wettest month of any month for the state. The Minnesota June average precipitation is 4.11 inches. The cool and wet summer across the Midwest created ideal corn growing conditions during 2014, boosting crop yields. In the East, Hurricane Arthur made landfall near Beaufort, North Carolina on July 3rd with winds of 100 mph. Arthur brought flooding rains and high storm surge to coastal North Carolina, causing significant erosion. Arthur was the first hurricane to make landfall in the U.S. since Isaac in 2012, the first landfalling Category 2 since Ike in 2008, and the earliest landfalling hurricane on record for North Carolina. During summer, the CONUS drought footprint shrank from 37.3 percent to 32.8 percent. Drought conditions across the Southwest improved greatly where enhanced monsoonal flow and the remnants of several tropical systems from the East Pacific brought beneficial rainfall. Drought also improved across the Central Plains. Despite the beneficial rainfall to the west, drought conditions deteriorated across parts of the Southern Plains during the summer. Drought conditions also continued to intensify across the West, particularly California.
Fall


The autumn average temperature for the Lower 48 was 54.1°F, 0.6°F above the 20th century average and the 40th warmest autumn on record. September and October were both warmer than average, ranking as the 26th and fourth warmest such months on record, respectively. November marked a sharp change in the pattern with cold conditions impacting much of the eastern CONUS. November ranked as the 15th coolest on record and the coolest since 2000. The West and the Northeast were both warmer than average during autumn. California had its warmest autumn on record, in addition to five more states in the West that were top 10 warm. Below-average seasonal temperatures were observed in the Midwest and Southeast. Illinois and Indiana each had one of their 10 coldest autumns. In parts of the northern Upper Midwest, the cool and wet summer, followed by a cool autumn caused corn crops to mature slowly. Despite early-season concerns, most of the region's corn was successfully harvested by the end of the season, with bumper crops reported in most states.
The autumn precipitation total for the CONUS was near average at 7.15 inches, with each month having near-average monthly precipitation. Above-average precipitation was observed across parts of the Northwest, Northern and Southern Rockies, the Midwest, and Southeast. Below-average precipitation was observed across the Northern Plains and the Northeast. No state had seasonal precipitation totals that ranked among the ten wettest or driest. The Southwest was particularly wet early in the autumn due to enhanced monsoonal flow and the remnants of several tropical cyclones entering the region from the East Pacific, while the Northeast was particularly dry early in the season. An early-season snow storm in the Northern Plains dropped heavy snowfall in Wyoming and parts of the Dakotas in September, marking the earliest snowfall on record for several cities. In November, the cool and wet conditions across much of the country were associated with the largest November snow cover extent on record for the CONUS. The cool and wet year across most of the Midwest during 2014, combined with the near-record ice cover in spring, allowed Great Lakes water to rebound to above average levels. This was the first time in nearly 15 years that all five of the Great Lakes had water levels above average. This is in contrast to early 2013 when the lakes had record and near-record low water levels.
For information on December, please see our December 2014 report.
Alaska Annual Summary

The average statewide temperature for Alaska during 2014 was 4.0°F above the 1971-2000 average. This ranked as the warmest year on record for Alaska in a period of record that dates back to 1918. The previous warmest year on record occurred in 1926, and 2014 was 0.2°F warmer. Locally, several towns in western Alaska had their warmest year on record including Nome, Bethel, McGrath, King Salmon, Homer, and Cold Bay. Anchorage had its second warmest year while Barrow had its third warmest year. In Anchorage, the temperature never dropped below 0°F during 2014, marking the first year that has occurred in a 101-year period of record. The year started off warm in Alaska with the seventh warmest winter and eighth spring on record, with temperatures 6.7°F and 3.1°F above average, respectively. Things weren't quite as warm during the summer, but were still warmer than average. June-August ranked as the 16th warmest, with much of the warmth occurring in August, which was the fourth warmest for the state. The summer average temperature was 0.9°F above average. Autumn ranked as the 10th warmest on record, with the year ending on a warm note with the fifth warmest December. The autumn average temperature was 3.6°F above average, while December was 8.1°F warmer than average.
The area-averaged annual precipitation for Alaska was slightly above the 1971-2010 average and ranked as the 52nd wettest on record for the state. The year started off slightly wetter than average with the 27th wettest winter on record with precipitation 21.2 percent above average. Spring was the 29th driest, with precipitation 10.3 percent below average. Summer was the third wettest on record for Alaska with precipitation 31.5 percent above average. Several towns including Juneau, Fairbanks, and Hanes had their wettest summer on record. Autumn was the 29th driest for the state with precipitation 10.4 percent below average. December was also drier than average with a monthly precipitation total 19.2 percent below average.
Very Warm/Cold and Wet/Dry Percentages
One way to assess the magnitude of warm/cold and wet/dry episodes is to compute the percent area of the contiguous United States that was "very warm/very cold" and that was "very wet/very dry". The figures above depict these values for each month in the past 30 years. These percentages are computed based on the climate division data set. Those climate divisions having a monthly average temperature/precipitation in the top ten percent (> 90th percentile) of their historical distribution are considered "very warm/very wet" and those in the bottom ten percent (< 10th percentile) are "very cold/very dry". The "very warm" categories translate to the "much above average" while the "very cold" categories translate to the "much below average" in terms of the NCDC ranking methods. This is similar for the "very wet" and "very dry" categories and the NCDC ranking methods of precipitation totals.
The table below shows the percent area of the nation "very warm" and "very cold" for each month of 2014 as well as the annual averaged values.
| Month | Percent area of CONUS "very warm" | Percent area of CONUS "very cold" |
|---|---|---|
| January | 16.31 | 8.59 |
| February | 11.00 | 14.04 |
| March | 16.11 | 9.52 |
| April | 1.61 | 0.32 |
| May | 5.18 | 0.35 |
| June | 12.60 | 0.00 |
| July | 25.85 | 30.27 |
| August | 8.60 | 4.71 |
| September | 13.88 | 0.00 |
| October | 41.17 | 0.00 |
| November | 5.31 | 36.50 |
| December | 26.05 | 0.00 |
| 2014 | 15.31 | 8.69 |
The table below shows the percent area of the nation "very wet" and "very dry" for each month of 2014 as well as the annual averaged values.
| Month | Percent area of CONUS "very wet" | Percent area of CONUS "very dry" |
|---|---|---|
| January | 0.79 | 26.82 |
| February | 9.07 | 11.90 |
| March | 8.10 | 7.24 |
| April | 13.10 | 5.57 |
| May | 0.75 | 4.35 |
| June | 17.15 | 12.17 |
| July | 7.02 | 6.77 |
| August | 26.09 | 2.30 |
| September | 11.49 | 3.93 |
| October | 8.66 | 7.10 |
| November | 6.00 | 4.15 |
| December | 4.32 | 0.99 |
| 2014 | 9.38 | 7.77 |
Climate Extremes Index

The annual USCEI was 27 percent, which is above the average of 20 percent, and the 19th highest value in the 105-year period of record. When excluding the tropical cyclone component, the USCEI was even higher at 31 percent, the ninth highest value on record. Extremes in warm night time temperatures, 1-day precipitation totals, and days with precipitation were the largest drivers of the above average USCEI. For some regions, the Climate Extremes Index was much above average. The West had its highest regional CEI on record at 63 percent, driven largely by warm nighttime and daytime temperatures and the spatial extent of drought. The Southwest had its fifth highest regional CEI driven by warm nighttime and daytime temperatures, 1-day precipitation totals, and days with precipitation. The Upper Midwest had its sixth largest regional CEI driven by extremes in cold nighttime and daytime temperatures, the spatial extent of wet conditions, 1-day precipitation totals, and days with precipitation.

Regional CEI values for winter 2013/14
For winter (Dec-Feb), the USCEI was 25 percent, above the average of 20 percent, the 25th highest value in the 105-year record. Elements that contributed to the above average USCEI included the spatial extent of cold maximum and minimum temperatures and days with precipitation. The West region had its largest regional CEI on record for the winter season driven largely by warm nighttime and daytime temperatures and the spatial extent of drought.
In the spring (Mar-May), the USCEI was 20 percent, right at average. On the national-scale, the spatial extent of one-day precipitation extremes ranked as the third highest spring value on record at 60 percent above average, behind only 2011 and 2013. On the regional scale, the elements that track the spatial extent of cold daily highs and lows were elevated across the central U.S., one-day precipitation extremes were record and near-record high in much of the eastern CONUS, while the spatial extent of drought was record high in the West.

Regional CEI values for summer 2014
During the summer (Jun-Aug), the USCEI was 20 percent, also right at average. When excluding the tropical cyclone component, the USCEI was still 20 percent. Despite the near-average national USCEI, the West region had its second highest CEI on record mostly due to warm nighttime temperatures and the spatial extent of drought.
For fall (Sep-Nov) the USCEI was 15 percent, below the average of 20 percent, ranking as the 33rd smallest autumn USCEI on record. When excluding the tropical cyclone component, the USCEI was closer to average at 18 percent. The component that examines extremes in warm nighttime temperatures was above average and ranked as the 11th highest value on record. On the regional scale, the West had its sixth highest CEI on record, driven largely by warm daytime and nighttime temperatures and the spatial extent of drought.
Monthly National Snow and Ice Report
The 2013/14 winter season (December 2013–February 2014) was cooler and drier than average for the contiguous United States and ranked as the 33rd coldest and 17th driest winter on record. For the December-February period, below-average temperatures were observed in the eastern U.S., with much-below average temperatures in the Midwest. The West, especially the Southwest, was warmer than average. California had its warmest winter on record. Much of the northern U.S., stretching from the Northern Rockies, through the Upper Midwest, Ohio Valley, and into the Northeast was wetter than average. Below-average precipitation was observed from the West, through the Southwest, and into the Central and Southern Plains. Arizona, California, and New Mexico each had a top 10 dry winter season. Several winter storms in the East during the season contributed to the cool and wet season, while the lack of precipitation and the warm temperatures in the West contributed to the much below-average snow pack in mountain locations, exacerbating long-term drought conditions.

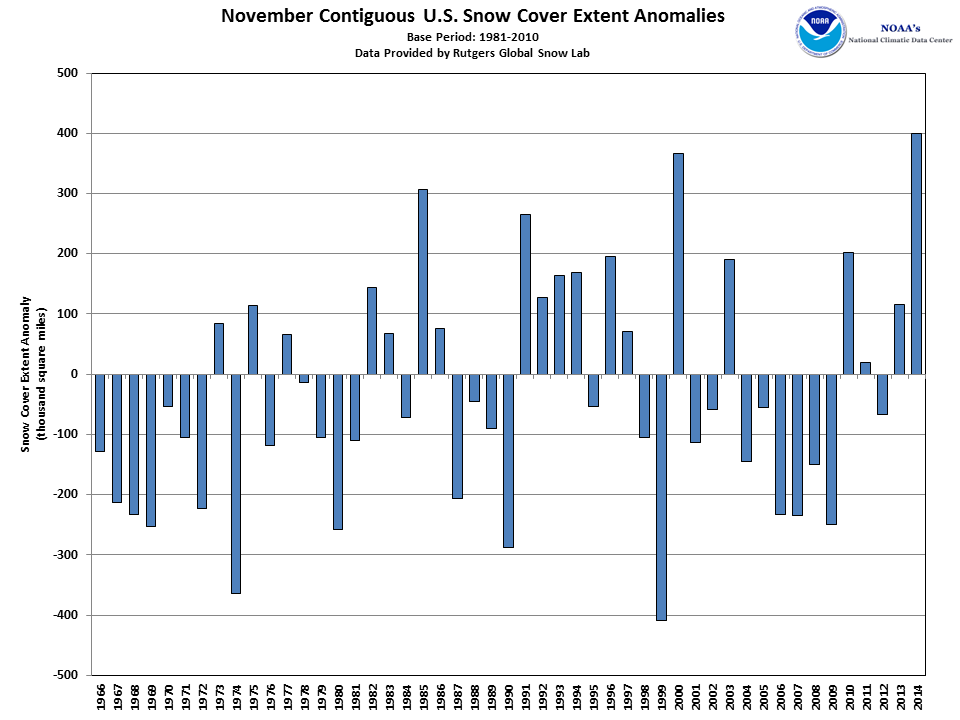
According to the Rutgers Global Snow Lab, for the winter season (December 2013–February 2014), the snow cover extent (SCE) for the contiguous U.S. was 1.42 million square miles, which was 170,000 square miles above the 1981-2010 average. This marked the 10th largest seasonal SCE in the 1966-present period of record, and the largest since the winter of 2010/11. The above-average seasonal SCE consisted of the eighth largest December SCE, 16th smallest January SCE, and ninth largest February SCE. For the spring season (March–May), the contiguous U.S. snow cover extent was 28,000 square miles above the 1981-2010 average, ranking as the 21st largest (28th smallest) spring snow cover extent on record. Each of the spring months had near-average SCE. Later in the year, in November, much cooler than average conditions across the eastern two-thirds of the nation were associated with a record large snow cover extent for the month. The monthly snow cover extent across the lower-48 during November was 876,000 square miles, 400,000 square miles above the 1981-2010 average. Conversely, Alaska was much warmer than average, resulting in the 5th smallest November snow cover extent.

Winter and spring mountain snowpack provide a crucial water source across much of the western United States. The total annual water budget for agriculture and human use in the mountainous West is highly dependent on the amount of snow melt that will occur in spring and is proportional to the amount of snow on the ground. The annual snowpack typically reaches its maximum value at the end of March. According to data from the USDA, on April 1st, above-average snow pack was observed across the Northern and Central Rockies. Some locations across Montana, Wyoming, and Colorado had snow pack totals greater than 180 percent of average. Near-average snow pack was observed in the northern Cascades and parts of the Great Basin. Below-average snow pack was observed across the Southern Cascades, the Sierra Nevada Mountains, and into the Southern Rockies. Many locations across these regions had snowpack totals less than 25 percent of average. In Alaska, near-average snow pack was observed across central parts of the state with below-average snowpack in southern areas.
Monthly Tropical Cyclones Report
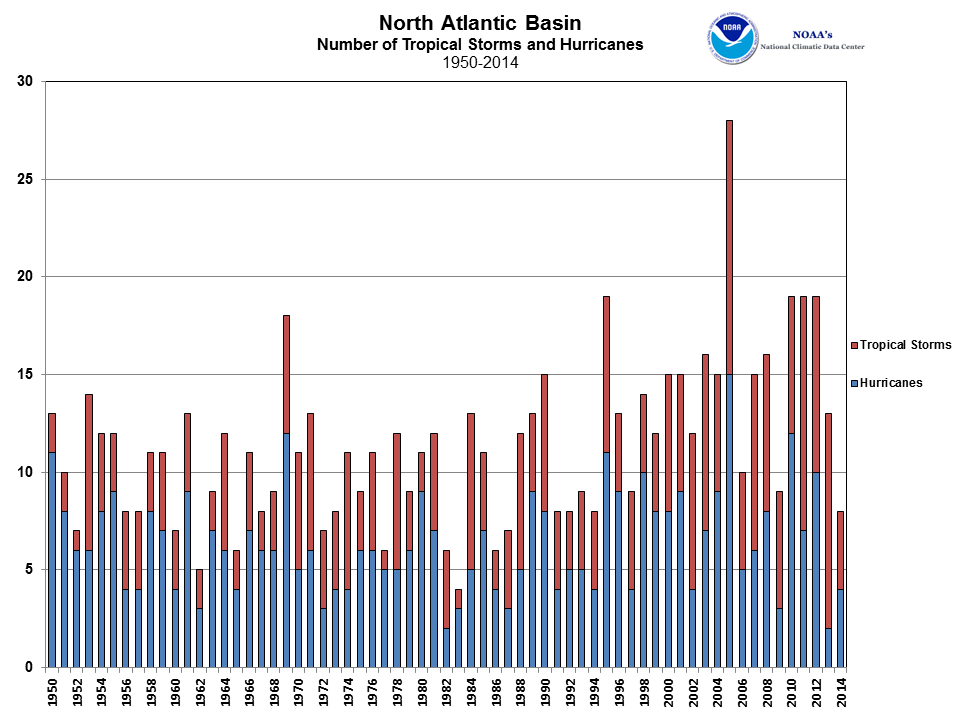

The 2014 North Atlantic hurricane season had eight tropical storms, four hurricanes, and two major hurricanes. The number of tropical storms was below the 1981-2010 average of 12.1, the number of hurricanes was below the 1981-2010 average of 6.4, and the number of major hurricanes was near the 1981-2010 average of 2.7. In terms of the total number of named storms, this was the least since 1994 when eight named storms were observed. One hurricane, Arthur, made landfall in the U.S. during the 2014 season, marking the first landfalling hurricane in the contiguous U.S. since Isaac in August 2012. No other tropical cyclones directly impacted the contiguous U.S. during 2014. The first major hurricane of the season was Edouard, which never made landfall. Edouard had maximum sustained winds of 115 mph and a central minimum pressure of 955 mb. Edouard was the first major hurricane in the North Atlantic basin since Hurricane Sandy in 2012. Gonzalo was the second major hurricane in the North Atlantic during 2014 and had maximum sustained winds of 145 mph and a central minimum pressure of 940 mb. This was the first Category 4 hurricane in the North Atlantic since Ophelia in 2011 and the strongest since Igor in 2010. Gonzalo caused significant damage as it passed over Bermuda.
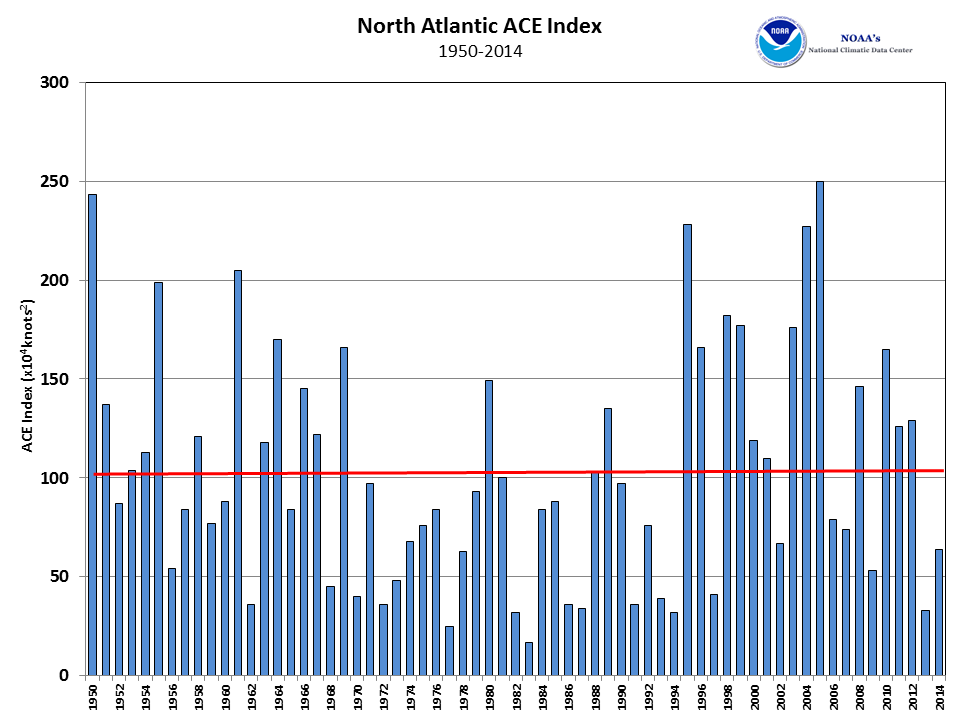
The Accumulated Cyclone Energy (ACE) index of tropical cyclone activity also indicated a below-average season in the North Atlantic. The ACE index is used to calculate the intensity of the hurricane season and is a function of the wind speed and duration of each tropical cyclone. The 2014 Atlantic hurricane season had an approximate ACE of 64 (x104 knots2) which was below the 1981-2010 average value of 104 (x104 knots2). Despite the below-average number of named storms, the ACE was higher than last year (2013), which had more storms, because of the two major hurricanes that occurred in 2014.
Additional tropical cyclone summaries are available through NOAA's National Hurricane Center.
East Pacific Basin
2014 Season Summary:


The 2014 East Pacific Hurricane Season had 22 named storms, of which 16 were hurricanes, and of these nine were major hurricanes. The 1981-2010 average number of named storms in the East Pacific is 16.5, with 8.9 hurricanes, and 4.3 major hurricanes. The number of named storms was the highest since 1992 and the third highest since reliable records began. The number of hurricanes tied with 1990 and 1992 as the most on record for the basin. Several of the storms impacted Mexico and the Hawaiian Islands causing significant damage and over 40 fatalities. Several remnant low pressures from the active East Pacific tropical cyclone season brought heavy rain into the Southwest and Southern Plains regions of the United States, causing record flooding and bringing some drought relief. The ACE index for the season was 150 (x104 knots2), which is above the 1981-2010 average of 132 (x104 knots2) and the most since 2006. Several noteworthy storms occurred including Hurricane Amanda in May which had maximum sustained winds of 155 mph and a central minimum pressure of 932mb — the strongest May hurricane on record for the basin. Hurricane Iselle, which formed in the East Pacific basin and moved into the central Pacific made landfall on the Big Island of Hawaii as a tropical storm, marking the first landfall of a tropical cyclone in Hawaii since Hurricane Iniki in 1992 and only the second tropical cyclone to make landfall on the Big Island.
Monthly Tornadoes Report

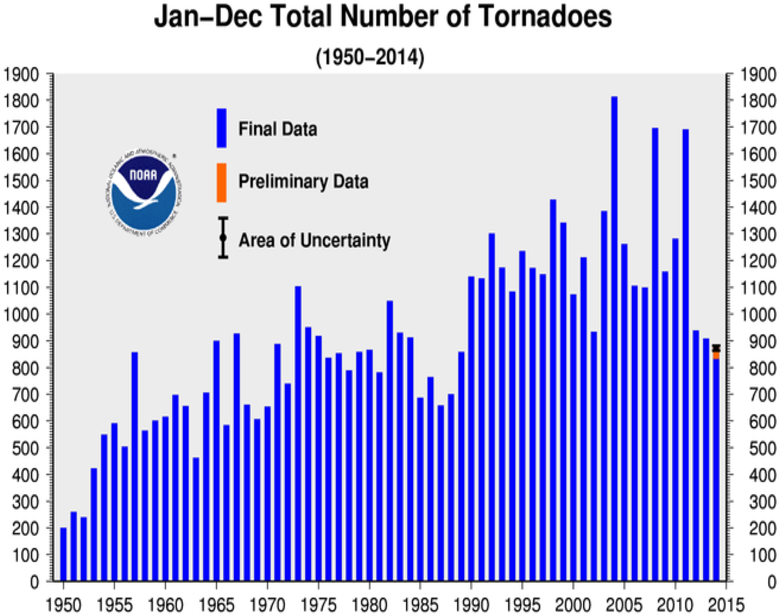
2014 Tornado Occurrences
Source: SPC
Similar to the past two years, tornado activity across the U.S. during 2014 was below average. During 2014, there were 831 confirmed tornadoes during the January-October period with 50 tornado reports still pending for November-December. This gives 2014 a preliminary tornado count of 881. The 1991-2010 annual average number of tornadoes for the U.S. is 1,253. Depending on the final confirmation rate this could be the slowest tornado year since 1988 when there were 702 confirmed tornadoes. 2014 marks the third consecutive year with less than 1,000 tornadoes impacting the United States. This hasn't occurred since 1987-1989, which was before the deployment of NEXRAD (coincident with the deployment of NEXRAD, the number of weak tornadoes observed annually increased due to better detection). As with most years, there were several large and destructive tornado outbreaks during 2014. There were 47 tornado-related fatalities, most of which occurred in April. There were at least five severe weather outbreaks that caused damages exceeding one billion U.S. dollars.
Most months of 2014 had a below-average number of tornadoes. April had a near-average number of confirmed tornadoes, 128, with a multi-day tornado outbreak late in the month associated with most of the tornadoes. April was also the deadliest month in terms of tornado-related fatalities, 35. An above-average number of tornadoes was reported during June,284, the most active tornado month of the year. June was also the most active tornado month for any month since May 2011 when 326 tornadoes were confirmed. Two tornado-related fatalities were reported in June. The rest of the year had below-average tornado activity, but four tornado-related fatalities were reported in July, one was reported in October, and five occurred in December. The 47 tornado-related fatalities was the lowest number since 2009, when there were 22.
NOAA works closely with the academic and science communities on climate-related research projects to increase the understanding of El Niño and improve forecasting techniques. NOAA's Climate Prediction Center monitors, analyzes and predicts climate events ranging from weeks to seasons for the nation. NOAA also operates the network of data buoys and satellites that provide vital information about the ocean waters, and initiates research projects to improve future climate forecasts.