National Overview:
- Climate Highlights — August
- The average U.S. temperature in August was 75.7 degrees F (24.3 degrees C), which is 3.0 degrees F (1.6 degrees C) above the long-term (1901-2000) average, resulting in the second warmest August on record. Precipitation averaged across the nation was 2.31 inches (58.7 mm). This was 0.29 inch (7.3 mm) below the long-term average, with large variability between regions.
- The excessive heat which dominated climate regions also had their warmest August on record.
- During August, nine of the Lower 48 States experienced August temperatures which were near-average, and no state had an average August temperature which was below-average.
- Precipitation during August was Drier-than-normal conditions reigned across the Interior West, the Midwest, and the South.
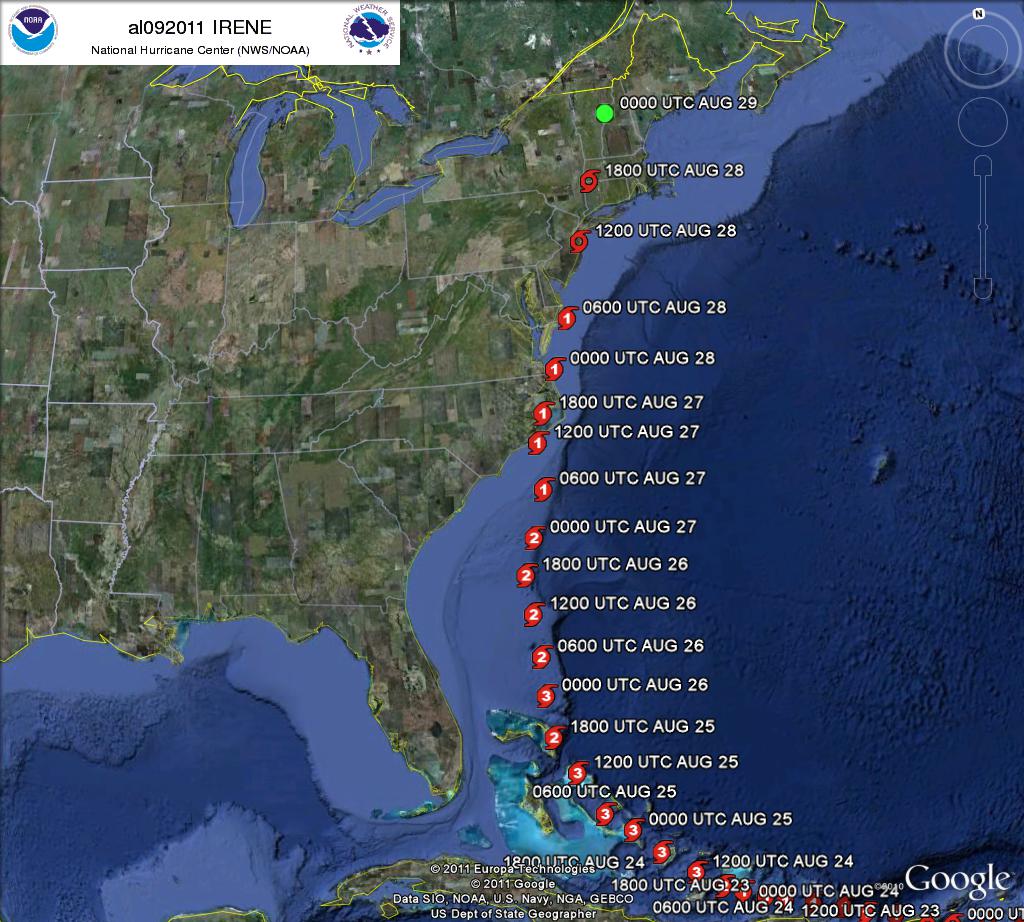
- Hurricane Irene made landfall near Cape Lookout, North Carolina as a Category 1 hurricane on August 27th, marking the first hurricane landfall in the U.S. since Hurricane Ike in September 2008. Irene made a second landfall in New Jersey as a hurricane on August 28th, marking only the second recorded hurricane landfall in that state. Irene made yet another landfall as a tropical storm along Long Island, New York later that same day.
- Irene brought torrential rainfall and flooding to the Eastern Seaboard between August 27th and 29th, contributing to New Jersey, New York, Vermont, and New Hampshire having their wettest August on record. Meanwhile, Massachusetts (2nd wettest), Connecticut (2nd), Delaware (3rd), Maine (3rd), Maryland (5th), Pennsylvania (5th), and Rhode Island (9th) had a top ten wet August.
- Several major U.S. cities broke all-time monthly rainfall amounts during August. New York City (Central Park) measured 18.95 inches (430.5 mm) of rain during August, besting the previous record of 16.85 inches (428.0 mm) in 1882. In Philadelphia, 19.31 inches (490.5 mm) of rain was observed, besting the previous monthly record of 13.07 inches (332.0 mm) in September 1999.
- In stark contrast to the Northeast, several states were notably drier than average during August. Louisiana (3rd driest), Tennessee (4th), Texas (5th), Mississippi (6th), Georgia, (6th), Illinois (8th), Washington (9th), and Alabama (9th) had precipitation totals among their top ten driest Augusts on record.
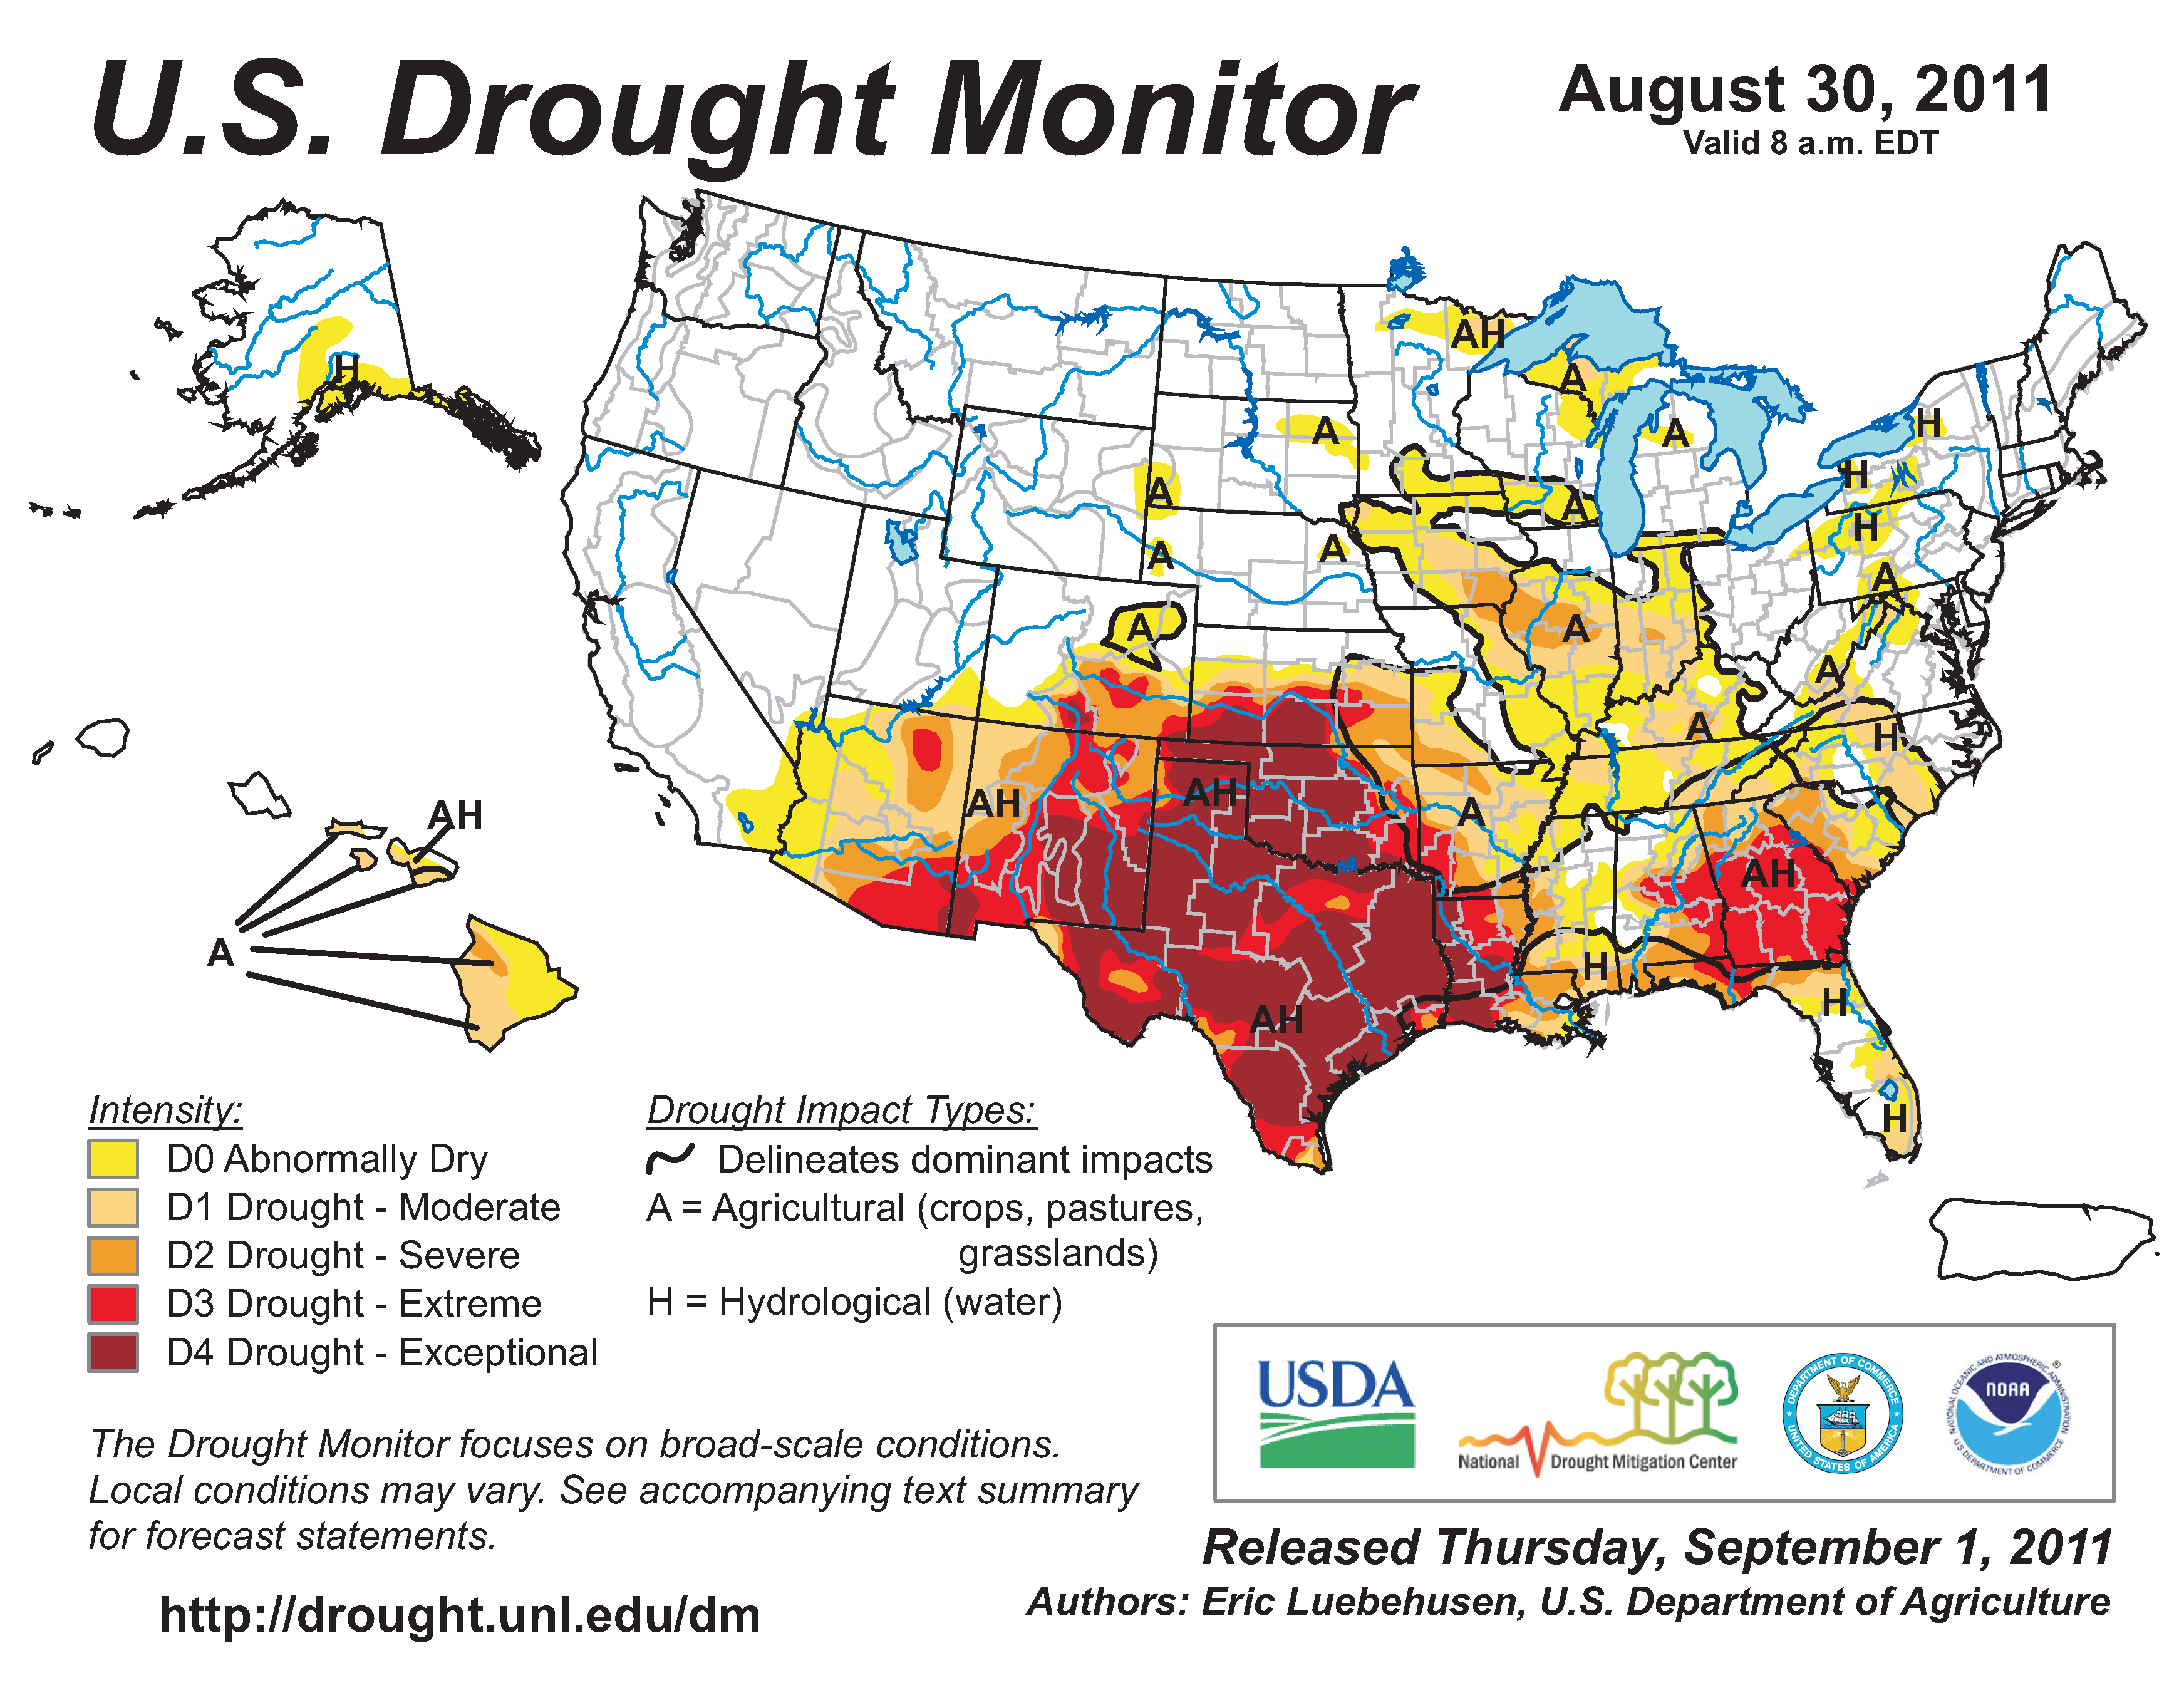
- At month’s end, drought covered about one-third of the contiguous United States, according to the U.S. Drought Monitor. Eleven percent of the U.S. and 81 percent of Texas were in the worst category (D4, 'Exceptional' Drought). The Palmer Hydrologic Drought Index, one measure of drought severity, indicated that parts of Louisiana, New Mexico, Oklahoma, and Texas are experiencing drought of greater intensity, but not yet duration, than those of the 1930s and 1950s.
- An analysis of Texas statewide tree-ring records dating back to 1550 indicates that the summer 2011 drought in Texas is matched by only one summer (1789) in the 429-year tree-ring record, indicating that the summer 2011 drought appears to be unusual even in the context of the multi-century tree-ring record.
- Climate Highlights — Summer
- The average U.S. temperature during the summer of 2011 was 74.5 degrees F (23.6 degrees C) — 2.4 degrees F (1.3 degrees C) above the long-term (1901-2000) average and the second warmest summer on record. Precipitation averaged across the nation was 7.25 inches (184.2 mm). This was 1.0 inch (25.4 mm) below the long-term average.
- The unprecedented heat during the summer period (June-August) of 2011 across Texas, Oklahoma, New Mexico, and Louisiana resulted in these states having their warmest summers on record. Average temperatures for the summer in Texas and Oklahoma, at 86.8 degrees F (30.4 degrees C) and 86.5 degrees F (30.3 degrees C), respectively, exceeded the previous seasonal statewide average temperature record for any state during any season. The previous warmest summer statewide average temperature was in Oklahoma, during 1934, at 85.2 degrees F (29.6 degrees C).
- During the summer, a persistent ridge of high pressure bestrode the eastern U.S., causing warmer than average temperatures east of the Rockies. Oregon were the only states across the lower 48 to have below-average summer temperatures.
- Texas had its driest summer on record, with a statewide average of 2.44 inches (62.0 mm) of rain accumulating. This is 5.29 inches (134.4 mm) below the long-term average, and 1.04 inches (26.4 mm) less than the previous driest summer in 1956. New Mexico had its second driest summer and Oklahoma had its third driest summer. New Jersey and California had their wettest summers on record with 22.50 inches (571.5 mm ) and 1.93 inches (49.0 mm), respectively. The summer statewide average precipitation for for New Jersey is 12.8 inches (325.1 mm) and 0.66 inch for California (16.8 mm).
- The U.S. Climate Extremes Index, which is sensitive to climate extremes in temperature, rainfall, dry streaks, drought, and tropical cyclones, indicated that an area nearly four times the average value was affected by extreme climate conditions during summer 2011. This is the third largest summer value of the record, which dates to 1910. The major drivers were extremes in warm minimum and maximum temperatures and both the wet and dry tails of the Palmer Drought Severity Index.
- Based on NOAA's Residential Energy Demand Temperature Index, the contiguous U.S. temperature-related energy demand was 22.3 percent above average during summer. This is the largest such value during the Index’s period of record, which dates to 1895.
- During the summer of 2011, all states across the contiguous U.S., with the exception of North Dakota and Vermont, experienced at least one day with a location having a daily maximum temperature exceeding 100 degrees F (37.8 degrees C). A large swath of the Southern Plains and Southwest had over 30 days with a daily maximum temperature of 100 degrees F (37.8 degrees C) or warmer.
- A list of select August/summer temperature and precipitation records can be found here.
- Climate Highlights — 6 month and Year-to-Date Period
- During the six month period (March-August), Northwest.
- For the year-to-date period, the average statewide temperature for Texas was 69.9 degrees F (21.1 degrees C), the warmest such period on record for the state. This bests the previous record for the year-to-date period of 69.8 degrees F (21.0 degrees C) in 2000.
- During 2011 to-date, Pennsylvania were record wet during the same period.


Alaska Temperature and Precipitation:
-
 Alaska
had its 32nd coolest August on record, with a temperature 1.4°F (0.8°C) below the 1971–2000 average.
Alaska
had its 32nd coolest August on record, with a temperature 1.4°F (0.8°C) below the 1971–2000 average.
-
 Alaska
had its 39th coolest June-August on record, with a temperature 0.7°F (0.4°C) below the 1971–2000 average.
Alaska
had its 39th coolest June-August on record, with a temperature 0.7°F (0.4°C) below the 1971–2000 average.
-
 Alaska
had its 42nd warmest year-to-date period on record, with a temperature near the 1971–2000 average.
Alaska
had its 42nd warmest year-to-date period on record, with a temperature near the 1971–2000 average.
-
 Alaska
had its 9th wettest August since records began in 1918, with an anomaly that was 39.1 percent above the 1971–2000 average.
Alaska
had its 9th wettest August since records began in 1918, with an anomaly that was 39.1 percent above the 1971–2000 average.
-
 Alaska
had its 19th wettest June-August on record, with an anomaly that was 15.8 percent above the 1971–2000 average.
Alaska
had its 19th wettest June-August on record, with an anomaly that was 15.8 percent above the 1971–2000 average.
-
 Alaska
had its 41st driest year-to-date period on record, with an anomaly that was 2.6 percent above the 1971–2000 average.
Alaska
had its 41st driest year-to-date period on record, with an anomaly that was 2.6 percent above the 1971–2000 average.
For additional details about recent temperatures and precipitation across the U.S., see the Regional Highlights section below. For information on local temperature and precipitation records during the month, please visit NCDC's Records page. For details and graphics on weather events across the U.S. and the globe please visit NCDC's Global Hazards page.
Regional Highlights:
These regional summaries were provided by the six Regional Climate Centers and reflect conditions in their respective regions. These six regions differ spatially from the nine climatic regions of the National Climatic Data Center.
- Northeast Region: (Information provided by the Northeast Regional Climate Center)
- August temperatures averaged warmer than normal for the eighth consecutive month. The Northeast’s average was 69.1 degrees F (20.6 degrees C), which was 0.7 degrees F (0.4 degrees C) above normal. Departures among the twelve states in the region ranged from +0.4 degrees F (0.2 degrees C) in Connecticut, Maryland, Pennsylvania and West Virginia to +2.0 degrees F (1.1 degrees C) in Vermont. The summer (June-August) of 2011 also averaged above normal, in fact it was the 11th warmest summer since 1895. State departures ranged from +0.7 degrees F (0.4 degrees C) in Connecticut to +2.5 degrees F (1.4 degrees C) in Delaware. Four states placed in the top 8 warmest in 117 years: Delaware, 2nd; New Jersey, 3rd; Maryland, 4th; and Rhode Island, 8th. It is interesting to note that the summer of 2010 was the warmest since 1895 for these four states.
- Rainfall totals were above normal in most of the Northeast, even before Tropical Storm Irene’s drenching at the end of the month. The region averaged 7.34 inches (186 mm), which was 189 percent of the normal amount. It was the 2nd wettest August in the Northeast in 117 years, surpassed only by August 1955. Four states, New Hampshire, New Jersey, New York, and Vermont, saw their wettest August since 1895. It was the 2nd wettest in Connecticut and Massachusetts, the 3rd wettest in Maine and the 5th wettest in Pennsylvania. State departures ranged from 353 percent in New Jersey to 93 percent in West Virginia, the only state to average below normal this month. With all the rain during August, drought concerns were limited to two small areas of moderate drought (D1) along the eastern West Virginia border.
- Hurricane Irene, the first category one hurricane to make landfall in New Jersey in over 100 years, left its mark on the Northeast. It passed just north of Atlantic City, NJ early on the 28th, then weakened to a tropical storm as it approached the New York City metro area around 8 AM. By 8 PM on the 28th, Irene was an extra tropical cyclone over southern Caledonia County, VT. In anticipation of the storm’s potential, flights were cancelled, the New York City mass-transit system was shut down, and millions of coastal residents faced mandatory evacuations. As the storm wound down, the impacts to the coastal areas were not as severe as expected, with only a few locations sustaining serious wind damage or beach erosion. Inland areas were not so lucky. Irene dumped 6 to 8 inches (152 to 203 mm) of rain over eastern Maryland, Delaware, southeastern Pennsylvania, New Jersey, eastern New York, western Connecticut, western Massachusetts and southern Vermont. A few locations in Maryland, New Jersey, New York and Connecticut saw over 8 inches (203 mm) of rain during this event. These same areas had already tallied 6 to 8 inches (152 to 203 mm) of rain from August 1-26 and the saturated soils could not absorb any more moisture. The resultant flash flooding washed out roads, bridges, undermined railroads, brought down trees and power lines and flooded homes and businesses. Southern Vermont was hit very hard by the flooding. At least 263 roads, including 30 bridges, were destroyed. A few towns were completely cut off and supplies had to be brought in by helicopter or all-terrain vehicles. In New York, flash floods ravaged towns in the Catskills, washed out roads in the Adirondacks, and closed sections of I-88, the New York Thruway and the Erie Canal. Floodwaters encompassed the Passaic and Raritan River basins in New Jersey, displacing thousands as roads became rivers and homes and businesses filled with water. Irene took the lives of at least 23 in the Northeast, either from being washed away in floodwaters, electrocution, or due to trees falling on vehicles or houses. During the days following the storm, federal officials, including the President, toured the most ravaged areas. Eleven of the Northeast states and the District of Columbia were declared federal disaster areas, making them eligible for federal funds. The economic cost of the storm was estimated to be at least $7 billion nationwide.
- For more information, please go to the Northeast Regional Climate Center Home Page.
- Midwest Region: (Information provided by the Midwest Regional Climate Center)
- August precipitation varied considerably across the Midwest. The wettest area extended from southwest Iowa to south central Missouri where they picked up 150% to 200% of normal for the month. The Cleveland, Ohio area picked up 150% of normal and parts of northern Minnesota and northwest Wisconsin also approached 150% of normal. The driest stretch extended across Illinois, roughly from Hancock County to Lawrence County, receiving less than 25% of normal for the month. A small part of southern Minnesota also received less than 25% of normal and all states except Ohio had pockets with less than 50% of normal. Summer rainfall, June to August, also varied across the region but to a lesser extent. Most locations received between 75% and 125% of normal.
- August temperatures in the Midwest were near normal to slightly above normal. The warmest area was in southwest Missouri where temperatures were as much as 5°F (3°C) above normal. Eight stations in Missouri set or tied their all-time highest temperature in August. Temperatures for the summer months, June to August, averaged slightly warmer. Most of the Midwest was 1°F to 4°F (1°C to 2°C) above normal with southwest Missouri again the warmest with temperatures 4°F to 6°F (2°C to 3°C) above normal.
- Flooding along the Missouri River persisted through the summer. Highway and rail travel were greatly impacted as all bridges crossing the Missouri for more than 100 miles (160 km) were closed at one time. Both freight and passenger rail were rerouted for many weeks incurring significant delays. Highways in Missouri and Iowa, including I-29 and I-680, were closed and severely damaged by the extended inundation. Farm land and towns near the river were also flooded, in some places for months. As the water levels drop, severe damage has been revealed in many fields from either the deposition of thick sand covering the top soil or from scouring and erosion.
- Weather played a part in thirteen deaths across the Midwest in August. Five people died on the 13th when a stage fell at the Indiana State Fair (Marion County) just before a concert was to begin. As severe thunderstorms rapidly moved into the fairgrounds, winds picked up in excess of 60 miles per hour (100 km/hr) collapsing the covered stage. Two additional deaths occurred among the 45 injured in the days following the event. Another Indiana death occurred on the 9th when a tree was blown down onto a vehicle. A tornado in Marinette County, Wisconsin killed one on the 19th. Another Wisconsin man died in Clark County on the 23rd due to a power outage caused by severe storms in the area. On the 9th and 10th strong winds caused rip currents on Lake Michigan. Three people drowned in the currents in two separate incidents along the Michigan and Indiana coasts.
- Crops stress became much more widespread in August with the dry conditions of the month following a hot, and in many locations dry, July. Due to the weather and following disappointing field surveys in many locations, crop yield estimates were lowered well below the 5-year averages. Yields are also expected to vary considerably from field to field and even within fields. Drought affected areas in the Midwest expanded from less than 1% on July 26th to more than 18% on August 30th. Severe Drought area went from 0% to nearly 5% of the Midwest in the same time period.
- For details on the weather and climate events of the Midwest, see the weekly summaries in the MRCC Midwest Climate Watch page.
- Southeast Region: (Information provided by the Southeast Regional Climate Center)
- Mean temperatures in August ranged from 1-2 degrees F (0.5-1.1 degrees C) above normal across the northern tier of the region to 3-4 degrees F (1.6-2.2 degrees C) above normal across most of the southern tier. Several locations in the Southeast experienced their warmest August on record, including Gainesville, FL, Tallahassee, FL, Tampa, FL, Columbus, GA, and Savannah, GA. On the 4th of the month, Charleston, SC set an all-time record high minimum temperature of 83 degrees F (28.3 degrees C), while Columbia, SC tied its all-time record high minimum temperature of 82 degrees F (27.8 degrees C) last set in 1936. For the second consecutive year, the end of August marked one of the warmest meteorological summers (June-August) on record at several locations across the Southeast. Locations that experienced their warmest summer on record in 2011 included Tallahassee, FL, Augusta, GA, Athens, GA, Columbus, GA, Savannah, GA, Charleston, SC, Columbia, SC, and Cape Hatteras, NC.
- Precipitation in August was generally below normal across the Southeast, except in areas affected by tropical cyclones. Tropical Storm Emily dropped 6-10 inches (152.4-254.0 mm) of rain across Puerto Rico on the 3rd and 4th of the month, resulting in major flooding and several landslides. Towards the end of the month, Hurricane Irene dropped as much as 22 inches (558.5 mm) of rain along the eastern slopes of the island. For the month, San Juan, PR recorded 18.56 inches (471.4 mm) of rain, which set a new all-time monthly record. Hurricane Irene also dropped between 8-15 inches (203.2-381.0 mm) of rain across eastern sections of North Carolina and Virginia on the 27th and 28th of the month. The driest locations across the Southeast (less than 50 percent) were found across most of Georgia, eastern Alabama, and the Florida Panhandle. Tallahassee, FL recorded 2.03 inches (51.6 mm) of rain for the month, making it both the driest August as well as the driest meteorological summer in a record extending back to 1892. San Juan, PR, recorded 43.24 inches (1098.29 mm) of rain from June through August, making it the wettest summer in a record extending back to 1902.
- Hurricane Irene made landfall near Cape Lookout, NC on the morning of the 27th. She was the first hurricane to make landfall in the Southeast since Hurricane Dennis in 2005. The combination of heavy rain and high wind resulted in numerous downed trees, power lines, and extensive property damage across eastern sections of North Carolina and Virginia. Several communities in the Richmond, VA area were still without power 10 days after the storm. Large sections of North Carolina Highway 12 were severely damaged, cutting off access to several villages and beaches along the Outer Banks. Prior to making landfall in North Carolina, Irene pounded Puerto Rico with heavy rain and hurricane-force winds. Over 1 million residents lost power on the island. One person drowned as they attempted to drive their car through the flood waters. Heavy surf along the Southeast coast claimed the lives of two men who drowned offshore near Daytona Beach, FL. A total of 13 deaths from Irene have been confirmed across the Southeast, most resulting from falling trees. The agricultural impacts from Irene were significant across eastern North Carolina. The tobacco crop in particular was severely damaged. Preliminary figures suggest that the economic impact of Irene on agriculture in North Carolina may exceed $400 million. The severe flooding from Irene also destroyed much of the banana crop in Puerto Rico.
- There were 727 reports of severe weather across the Southeast in August, including five confirmed tornadoes. A weak tornado caused some structural damage and downed several trees in Broward County, FL on the 2nd of the month. Another weak tornado destroyed a turkey house and damaged several mobile homes in Wilson County, NC on the 6th of the month. Hurricane Irene spawned multiple tornadoes across eastern sections of North Carolina and Virginia. Several mobile homes were destroyed by an EF-2 tornado in Tyrell County, NC. In Washington County, NC, an EF-1 tornado damaged a hardware store and grain silo, while in Beaufort County an EF-1 tornado snapped pine trees and blew out the concrete walls of a car dealership. On the 17th of the month, eight people were injured when lightning struck SeaWorld’s Discovery Cove in Orlando, FL
- While Hurricane Irene helped eliminate the regions of severe and extreme drought (D2 and D3) across eastern North Carolina, there were few other changes in the Drought Monitor across the Southeast in August. The continued dryness across much of Georgia contributed to several wildfires. According to the Georgia State Climate Office, more than 2,230 acres burned across the state in August, which was double the long-term average for the month.
- For more information, please go to the Southeast Regional Climate Center Home Page.
- High Plains Region: (Information provided by the High Plains Regional Climate Center)
- August 2011 temperatures were generally near normal for the majority of Nebraska and the Dakotas. However, a large area of Colorado and Kansas had temperature departures ranging from 4-8 degrees F (2.2-4.4 degrees C) above normal. By the end of the month, several locations were ranked in the top 5 warmest Augusts on record. With an average temperature of 74.1 degrees F (23.4 degrees C), Colorado Springs, Colorado had its warmest August on record (period of record 1894-2011). The old record of 72.6 degrees F (22.6 degrees C) occurred in 2007. The warmer than normal August temperatures allowed many locations in Colorado and Kansas to break summer (June, July, and August) temperature records as well. Dodge City, Kansas broke multiple records by having its warmest and driest summer on record (period of record 1874-2011). With an average temperature of 83.5 degrees F (28.6 degrees C) Dodge City was able to break the previous record of 83.4 degrees F (28.6 degrees C) set during the Dust Bowl in 1934. Dodge City also had 50 days at or above 100 degrees F (37.8 degrees C) this summer which crushed the old record of 42 days also set in 1934. The ongoing hot and dry conditions across southern Kansas and Colorado have stressed crops and livestock. According to the National Agricultural Statistics Service livestock liquidations took place throughout the month in order to reduce stress on pastures and water supplies.
- Dryness prevailed across southern Kansas, eastern Colorado, central Wyoming, eastern South Dakota, and northern North Dakota. Extreme (D3) to exceptional (D4) drought conditions persisted across much of southern Colorado and southern Kansas. While some areas of the extreme drought conditions in Colorado were downgraded, relief was not in store for southern Kansas as the area received lower than normal precipitation. Dodge City, Kansas had its 6th driest August on record and only received 0.65 inches (17 mm) of precipitation, which was 24 percent of normal (period of record 1874-2011). The driest August on record occurred in 1894 with 0.15 inches (4 mm) of precipitation. Dodge City also recorded its driest summer on record with 1.58 inches (40 mm) of precipitation. Interestingly, the year-to-date (January 1 August 31) precipitation of 4.60 inches (117 mm) was also the lowest on record.
- While drought conditions occurred in the southern-most portions of the Region, a large section stretching from northern Kansas up through central North Dakota experienced many storms and was wetter than normal. Severe storms occurred nearly every day within the Region. On August 9th, large hail and high winds were reported across Wyoming, Colorado, Nebraska, and Kansas. The largest hail fell in north central Kansas in the town of Zurich, where 4.25 inch hail was reported. According to the North Platte National Weather Service Office, hail was up to a foot deep in locations of Arthur, Nebraska and plows were called in to clear the roads near Lake McConaughy. On August 11th, several tornadoes were reported in north central Nebraska causing numerous trees to be damaged or uprooted and a few power poles to be broken. High winds, up to 80 mph (129 km/hr), were reported in South Dakota that day as well. The high winds damaged buildings, blew over grain bins, downed trees and power lines, and even blew trucks off the road. On August 12th, large hail and high winds were reported in central Kansas. The 60-80 mph (97-129 km/hr) winds damaged trees, snapped power poles, and caused minor structural damage. A damaging wind and hail event occurred in eastern Nebraska on the 18th. In addition to damaging cars, the large hail damaged aircraft at Omaha’s Eppley Airfield and caused numerous delays and cancellations. In addition, a 92 mph (148 km/hr) wind gust was measured at the airport. Heavy rain accompanied many of the storms and areas that had precipitation totals which were at or above 150 percent of normal included southern North Dakota, central South Dakota, west-central Wyoming, northern Kansas, and pockets of eastern, northern, and southwestern Nebraska. Lincoln, Nebraska had its 7th wettest August on record with 6.89 inches (175 mm) of precipitation, which was 206 percent of normal (period of record 1887-2011). This amount was no where near the record 13.89 inches (353 mm) that was set in August 1910; however one daily rainfall record was broken. Early morning thunderstorms on the 30th brought 2.62 inches (67 mm) of rain which broke the old record of 2.23 inches (57 mm) set in 1977.
- Several changes occurred to the U.S. Drought Monitor this month. Crop stress in eastern South Dakota and Nebraska led to an introduction of mainly abnormally dry conditions (D0). However, a small area of moderate drought (D1) developed in far southeastern South Dakota. By mid month, D0 was also present in the Black Hills area of South Dakota, a small portion of eastern Wyoming, and far northwestern Nebraska. Scattered showers across eastern Colorado allowed for a one-category improvement for a good portion of the extreme drought conditions (D3). Meanwhile, D3 and D4 (exceptional drought conditions) expanded in western Kansas as hot and dry conditions persisted. According to the U.S. Seasonal Drought Outlook released August 18th drought conditions in Kansas and eastern Colorado were expected to improve somewhat. The drought conditions in central Colorado were expected to persist, while just to the west, drought conditions were expected to develop.
- For more information, please go to the High Plains Regional Climate Center Home Page.
- Southern Region: (Information provided by the Southern Regional Climate Center)
- As was the case in both June and July, August was again a very warm month for the Southern Region. The region as a whole averaged a temperature of 86.00 degrees F (30.00 degrees C). This is the warmest August on record (1895-2011) for the Southern Region. The majority of stations in the region averaged between 2 to 6 degrees F (1.11 to 3.33 degrees C) above normal. The highest temperature anomalies occurred in central and northern Texas, and throughout most of Oklahoma. Stations there averaged between 6 to 10 degrees F (3.33 to 5.56 degrees C) above monthly expected values. It is therefore not surprising that both Texas and Oklahoma experienced their warmest August on record (1895-2011). It is worthy to note that both of these states are also following their warmest July on record (1895-2011). The August Texas average temperature was an astounding 88.10 degrees F (31.17 degrees C), while in Oklahoma, the state average temperature for was 87.40 degrees F (30.78 degrees C). With a state wide average temperature of 86.20 degrees F (30.11 degrees C), Louisiana also recorded its warmest August on record (1895-2011). For Arkansas, it was the eleventh warmest August on record (1895-2011) with a state average temperature of 82.90 degrees F (28.28 degrees C). The average state temperature for Mississippi was 82.80 degrees F (28.22 degrees C), while in Tennessee, the state average temperature for the month was 77.70 degrees F (25.39 degrees C). For Mississippi it was the eighteenth warmest August on record (1895-2011), while for Tennessee, it was the twenty-eighth warmest August on record (1895-2011).
- Dry conditions continued into August for much of the Southern Region. With the exception of Arkansas and eastern Oklahoma, conditions were quite drier than normal. Arkansas averaged a total of 4.12 inches of precipitation for the month, making it the twenty-eighth wettest August on record (1895-2011). Most stations in the interior portions of the state reported between 130 to 200 percent of normal. Similar conditions were observed in eastern Oklahoma and in a small part of central Texas. Elsewhere, conditions were much drier than normal with the majority of stations recording less than 50 percent of normal precipitation. The state of Texas recorded its third consecutive month of less than one inch (25.4 mm) of precipitation. The State averaged only 0.73 inches (18.54 mm), making it the fifth driest August on record (1895-2011). Louisiana averaged only 1.81 inches (45.97 mm) of precipitation for the month, which equates to the third driest August on record (1895-2011) there. Mississippi experienced its sixth driest August on record (1895-2011) with a average monthly precipitation total of just 1.80 inches (45.72 mm). It was also a very dry month for Tennessee, which recorded only an average of 1.44 inches (36.58 mm) of precipitation, or its fourth driest August on record (1895-2011). Oklahoma averaged 2.49 inches (63.25 mm) of precipitation. This equates to the forty-ninth driest August on record (1895-2011). It is worth noting that much of the state was quite drier than that statistic implies, which is somewhat biased by much wetter than normal conditions that occurred in the eastern-most counties.
- A third consecutive month of anomalously warm and anomalously dry conditions has led to a worsening of drought conditions in the Southern Region. As of August 30, 2011, approximately 54 percent of the region is experiencing exceptional drought; the highest designation of drought by the National Drought Mitigation Center. This area includes approximately: eighty-one percent of Texas, sixty-nine percent of Oklahoma, and thirty-eight percent of Louisiana. Some drought improvement occurred in Arkansas, where wetter than normal conditions dominated for part of the month.
- According to the Texas Forestry Service, 20,155 fires have been reported in Texas since the beginning of Wildfire Season on November 15, 2010. Since then, over 3.5 million acres have been scorched and Texas held approximately 51% of the total acres burned in the United States alone. During the current wildfire season, 3,056 homes and structures have been lost. However, with the aid of brave men and women from Texas and literally every other state in the nation, 42,077 homes and structures were saved this year. In addition, a record-breaking 251 of 254 counties enforced a burn ban by the end of August. (Information provided by the Texas Office of State Climatology)
- Some areas of Texas did receive precipitation in August, but the amounts of rain were far from removing the burden of the “worst one-year drought in recorded history.” Farmers and ranchers were hit the hardest during August 2011 and the crop and livestock reports had the evidence to prove it. As the costliest drought in Texas history, losses were estimated to be at $5.2 billion at the end of the month. Ranchers practically liquidated their herds as the water wells went dry and supplemental feeding became too expensive. Likewise, farmers were forced to give up on particular plots and only irrigate what they believed could yield a substantial crop. Across the state, the outlook was extremely bleak.(Information provided by the Texas Office of State Climatology). Drier than normal conditions in Tennessee has led to some moderate drought in the northwestern and central counties.
- On August 9, 2011, a twister in Cherokee County, Oklahoma led to one fatality and two injuries. At least two mobile homes were destroyed and numerous trees were uprooted or snapped.
- For more information, please go to the Southern Regional Climate Center Home Page.
- Western Region: (Information provided by the Western Regional Climate Center)
- August saw continued cooler than average temperatures along the Pacific coast, and average to record breaking warmth throughout the inland West. Precipitation was low throughout the region, with only weak monsoonal rainfall bringing scattered high precipitation values to some of the Rocky Mountain areas and Southwest states. Drought conditions remain in Arizona and New Mexico.
- Coastal California continued to see cooler than normal temperatures throughout the month of August due to a persistent marine layer. Santa Barbara, California had an average temperature for the month of 63.8 F (17.6 C), the 7th coolest average on record since 1941. San Francisco airport experienced an average high of 69.4 F (20.8 C), the 7th coolest average monthly high on a record since 1948. Several daily low temperature records were broken or tied along the coast during the month of August.
- Except for the coast, the Southwest saw higher than average temperatures throughout August, with many records being set in southeastern California, Arizona, and New Mexico. Las Vegas, Nevada airport noted the warmest August in its 75-year record, at 93.9 F (34.4 C), topping 1995 by 0.6 F (0.3 C), a result of the warmest minimum (81.9 F / 27.7 C) and 5th warmest maximum (105.8 F / 41.0 C). Nearby Needles, California and Kingman, Arizona also noted warmest Augusts. Tucson, Arizona experienced the second warmest August (89.3 F / 31.8 C) and summer on record. Over the last 8 days, six daily high temperature records were tied or broken along with three high minimum temperature records. On August 9, Roswell, New Mexico tied its monthly record maximum of 107 F (41.7 C), reached twice previously.
- Farther north, August 2011 was the hottest on record at Denver, Colorado with an average temperature of 77 F (25 C), surpassing the 76.8 F (24.9 C) of 1937. Boise, Idaho experienced an average temperature of 78.4 F (25.8 C), the second highest average August temperature since 1940. Many daily high temperature records were set in inland Oregon, Wyoming, Idaho, and Colorado.
- Precipitation was generally lower than average in the West. Numerous locations in the Pacific states received no precipitation at all for the month, where little if any is typically expected. Portland, Oregon reported a monthly total of 0.17 inches (4.3 mm), 0.71 in (18 mm) below the August average of 0.88 in (22.4 mm). At 20% of average rainfall this ranked as the 18th driest July in a 70-year record. Only the far northwestern tip of the Olympic Peninsula received above average rainfall. The rain forest airport at Quillayute received 3.22 in (81.7 mm) on the 22nd, an impressive amount for summer that would receive scant attention in the winter, and ended with 3.27 in (83.1 mm), 131 % of average.
- Monsoonal activity favored a few scattered locations in the inland mountainous West, though most were dry. This provided some relief from extreme drought conditions affecting New Mexico, Arizona, and southern Colorado. The monsoon season, mostly now ended, was lighter than usual nearly everywhere in the Southwest except in eastern Utah.
- A strong thunderstorm downdraft associated with monsoon activity caused a haboob (dust storm) 1,000 feet (305 m) to pass through the Phoenix area. This was the third such notable event to occur in Arizona this summer.
- The Southwest experienced moderate to exceptional drought during the month of August, with only little relief provided by monsoon rains throughout the month. The severity of the drought was reduced in some parts of New Mexico and Southern Colorado by the end of the month, while drought indices increased for much of Arizona. The drought continues to affect agriculture in the Southwest. Livestock in New Mexico were sold off in large numbers as not enough feed could be grown to sustain the animals.
See NCDC's Monthly Records web-page for weather and climate records for the most recent month. For additional national, regional, and statewide data and graphics from 1895-present, for any period, please visit the Climate at a Glance page.
PLEASE NOTE: All of the temperature and precipitation ranks and values are based on preliminary data. The ranks will change when the final data are processed, but will not be replaced on these pages. Graphics based on final data are provided on the Temperature and Precipitation Maps page and the Climate at a Glance page as they become available.