Did You Know?
Expand "U.S. Climate Normals"
U.S. Climate Normals
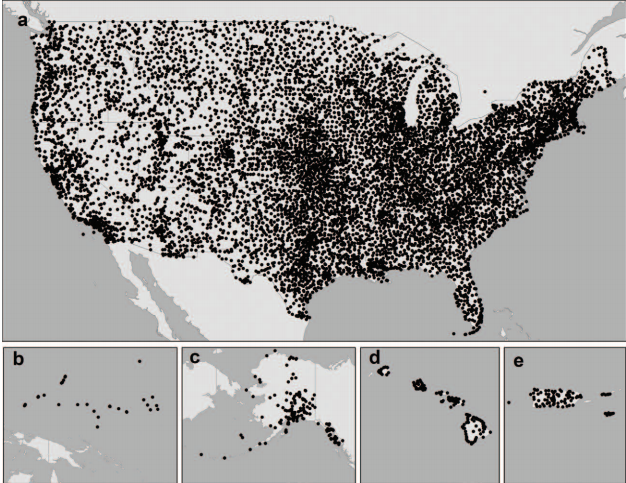
1981-2010 Normals: approximately 9800 stations across (a) the continental U.S. and Canada, (b) the Pacific Ocean, (c) Alaska, (d) Hawaii, and (e) the Caribbean Sea.
Climate Normals are three-decade averages of climatological variables. The most widely-used Normals are those for daily and monthly station-based temperature, precipitation, snowfall and heating and cooling degree days. These come from NOAA's Cooperative and First-Order station networks. Meteorologists and climatologists regularly use Normals for placing recent climate conditions into historical context; such as comparisons with the day's weather conditions on local television. Normals are also utilized in many applications across a variety of sectors. These include regulation of power companies, energy load forecasting, crop selection and planting times, construction planning, building design, and many others.
Several changes and additions were incorporated into the 1981-2010 Normals. Monthly temperature and precipitation Normals utilize underlying data values that have undergone additional quality control to account for things such as stations having been moved. Unlike the 1971-2000 Normals, daily (rather than monthly) data are used extensively in daily temperature Normals as well as heating and cooling degree day Normals, providing greater precision of intra-seasonal features. More details can be found in Arguez et al. 2011.
When the 1991-2020 Normals are released, relevant comparisons between the new version and previous versions will be highlighted. Observational evidence shows that the last 20 years have been the warmest such period on record across the U.S. Therefore, we anticipate that the new Normals will generally be warmer on average for most stations, but not uniformly warmer for all stations and all seasons. In fact, some station Normals in certain locations and seasons may become cooler.
Information on the current Normals, as well as the history of the Normals, please visit U.S. Climate Normals. For general questions about Normals or help accessing the 1971-2000 product, please contact NCEI.
National Overview:
March 2011 had a very active  weather
pattern over the contiguous United States. A westerly flow
dominated the circulation with many weather systems and cold fronts
moving in the flow. These systems produced 115 preliminary reports of
tornadoes and over 1000 hail and high wind damage reports, mostly in the
southeastern third of the nation. Snow cover expanded and contracted
during the month as winter storms moved across the country, with daily
coverage ranging from 19 percent (on the 19th) to 44 percent
(on the 8th). Integrated over the month, March 2011 snow
cover ranked as the 7th largest in the 45-year (1966-2011)
satellite record for the contiguous U.S. and 6th largest for
North America. On a national scale, March 2011 ranked as the
39th warmest and 34th wettest March in the
1895-2011 record. While drought conditions intensified in the southern Plains it improved in
the Southeast and Mid-Atlantic. Moderate to
exceptional drought coverage remained about the same as February covering approximately 24 percent of the country.
weather
pattern over the contiguous United States. A westerly flow
dominated the circulation with many weather systems and cold fronts
moving in the flow. These systems produced 115 preliminary reports of
tornadoes and over 1000 hail and high wind damage reports, mostly in the
southeastern third of the nation. Snow cover expanded and contracted
during the month as winter storms moved across the country, with daily
coverage ranging from 19 percent (on the 19th) to 44 percent
(on the 8th). Integrated over the month, March 2011 snow
cover ranked as the 7th largest in the 45-year (1966-2011)
satellite record for the contiguous U.S. and 6th largest for
North America. On a national scale, March 2011 ranked as the
39th warmest and 34th wettest March in the
1895-2011 record. While drought conditions intensified in the southern Plains it improved in
the Southeast and Mid-Atlantic. Moderate to
exceptional drought coverage remained about the same as February covering approximately 24 percent of the country.
Cold fronts and low pressure systems moving in the storm track flow are influenced by the broadscale atmospheric circulation. The large-scale atmospheric circulation indicators during March were generally weak. These included a continually weakening La Niña, which is the phenomenon created by cooler-than-average sea surface temperatures in the eastern tropical Pacific Ocean. The Pacific/North American (PNA) index was slightly positive during the month and the Arctic Oscillation (AO) index was slightly positive at the beginning of the month but became more positive by the end of March. The North Atlantic Oscillation (NAO) index was positive during the first half of the month but turned negative during the last part. Of these, the March temperature pattern (warmer than normal in the southern states, cooler than normal in the north central and west coast areas) is most consistent with a La Niña and positive NAO. The dryness in the Southern Plains is consistent with La Niña, even though it continued to weaken this month.
- Climate Highlights - March
- The average temperature in March was 44.0 degrees F (6.7 degrees C), which is 1.4 degrees F (0.8 degrees C) above the long-term (1901-2000) average. March precipitation, while extreme in the Southern Plains and Southern Rockies, was overall 0.22 inch (6 mm) above the long-term average. For the nation, the year-to-date temperature was near-normal, while average precipitation was below-normal.
- Above-normal warmth dominated much of the southern U.S. and Rocky Mountains during March. The largest temperature departures were in western Texas and New Mexico, which had its fifth-warmest March on record. Midland, Texas had four consecutive days—March 16 through 19—of temperatures that tied existing records.
- Cooler-than-normal temperatures were present in the northern and western areas of the country. Conditions were especially cool from southwestern Minnesota across the Dakotas into eastern Montana. Within this belt, March temperatures were as much as six degrees below the 20th century average.
- Precipitation varied across the country as the west and east coasts received above normal precipitation, while the central and southern United States was largely dry. Texas had its driest March on record, with a statewide average of 0.27 inch (7 mm). This was 1.47 inches (37 mm) below its 20th Century average, and broke the previous record of 0.28 inch (7 mm) set in 1971. It was the third driest March in New Mexico and tenth driest in Oklahoma.
- Record warm maximum temperatures at individual stations across the U.S. exceeded record cold minimum temperatures by a ratio of about 5-to-1 during March.
- On the Pacific coast, Washington, Oregon and California had their second, fifth, and ninth wettest March on record, respectively. Regionally, it was the second wettest March on record for the Northwest. In the Northeast, Pennsylvania had its third wettest such period.
- Drought conditions continued to intensify across much of the nation during March. According to the U.S. Drought Monitor, the overall footprint of drought did not increase, holding fairly steady at about 24 percent of the country. However, the area covered by the "Severe" and "Intense" drought categories almost doubled, from about 12 percent early in the month to more than 20 percent at month's end.
- Dry conditions across the Southern Plains contributed to above average wildfire activity during March. Across the U.S., approximately 385,000 acres burned, marking the second most active March on record in terms of wildfires, behind March 2006.
- Tornado activity during March was above average, with 115 preliminary tornado reports. Most of the tornado activity was confined to the Southeast and Gulf Coast, which is typical of early spring.
- An active storm pattern across the western and northern tiers of the country was associated with several significant snowstorms impacting those regions during March. The monthly snow cover extent for March ranked as the seventh largest in the 45-year period of record.
- Climate Highlights - First quarter of 2011 and Rolling Six- and Twelve-month Periods
- It was the tenth driest first quarter for both the South and Southwest climate regions. New Mexico, Oklahoma, and Texas experienced their second, fifth and ninth driest January-March period, respectively.
- Both the rolling six-month and twelve-month periods show that the northern United States has been generally wet, while the South has been dry.
- On the six-month timescale, October 2010 through March 2011, above-average precipitation occurred across much of the West, the Northern Plains and the Northeast. Nevada and Vermont each had its third-wettest such period. Other states with top-ten precipitation during the period were Pennsylvania (fifth wettest), New York (eighth), and Utah (ninth). The Southern Plains, Midwest and Southeast were generally dry during the period, with more unusual dryness focused in the south central United States. It was the fourth driest such period for Texas, sixth driest for Oklahoma, seventh for Arkansas and Louisiana, and the eighth driest for New Mexico.
- Over the past twelve months, April 2010-March 2011, a belt of abnormal wetness stretched from the western Great Lakes to the Pacific Northwest. Wisconsin had its wettest such period; its precipitation average of 41.52 inches (1055 mm) was more than 10 inches (254 mm) above the 20th century average. Additionally, Iowa, Minnesota, and North Dakota experienced their second wettest such period. Precipitation was below normal in the South during this period. It was the fourth driest such period in Louisiana, fifth driest in Arkansas, ninth driest in Florida, and tenth driest in Mississippi.
Alaska Temperature and Precipitation:
-
 Alaska
had its 44th warmest March on record, with a temperature 0.9°F (0.5°C) below the 1971–2000 average.
Alaska
had its 44th warmest March on record, with a temperature 0.9°F (0.5°C) below the 1971–2000 average.
-
 Alaska
had its 35th warmest January–March on record, with a temperature 1.3°F (0.7°C) above the 1971–2000 average.
Alaska
had its 35th warmest January–March on record, with a temperature 1.3°F (0.7°C) above the 1971–2000 average.
-
 Alaska
had its 4th driest March since records began in 1918, with an anomaly that was 55.9 percent below the 1971–2000 average.
Alaska
had its 4th driest March since records began in 1918, with an anomaly that was 55.9 percent below the 1971–2000 average.
-
 Alaska
had its 33rd wettest January–March on record, with an anomaly that was 17.9 percent above the 1971–2000 average.
Alaska
had its 33rd wettest January–March on record, with an anomaly that was 17.9 percent above the 1971–2000 average.
For additional details about recent temperatures and precipitation across the U.S., see the Regional Highlights section below. For information on local temperature and precipitation records during the month, please visit NCDC's Records page. For details and graphics on weather events across the U.S. and the globe please visit NCDC's Global Hazards page.
Regional Highlights:
These regional summaries were provided by the six Regional Climate Centers and reflect conditions in their respective regions. These six regions differ spatially from the nine climatic regions of the National Climatic Data Center.
- Northeast Region: (Information provided by the Northeast Regional Climate Center)
- Temperatures during the third month of 2011 averaged 34.3 degrees F (1.3 degrees C), which was 0.3 degrees F (0.2 degrees C) below normal. Averages among the states were within a degree F (0.6 degrees C) of normal, with five states (Maryland, New Hampshire, New York, Pennsylvania, and Vermont) averaging cooler than normal and the remaining seven states equal to or above normal. Overall, departures ranged from 0.9 degrees F (0.5 degrees C) below normal in New York to 0.6 degrees F (0.3 degrees C) above normal in West Virginia. Temperatures rose to as much as 20 degrees F (11.1 degrees C) above normal during a brief warm spell mid-month. During this time several locations in the Northeast, including Portland, ME, Central Park, NY and Baltimore, MD, set new daily maximum temperature records.
- March was a wet month in most of the Northeast. The regional average precipitation total was 4.88 inches (124 mm) or 139 percent of normal. Ten states had above normal precipitation totals, with departures that ranged from 108 percent of normal in Delaware to 165 percent of normal in Pennsylvania, where it was the 3rd wettest March since 1895. At 37 percent of normal, Rhode Island was the driest state in the region. The surrounding states of Massachusetts (90 percent) and Connecticut (109 percent) saw above normal precipitation in the western counties and very little precipitation in the eastern half of each state. Below normal precipitation totals followed the coast to the south, with eastern Long Island, southern Delaware and Maryland averaging drier than normal.
- After a relatively quiet February, the weather pattern was more active in March. Several rain/snow events resulted in flooding, road closures, downed trees and structural damage. On March 6-7, a cold front that stretched from Maine to Florida drenched parts of the region with 1-2 inches (25-50 mm) of rain while dumping up to 30 inches (76 cm) of snow on upstate New York and northern New England. Whiteout conditions from this storm closed Interstate 89 in Vermont for several hours, while ice-jam flooding closed roads in Connecticut. The March 6-7 snowstorm total of 25.8 inches (65.5 cm) was the third largest snowfall ever recorded in Burlington and the greatest total snowfall of any March storm as measured at the NWS Office-Burlington, VT. To the south, the 1-2 inches (25-50 mm) of rain that fell on the 6th and 7th combined with additional rain on the 10-11th to put many waterways, including the Allegheny, Delaware, Raritan, Passaic, and Susquehanna rivers over their banks. At least 2000 homes were evacuated in the Passaic River basin, where the gauge at Little Falls, NJ remained above flood stage for 10 consecutive days. About 90 buildings were damaged in Hempfield Township, Westmoreland County, PA on the 23rd when a tornado, packing winds as high as 120 mph (53.6 m/s) touched down. The tornado, classified as an F2 on the Fujita scale, ripped roofs from houses, downed trees and damaged a football stadium at the Hempfield High School. Luckily, no injuries or deaths were reported. On a positive note, reports from Pennsylvania and Vermont indicated that temperature conditions from mid to late March were favorable for maple syrup production.
- For more information, please go to the Northeast Regional Climate Center Home Page.
- Midwest Region: (Information provided by the Midwest Regional Climate Center)
- March temperatures were well below normal across the snow-covered northern half of the Midwest, and near normal over the southern half of the region. The largest departures, -8 degrees F (-4.4 degrees C), were found over west-central Minnesota, while across Wisconsin and Michigan temperatures were generally 2 to 4 degrees F (1 to 2 degrees C) below normal. Temperatures during the period March 15-21 were much above normal, in contrast to the cool weather the remainder the month. Average daily temperatures were well above normal across the entire region, with temperatures as much as 7 to 9 degrees F (3.9 to 5.0 degrees C) above normal from Missouri eastward through Ohio. There were numerous record high minimum and record high maximum temperatures set this week, most of them in the southern two-thirds of the region.
- Precipitation was near to above normal from southern Minnesota across much of Wisconsin and southern Lower Michigan. Precipitation was also above normal from southern Missouri through the Ohio Valley, and from 125 percent to 150 percent of normal in most of Ohio and eastern Kentucky. In contrast, it remained very dry across northern Minnesota and the Michigan Upper Peninsula, with precipitation less than 50 percent of normal. Precipitation was also less than 50 percent of normal in western Iowa to northwestern Missouri. March snowfall topped two feet (61 centimeters) in parts of Minnesota and Wisconsin and was above normal from central Minnesota eastward into Lower Michigan, and across central Missouri. In Missouri, snowfall totals for the season beginning July 1st were running much above normal to near record amounts in the state. Columbia reported 53.4 inches (135.6 centimeters) for the season, which was 1.6 inches (4.1 centimeters) short of the all-time record 54.9 inches (139.5 centimeters) set in 1977-78. Some snow season statistics for other locations in the state include:
Kansas City 36.9 inches (93.7 centimeters) 9th snowiest
St. Louis 36.8 inches (93.5 centimeters) 6th snowiest
At the end of the month there were four or more inches (10.2 centimeters) of snow in the northern half of Minnesota, the northern half of Wisconsin, and the northern half of lower Michigan. There were also two or more inches (5.1 centimeters) of snow on the ground in north-central and northeastern Ohio. - At the end of the month stream flow conditions in the southern half of the region were at or below normal, while they were much above normal in the Upper Mississippi River basin. On March 31st the Mississippi River at St. Paul, MN was at 18.75 feet (5.72 meters), 1,75 feet (0.53 meters) above major flood stage and down from a peak of 19 feet (5.79 meters) earlier in the week. Flood stage there is 14 feet (4.72 meters). A second crest is expected as runoff increases from melting snow and additional rain. The Mississippi River was experiencing minor flooding as far south as Grafton, IL, with moderate flooding reported at several locations between the Quad Cities and Burlington, IA.
- For details on the weather and climate events of the Midwest, see the weekly summaries in the MRCC Midwest Climate Watch page.
- Southeast Region: (Information provided by the Southeast Regional Climate Center)
- Monthly average temperatures for March were generally above normal across the Southeast region. The greatest departures were found across the southern and western parts of the region (2 to 4 degrees F; 1.1 to 2.2 degrees C above normal), while temperatures across the remainder of the Southeast were near normal to slightly above normal (1 to 2 degrees F; 0.5 to 1.1 degrees C above normal). Mean monthly temperatures were variable across Puerto Rico, while for the fifth consecutive month mean temperatures were below normal in the U.S. Virgin Islands. For the month of March, there were 418 record daily high maximum temperatures across the Southeast and most occurred during the second half of the month. Brunswick Regional Airport in Georgia reached 90 degrees F (32.2 degrees C) on the 22nd, which tied for the all-time warmest maximum temperature in March for a record extending back to 1948. Unseasonably warm temperatures also stretched into the northern tier of the region; Sterling, VA, near Washington D.C., recorded a record high temperature of 80 degrees F (26.7 degrees C) on the 19th. Towards the end of March, a damp and chilly air mass settled over the northern tier of the region, resulting in over 200 daily low maximum temperature records between the 27th and 29th of the month. Greensboro, NC only reached 38 degrees F (3.3 degrees C) on the 27th, a new record low maximum temperature for that day.
- Precipitation totals were highly variable across the Southeast region in March. The wettest locations (150 to 200 percent of normal) were found in the interior of the region from western and northern Alabama through the southern Appalachian Mountains to northern Virginia and across much of central Florida. Locally heavier amounts (200 to 300 percent of normal) were recorded in western and northern Alabama, northern Georgia and South Carolina, and southwestern North Carolina. Some of this precipitation was orographically enhanced due to south-southeasterly flow ahead of several slow-moving storm systems. Lake Toxaway, NC recorded 8 inches (203.2 mm) of rainfall on the 6th, which broke the previous 24-hr rainfall total of 7.68 inches (195.1 mm). For the month, Lake Toxaway recorded 19.73 inches (501.1 mm) of precipitation, making it the 3rd wettest March in a record extending back to 1951. Atlanta, GA recorded its 2nd wettest month in the past 5 years and its wettest March since 2001 with 9.06 inches (230.1 mm) of precipitation. It was the 5th wettest March in Tampa, FL (9.79 inches; 248.7 mm) and 7th wettest March in Huntsville, AL (9.76 inches; 247.9 mm) in records extending back to 1890 and 1895, respectively. The driest locations in the Southeast were found across the Florida Panhandle, south Florida, and southeast Puerto Rico. Guayana, PR recorded only 0.11 inches (2.8 mm) of rainfall for the month, which was less than 10 percent of normal. Elsewhere across the Southeast, monthly precipitation was generally between 50 and 75 percent of normal.
- March was an active month for severe weather across the Southeast owing to the passage of several strong frontal systems. There were a total of 714 reports across the region, including 41 tornado reports. Three tornadoes were reported across central North Carolina on the 6th of the month, with one injury associated with smoke inhalation resulting from a house fire. An outbreak of tornadoes occurred across the southern U.S. from the 9th to the 10th, including 10 reports in Alabama, 6 in Florida, 2 in Georgia, and 2 in Virginia. The strongest tornadoes (EF-2) occurred across southern Alabama near the towns of Theodore and Silver Hill. Several injuries were reported from these storms. The second major severe weather outbreak occurred on the 26th and 27th of the month. Eight tornadoes, including an EF-1 that touched down near the Middle Georgia Regional Airport in Houston County, were reported in Georgia along with numerous reports of large hail. According to the Georgia State Climate Office, a hailstone measuring 4.25 inches (107.9 mm) in diameter was observed in Coweta County, making it the largest hailstone ever observed in Georgia in March. The month ended with another line of strong storms and multiple tornadoes across central Florida. Most notably, a weak tornado touched down at the Lakeland Regional Airport during the annual Sun n? Fun Airshow on the 31st of the month. Seven spectators were injured when a tent collapsed and as many as 50 small aircraft were severely damaged.
- Light to moderate snow was reported across the northern tier of the Southeast region on the 27th and 28th of the month in association with a weak area of low pressure near the Gulf coast. Locations in the mountains of southwest Virginia and northwest North Carolina reported up to 3 inches (76.2 mm) of snow, while several locations in the Piedmont recorded measurable snow.
- The heavy rains in March contributed to an elimination of drought conditions across northern Alabama and Georgia, western North Carolina, and southwest and northern Virginia. Conversely, the Carolina coasts saw a return of abnormally dry conditions (D0) by the end of March, while large parts of eastern and southern Florida remained under extreme (D3) drought conditions throughout the month.
- For more information, please go to the Southeast Regional Climate Center Home Page.
- High Plains Region: (Information provided by the High Plains Regional Climate Center)
- Temperatures were generally warmer than normal in the west and cooler than normal in the east across the High Plains Region this month. Colorado had temperatures which ranged from near-normal up to 6 degrees F (3.3 degrees C) above normal. Colorado Springs, Colorado had its 11th warmest March on record with an average temperature of 43.1 degrees F (6.2 degrees C) which was 5.3 degrees F (2.9 degrees C) above normal (period of record 1894-2011). The warmest March on record in Colorado Springs occurred in 1910 with an average temperature of 47.4 degrees F (8.6 degrees C).
- Meanwhile, the Dakotas were very cold when compared to normal this month. Average monthly temperatures across those states ranged from 6-10 degrees F (3.3-5.6 degrees C) below normal and many locations ranked in the top 10 coldest Marches on record. Aberdeen, South Dakota had an average temperature of 21.1 degrees F (-6.1 degrees C) which was 9.6 degrees F (5.3 degrees C) below normal. While not cool enough to break the 1897 record of 15.1 degrees F (-9.4 degrees C), this month's average temperature did rank as the 7th coolest on record (period of record 1893-2011). While the month was cold overall, there was a mid-month warm-up which caused runoff to increase the flows of creeks and rivers in northeast South Dakota and eastern North Dakota. Temperatures cooled off at the end of the month and stopped the snow melt processes. However, due to the late-month cool down and additional precipitation, major flooding is still a concern for April.
- Overall, March was a dry month across the High Plains Region. Large areas of Colorado, Kansas, Nebraska, and Wyoming received 50 percent or less of normal precipitation. Pockets of southeastern Nebraska, north-central Colorado, west-central Wyoming, and southern Kansas only got 25 percent or less of normal precipitation. In many of these areas, drought conditions either developed or expanded. According to the U.S. Drought Monitor, due to minimal precipitation over the past two months, the severe drought conditions (D2) in south-central Colorado and west-central Kansas have expanded to include most of eastern Colorado and much of southwestern Kansas. Meanwhile, the moderate drought conditions (D1) in western Kansas expanded north into south-central Nebraska due to low soil moisture levels. Abnormally dry conditions (D0) have also expanded further east in Nebraska as well. Other locations had a reduction or elimination of drought conditions. By the end of the month west-central Wyoming and the western part of the Nebraska panhandle were drought free and the D1 and D0 conditions in eastern Kansas had been trimmed. According to the U.S. Seasonal Drought Outlook released March 17th drought conditions across Colorado and Kansas were expected to persist.
- Wetter than normal conditions did occur in western and northern Wyoming, north-central Colorado, central North Dakota, and a few pockets of South Dakota and Nebraska. This month's wet spot was central North Dakota. Another 13.7 inches (35 cm) of snow fell this month which pushed Williston, North Dakota's snowfall total this season (July-June) to 94.6 inches (240 cm). This was enough to break the longstanding seasonal snowfall record of 89.9 inches (228 cm) set back in the 1895-1896 snowfall season (period of record 1894-2011). With snow still possible in April and May, Williston's new record could continue to grow. While not excessively wet this month, South Dakota has been very wet over the past year and many locations already rank in the top 10 snowiest seasons on record. Sisseton, South Dakota, located in the northeast corner of the state, received 10.9 inches (28 cm) of snowfall this month and while this was not a record breaking amount, the snowfall did push the seasonal total up to 82.0 inches (208 cm). This makes the 2010-2011 snowfall season the second snowiest in Sisseton (period of record 1900-2011). The record was set during the 1993-1994 season with 82.3 inches (209 cm) of snow, which is only 0.3 inches (1 cm) higher than this season's total. Based on past climate, there is a 66% chance that Sisseton will break the current record.
- Severe weather was not a prominent issue this March across the High Plains Region. Out of the 5 days when severe weather was reported, the most active day was March 22nd. One tornado, large hail, and high winds were reported in eastern Nebraska, and hail was reported in northern Kansas. A weak EF1 tornado caused minor damage near the town of Craig, Nebraska. That same day thunder-snow was reported in eastern North Dakota and over a foot (30 cm) of snow fell in some locations.
- This month's interesting event came from the South Dakota State Climate Office. During the evening of Friday, March 11th an unexpected blizzard caught many people living on the Coteau Hills in Day, Marshall, and Roberts counties by surprise. The Aberdeen National Weather Service issued a blizzard warning for those counties, along with Campbell, McPherson, Brown, Walworth, Edmunds, Potter, and Faulk counties at 5:24pm for winds speeds between 30 and 40mph along with light snowfall. Many motorists who were traveling home from work were caught in the whiteout conditions in the rural areas and had to spend the night at local businesses and neighbors. The Webster Reporter and Farmer, a Day County newspaper, reported that the Day County dispatch received a total of 84 calls for assistance. Local law enforcement and volunteers spent much of the night rescuing motorists stranded on local highways. Two gas stations located along US Hwy. 12, HR One Stop and The Hot Spot, saw 70 and 30 people respectively spend the night in their stores. On a county road north of Pickerel Lake, at least four people spent the night in their vehicles until locals were able to reach them the next morning. Fortunately, no serious injuries or accidents were reported.
- For more information, please go to the High Plains Regional Climate Center Home Page.
- Southern Region: (Information provided by the Southern Regional Climate Center)
- March average temperatures were generally above normal for the majority of the Southern Region. The state of Texas showed the highest variation from expected values. Throughout most of the state, temperatures averaged between 2 to 6 degrees F (1.11 to 3.33 degrees C) above normal. Anomalies were even higher in western portions of the state, including the Trans Pecos Climate Division, where stations averaged between 6 to 10 degrees F (3.33 to 5.56 degrees C) above normal. The state average March temperature was 61.70 degrees F (16.50 degrees C), which makes it the seventeenth warmest March on record (1895-2011). With the exception of Arkansas, average temperatures for the remainder of the region averaged between 0 and 4 degrees F (0 to 2.22 degrees C) above normal. In Arkansas, small pockets in the central and northern counties experienced a slightly cooler than normal month, however; for the most part most stations reported within approximately 2 degrees F (1.11 degrees C) of normal. Louisiana averaged 62.10 degrees F (16.72 degrees C) for the month, which was the twenty-eight warmest March on record (1895-2011). The other state average temperatures include: Oklahoma at 51.80 degrees F (11.00 degrees C), Mississippi at 57.80 degrees F (14.33 degrees C), Arkansas at 52.10 degrees F (11.17 degrees C), and Tennessee at 50.70 degrees F (10.39 degrees C).
- March precipitation was quite variable throughout the Southern Region, which extreme dryness in Texas and Oklahoma, drier than normal conditions in Arkansas and Louisiana, and wetter than normal conditions in Mississippi and Tennessee. Tennessee averaged a total of 6.56 inches (166.62 mm) of precipitation, while Mississippi averaged a total of 6.29 inches (159.77 mm). It should be noted for Mississippi, however; that precipitation totals in the southern half of the state ranged between 100 to 200 percent of normal, while in the north, precipitation totals ranged from 70 to 100 percent of normal. Similarly for Tennessee, conditions were near normal in the central and western counties, however; it was much wetter in the eastern portion of the state with most stations reporting between 150 to 200 percent of normal precipitation. Arkansas and Louisiana experienced a drier than normal month with state average precipitation totals of 2.75 inches (69.85 mm) and 3.56 inches (90.42 mm), respectively. Oklahoma averaged only 0.72 inches (18.29 mm) of precipitation. This was the tenth driest March on record (1895-2011) for the state. A majority of stations in Oklahoma averaged less than one inch (25.40 mm), and less than a quarter of expected monthly normals. In Texas, conditions were even drier. The state average precipitation total was only 0.27 inches (6.86 mm), which is the driest March on record (1895-2011) for the state. The previous record for the state was set in 1971, with a precipitation total of 0.28 inches (7.11 mm). Precipitation totals throughout the state ranged mostly between 0 and 25 percent of normal. In the Trans Pecos climate division, 39 stations reported no precipitation. This was also the case for approximately half of the stations in the Lower Valley and Southern climate divisions.
- Extreme March dryness in Oklahoma and Texas has led to dramatic changes in drought conditions over the past month. As of March 1, 2011, only 10.76 percent of the Southern Region was classified as extreme drought. As of March 29, 2011, that value is now 28.53 or almost three times as high. Most of the extreme drought expansion occurred in south western Texas, where precipitation totals for the month of march ranged from 0 to 25 percent of normal, with a majority of stations receiving less than one tenth of an inch (2.54 mm) of precipitation for the month. A new section of extreme drought has emerged in north central Texas and south central Oklahoma. Similarly, new extreme drought was introduced into north eastern Texas, and southern Arkansas. In addition, a majority of the north east section of the Southern Region is now experiencing severe drought or worse, as opposed to last month, where much of the north east was showing just abnormally dry or moderate drought conditions. In Mississippi and Tennessee, drought conditions have improved over the past month. Tennessee is now drought free, while Mississippi has seen a one category improvement to mostly abnormally dry with pockets of moderate to severe drought.
- A total of 10 tornado reports were recorded in Louisiana on March 5, 2011. These occurred in the south eastern and south central portions of the state. In Acadia Parish, a total of two fatalities and twenty-seven injuries were reported. These twisters occurred near Rayne and Crowley, Louisiana. In Rayne, the twister was reported to be approximately 300 yards wide with a damage path that was 12 miles long. Extensive damage was reported in the city of Rayne. Significant roof damage was also reported in Livingston, East Baton Rouge and Terrebone parishes.
- On March 8, 2011, a total of three people were injured when a series of tornadoes touched down in Southern Louisiana. All three injuries were reported in St. Tammany Parish. Extensive roof damage, downed trees and power line damage was reported. Fortunately, there were no fatalities. Four tornadoes were also reported on the same day in north eastern Texas. There were no reports of injuries or fatalities. Damage was restricted mostly to trees and power lines.
- Several tornadoes were reported on March 9 in southern Mississippi and southern Louisiana. Damage to several mobile homes were reported in Harrison County, Mississippi.
- Other instances of tornadoes occurred on the fourteenth of the month in south central Mississippi, and on the twenty-ninth of the month in southern Louisiana.
- For more information, please go to the Southern Regional Climate Center Home Page.
- Western Region: (Information provided by the Western Regional Climate Center)
- Temperatures were near normal throughout the West except for northeast Montana where well below normal temperatures occurred, and along the West Coast, which was mildly cool, in and parts of the Southwest where temperatures were above normal. Glasgow, MT, had an average temperature of 11.0 degrees F (6.2 C) below normal while Albuquerque, NM, was 5.1 degrees F (2.8 C) above normal.
- Drier than normal conditions prevailed in the Southwest while much above normal precipitation occurred from central California to the Pacific Northwest. Rainfall totals in parts of NW California and SW Oregon exceeded 30 inches (762 mm), with measureable rain (0.01 inch / 0.25 mm) falling in Crescent City CA 28 of the first 29 days, and in Tigard OR on every day of the month It was the wettest March in Sacramento since 1995 and the second all-time wettest in Mount Shasta City dating back to 1949. In northern California March of 2011 exceeded the "Miracle March" of 1991 in total precipitation, the difference being that more than half the Water Year 1990-91 precipitation occurred in that one month. It was the wettest March in Winnemucca, NV, in 97 years. Total snowfall this winter in Glasgow, MT, has been 105.3 inches (267 cm) through March, which has shattered the old record of 70.7 inches (180 cm) set in 2003-04. Flood watches and warnings were in effect in the region in early April. In Arizona and New Mexico, many stations recorded no precipitation at all for the month.
- April 1st snow pack was very healthy throughout the west. Except for those in Arizona and New Mexico, almost all river basins were above 100% of normal for April 1st, on average the date of peak snow water content, and the most important indicator date of the year for spring-summer runoff forecasts. The Central Sierra was roughly 165% of normal with some locations reporting 80 inches (203 cm) of water in the snow pack. Nearly 570 inches (1448 cm) of snow has fallen near Donner Summit through March with a maximum snow depth of 222 inches (564 cm) on the 26th, the greatest snow depth there since March 1952. Nearby ski areas reported 800 inches (2000 cm) of seasonal snowfall and depths of 250 to over 300 inches (635 to 760 cm). Typical deep-snow problems were present, such as buried "overhead" power lines, propane leaks into the snow and subsequent explosions, and structural damage.
- Winds of up to 75 mph (34 m/s) hit the coast of Oregon and Washington causing power outages to about 4,000 people. Wave heights of up to 31 feet (9.4 m) closed the Tillamook Bay bar in Oregon and closed the Columbia River bar to all but commercial shipping on the 2nd.
- A band of thunderstorms moved across Oahu early on the 4th with wind gusts of 50 mph (22 m/s). Downed trees and power lines caused road closures and power outages. More than 14,000 homes and businesses were without power and many schools were forced to close.
- The huge earthquake in Japan on March 11th generated a tsunami that reached the West Coast the next morning Pacific Time. Two people died, one from a boat in Brookings, OR, and another was swept to sea near the mouth of the Klamath River in Northern California. All docks and 35 boasts in Crescent City harbor, CA, were destroyed and damage is expected to exceed $20 million. Santa Cruz harbor sustained at least $14 million in damage with numerous boats sunk or overturned. Total California damage is estimated at over $48 million. Over 1,800 residents in San Luis Obispo County were evacuated with numerous school closures in anticipation of damaging waves.
- A series of strong storms greeted California upon the arrival of spring causing heavy rain and snow. Heavy snow and low visibilities caused a 30-car pileup on Interstate 80 in the Sierra on the 18th killing one person. Highway 80 over Donner Summit was closed off and on numerous times throughout the 9-day period. Up to 5,000 customers in the Sierra foothills lost power and Yosemite National Park closed on the 21st for the first time in 15 years to due power outages and roads blocked by heavy snow, fallen trees and mudslides. Most tourists evacuated the park. Up to 12 feet (366 cm) of snow fell in parts of the central Sierra over the 9-day period raising snow depths to near record levels in some locations.
See NCDC's Monthly Records web-page for weather and climate records for the most recent month. For additional national, regional, and statewide data and graphics from 1895-present, for any period, please visit the Climate at a Glance page.
PLEASE NOTE: All of the temperature and precipitation ranks and values are based on preliminary data. The ranks will change when the final data are processed, but will not be replaced on these pages. Graphics based on final data are provided on the Temperature and Precipitation Maps page and the Climate at a Glance page as they become available.