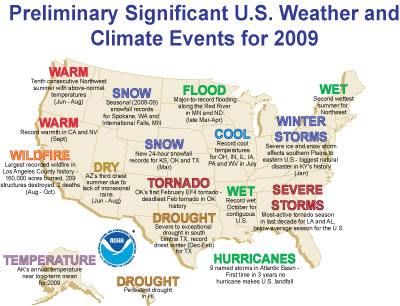
2009 National Events Map
Click for more information
Issued January 15, 2010: The data presented in this report are final through July and preliminary from August-December. Ranks, anomalies, and percent areas may change as more complete data are received and processed.
National Temperatures


Based on data from January through December, the average annual temperature for the contiguous U.S. was 53.1 degrees F (11.7 degrees C), which is 0.3 degrees F (0.2 degrees C) above the 20th Century average
Seasonal Analysis:

As with most seasons, winter
 December-February 2008-09 featured regional variations in temperature, but the overall average temperature for the contiguous United States was officially "near-normal", or within the middle third of historic winter temperatures. The season was the 40th warmest such period on record (1896-2009), with above-normal temperatures across parts of the
 South and
 Southwest. Both the
 Central and
 East North Central regions experienced cooler-than-normal temperatures during the
 period. The monthly variations are illustrated in the statewide rank maps for
 December,
 January, and
 February.

The warm anomalies strengthened in the
 spring (March-May) period, ranking the contiguous U.S. 29th warmest overall. The warmer-than-average temperatures that were seen in the South and Southwest regions during the winter shifted to the
 West and
 Southwest regions during the
 spring.

Based on NCDC's ranking methods, the contiguous U.S. experienced a
 summer (June-August) that ranked 42nd coolest since 1895. A recurring upper level trough in the Central U.S. filtered in Canadian air that created below-normal temperatures throughout the Central and northern Plains, Midwest and Great Lakes areas. The cool anomalies peaked in
 July, when six states (
 Ohio,
Ohio,
 Indiana,
 Illinois,
 Iowa,
Iowa,
 Pennsylvania, and
 West Virginia) experienced record cool temperatures for the month. This sharp cool feature was partially balanced by warmth in the South and West. For the summer period, the temperature averages in
 Florida,
 Texas, and
 Washington were much-above-normal. It is noteworthy that an El Niño emerged during early summer 2009. Preliminary attribution exercises performed by NOAA scientist indicated that cooler-than-normal temperatures in the central U.S. during summer and early autumn are not inconsistent with expectations during a developing El Niño episode.

Fall 2009 was a season of extremes for the contiguous United States. While
 September was about 1 degree F (0.6 degrees C) above the long-term mean (LTM),
 October was marked by an active weather pattern that reinforced unseasonably cool air behind a series of cold fronts, creating an average temperature that was 4 degrees F (2.2 degrees C) below the LTM and ranked the nation as the 3rd coolest, based on preliminary data. In October,
 42 of the lower 48 states averaged temperatures that were below-normal.
 Florida was the only state with an above-normal temperature for October. The following month was something of a mirror image, becoming the
 3rd warmest November on record, 4 degrees F (2.2 degrees C) above the LTM. Overall, the
 nationally-averaged temperature for the three month autumn period was above-normal, as the 31st warmest on record.

Annual averaged temperature for Alaska during 2009 was near the long-term mean.
 Winter temperatures in 2008-2009 were 1.9 degrees F (1.1 degrees C) below average.
 Spring temperatures were 0.7 degrees F (0.4 degrees C) below average,
 summer was 0.7 degrees F (0.4 degrees C) above average, and
 fall was 1.4 degrees F (0.8 degrees C) warmer than the 1971-2000 average. The Alaska data in this report is a composite of several preliminary datasets at NCDC.

One way to assess the magnitude of warm and cold episodes is to compute the percent area of the contiguous United States that was "very warm" and that which was "very cold". A figure that depicts these values for each month in the past 30 years is provided to the left. These percentages are computed based on the climate division data set. Those climate divisions having a monthly average temperature in the top ten percent (> 90th percentile) of their historical distribution are considered "very warm" and those in the bottom ten percent (< 10th percentile) are "very cold".
The U.S. experienced several warm and cold outbreaks during 2009. The first occurred in
 July, when 39 percent of the contiguous U.S. was "very cold". An abnormally strong and persistent upper-level pattern during the month helped produce a large number of record low temperatures east of the Rockies. In
 October, an active weather pattern reinforced unseasonably cool air behind a series of cold fronts. As much as 54 percent of the contiguous U.S. was "very cold".
 November was on the other end of the scale, when 45 percent of the U.S. was "very warm", according to the definitions provided above. The huge swings in variability continued in December when 36 percent of the contiguous U.S. experienced "very cold" temperatures. According to the National Snow and Ice Data Center, these cooler-than-normal temperature anomalies resulted from a strong negative phase of the Arctic Oscillation (AO), the strongest negative phase of the AO since 1950. A negative phase AO is often associated with a warm Arctic region and cooler conditions in the mid-latitudes of the Northern Hemisphere.

Based on data through December, above-average temperatures were measured in the lower troposphere during 2009. Data collected by NOAA's TIROS-N polar-orbiting satellites and adjusted for time-dependent biases by NASA and the Global Hydrology and Climate Center at the University of Alabama in Huntsville, indicate that temperatures in the lower half of the troposphere (lowest 8 km of the atmosphere) over the U.S. were slightly warmer than the 20-year (1979-1998) average.
National Precipitation

Based on data from January through December, the average annual precipitation for the contiguous U.S. was 2.33 inches above the long-term average with a final annual amount of 31.47 inches. It was the 18th wettest in 115-years of record keeping.
Seasonal Analysis:

Nationally, this was the
 22nd driest winter (December-February) in the 1895-2009 record.
 Texas recorded its driest winter on record, while the state of
 North Dakota experienced its wettest winter on record. The contrast in rankings were the result of an active upper level pattern that shuttled systems rapidly across the northern tier states, while bypassing the deeper south. Some locations in North Dakota received more than 400 percent of their normal precipitation, breaking snowfall records not only for the month of December, but for any single month. Meanwhile, the persistent dry pattern in Texas led to further expansion of drought conditions.

It was the
 18th wettest spring for the contiguous U.S. in 2009.
Stagnant surface storm systems and surface fronts across the southern U.S. led to the above normal precipitation averages across the southeastern half of the United States and much above normal precipitation in the Southeast Climate Region in particular.
18th wettest spring for the contiguous U.S. in 2009.
Stagnant surface storm systems and surface fronts across the southern U.S. led to the above normal precipitation averages across the southeastern half of the United States and much above normal precipitation in the Southeast Climate Region in particular.
 Georgia experienced its second wettest such period. Several other states experienced a spring period that saw above average precipitation:
 Florida (5th wettest),
 Illinois (5th),
 Alabama (7th), and
 Arkansas (9th).
The spring season was characterized by several extreme climatic events. In March, record breaking flooding occurred in parts of Minnesota and North Dakota along the Red River. The flooding was preconditioned by copious winter precipitation coupled with persistent precipitation-producing storms in the spring. Record-high flows were recorded along the Red River with peak levels exceding the 500-year return interval. In late March, a blizzard in the Southern Plains was responsible for three new state record 24-hour snowfall values in Texas, Oklahoma, and Kansas. During the same time, drought in southern Texas was at its peak. Much of the state was suffering from the lack of precipitation which led to 85 percent of Texas experiencing moderate-to-exceptional drought conditions during March and April.
Arkansas (9th).
The spring season was characterized by several extreme climatic events. In March, record breaking flooding occurred in parts of Minnesota and North Dakota along the Red River. The flooding was preconditioned by copious winter precipitation coupled with persistent precipitation-producing storms in the spring. Record-high flows were recorded along the Red River with peak levels exceding the 500-year return interval. In late March, a blizzard in the Southern Plains was responsible for three new state record 24-hour snowfall values in Texas, Oklahoma, and Kansas. During the same time, drought in southern Texas was at its peak. Much of the state was suffering from the lack of precipitation which led to 85 percent of Texas experiencing moderate-to-exceptional drought conditions during March and April.

Summer (June-August) precipitation was variable in 2009, which is typical for the season, but overall near normal, ranking
 54th wettest out of 115-years worth of records.
 Regionally, the
 Northeast had its 2nd wettest summer ever, continuing a string of abnormally wet summer periods. Both the
 Southeast and
 Southwest were below normal. On the state level, the lack of monsoonal rains in the Southwest contributed to
 Arizona's 3rd driest summer. Precipitation averages in
 Georgia and
 South Carolina were also much below normal. Conversely, both
 Maine and
 Massachusetts experienced their 3rd wettest summer period.
It was the
 13th wettest Autumn on record for the contiguous United States.
 Regionally, dry conditions continued in the
 West and
 Southwest where
 Arizona,
 Utah, and
 Nevada averaged much-below-normal precipitation for the three-month (Sep-Nov) period. This contrasted with the
 South,
 Southeast, and
 Central regions where precipitaton averages were above-normal to much-above-normal. Anomalously wet conditions in
 October led to a record wet month for the nation as a whole. The
 nationwide precipitation of 4.15 inches was nearly double the long-term average of 2.11 inches.
Persistent precipitation during September and October made
nationwide precipitation of 4.15 inches was nearly double the long-term average of 2.11 inches.
Persistent precipitation during September and October made
 Arkansas' autumn precipitation its greatest ever. This punctuated the state's remarkable run of wetness in
 2009, with four months of top three precipitation ranks (
 May, 1st wettest;
 July, 3rd wettest;
 September, 2nd wettest;
 October, 1st wettest).
Ten other states were much above normal in terms of precipitation for the autumn season. Interestingly, these high precipitation anomalies occurred despite only two tropical cyclones (Tropical Storms Claudette in August and Ida in November) making landfall during the Atlantic Hurricane season. Variable climatic extremes continued in the fall when, in November, the nationally-averaged precipitation ranked
October, 1st wettest).
Ten other states were much above normal in terms of precipitation for the autumn season. Interestingly, these high precipitation anomalies occurred despite only two tropical cyclones (Tropical Storms Claudette in August and Ida in November) making landfall during the Atlantic Hurricane season. Variable climatic extremes continued in the fall when, in November, the nationally-averaged precipitation ranked
 18th driest, continuing the run of below-normal November precipitation in the contiguous United States.

Like similar values for temperature extremes (see above), the percent area of the contiguous United States considered "very wet" and "very dry" is based upon tenth percentile placement (i.e., those areas with the wettest or driest ten percent of precipitation for a period). The size of the footprint of "very wet" and "very dry" conditons during each month in the last 30 years is depicted in the adjacent figure. These percentages are computed based on the climate division data set.
During 2009, there were back-to-back months that had precipitation extremes of more than 25 percent. The first was
 October, as 40 percent of the U.S. was very wet. During October, substantial precipitation, nearly double the long-term average, created record wet conditions in contiguous divisions throughout the South and Midwest states. Iowa, Arkansas, and Louisiana all experienced their record wettest October. Fourteen other states had precipitation readings ranking in their top five. On the other hand, 27 percent of the country was categorized as very dry in
 November. The upper level jet stream was confined to the higher latitudes of North America, holding at bay major weather systems. Meanwhile, high pressure systems, which typically deliver very little precipitation, dominated much of the Western U.S. and Gulf states.
Monthly National Snow and Ice Report

The Arctic sea ice reached its annual maximum extent on February 28, 2009, at 15.14 million square kilometers (5.85 million square miles). This is 720,000 square kilometers (278,000 square miles) below the 1979-2000 average of 15.86 million square kilometers (6.12 million square miles), marking the fifth-lowest maximum extent in the satellite record. The six lowest maximum extents have all occurred in the last six years (Source: National Snow and Ice Data Center). The Arctic sea ice reached its annual minimum extent on September 12, 2009, at 5.10 million square kilometers (1.97 millions square miles). This marks the third-lowest recorded extent since 1979, larger than the minimum extents of September 2007 and 2008. The 2009 minimum extent is 1.61 million square kilometers (620,000 square miles) below the 1979-2000 average minimum. The sea ice began its annual growth in Autumn, but at a slower rate compared to previous years. For the first weeks of November, the sea ice extent dropped below the 2007 record low extent, setting a new record for the month. However, by month's end the sea ice had grown above 2007 levels.
For the 2008-09 winter (Dec-Feb) the Northern Hemisphere experienced slightly below average snow cover, and had the 20th lowest snow cover extent on record. The 43-year mean Northern Hemisphere winter snow cover extent for the 1967-2009 period of record is 45.5 million square kilometers (17.6 million square miles).
Across North America, snow cover for the 2008-09 winter was above average, with the 12th largest extent since satellite records began in 1967. The 43-year mean North America winter snow cover extent is 17.1 million square kilometers for the 1967-2009 period of record. A series of large snow and ice storms struck the U.S. during the winter months. The 2008-09 snow season brought numerous daily, monthly, and seasonal snowfall records across the contiguous United States.
Snow cover extent during spring 2009 was the sixth-lowest spring snow cover extent on record. The 43-year average Northern Hemisphere spring snow cover extent for the 1967-2009 period of record is 30.8 million square kilometers (11.9 million square miles).
Across North America, snow cover for spring 2009 was the 17th largest extent since satellite records began in 1967. The average North America spring snow cover extent is 12.9 million square kilometers (5.0 millions square miles) for the 43-year period of record.
In 2009, the contiguous U.S. experienced nearly the same amount of snowfall for the month of October as the month of November. October 2009 ranked as the snowiest such period for the contiguous U.S. with 538,000 square kilometers (207,720 square miles) of snow cover extent, 385,000 square kilometers (148,650 square miles) above the long-term mean. The U.S. in November observed 585,000 square kilometers (225,870 square miles) of snow cover extent, 512,000 square kilometers (197,680 square miles) below the long-term mean. November 2009 ranked as the 6th smallest snow extent since the satellite record began in 1965. Cool temperatures in October and warm temperatures in November contributed to the snow cover extent anomalies across the contiguous United States.
Analysis provided by the Global Snow Laboratory, Rutgers University.
Monthly Tropical Cyclones Report
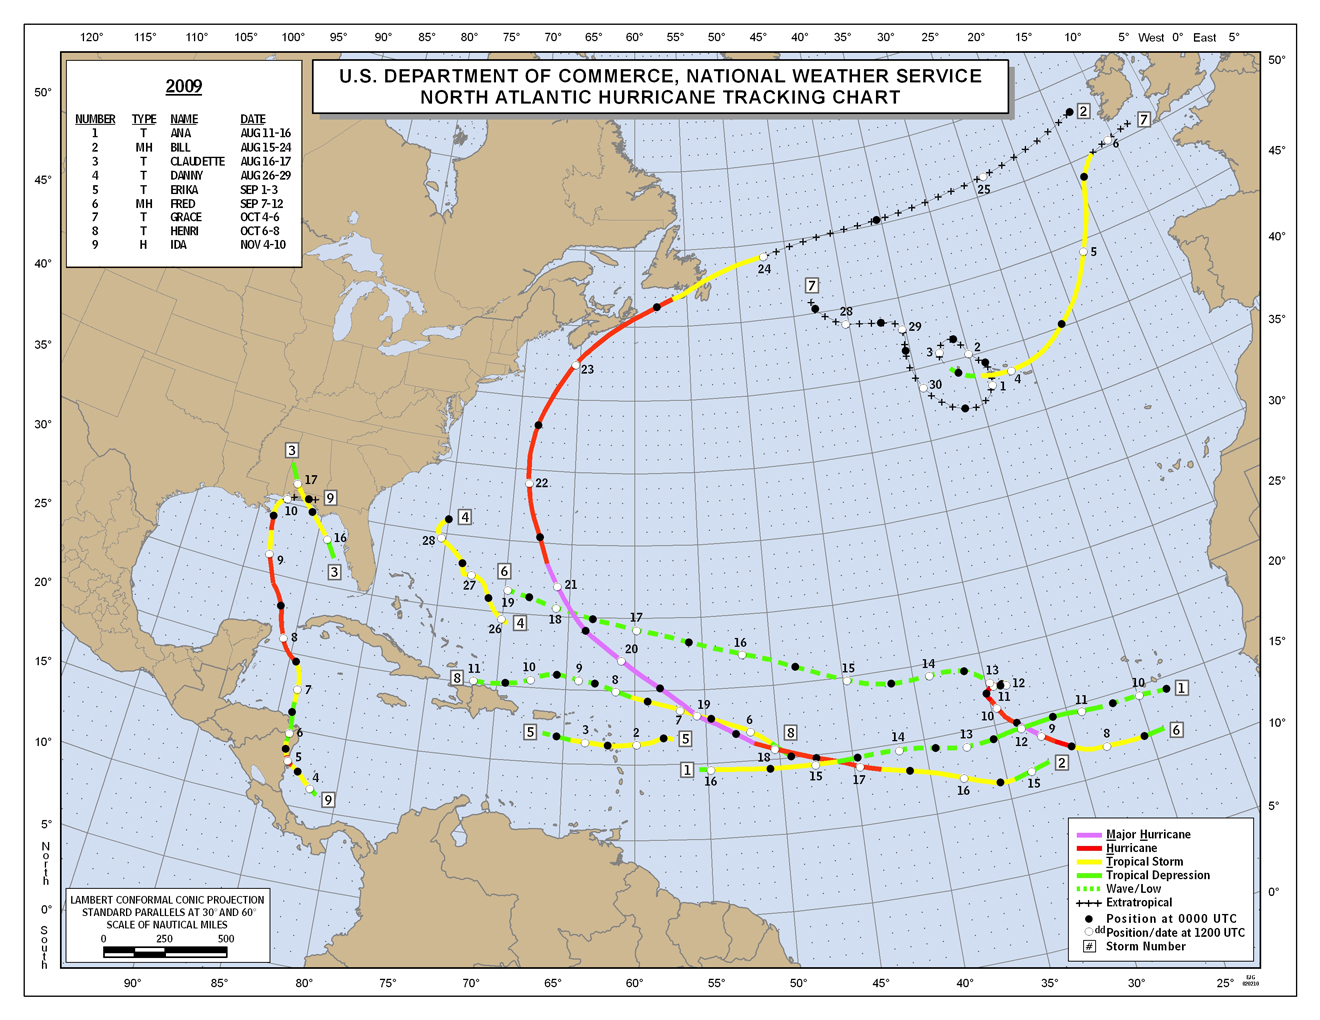
The 2009 North Atlantic hurricane season had nine named storms, three hurricanes, and two major hurricanes. This is the fewest number of hurricanes for a North Atlantic season since 1997. An average season has 11 named storms, six hurricanes, and two major hurricanes. Only two tropical storms and no hurricanes made landfall in the U.S. for the season. This is only the 13th time that no hurricanes have struck the U.S. during a hurricane season (June-November) since 1943.
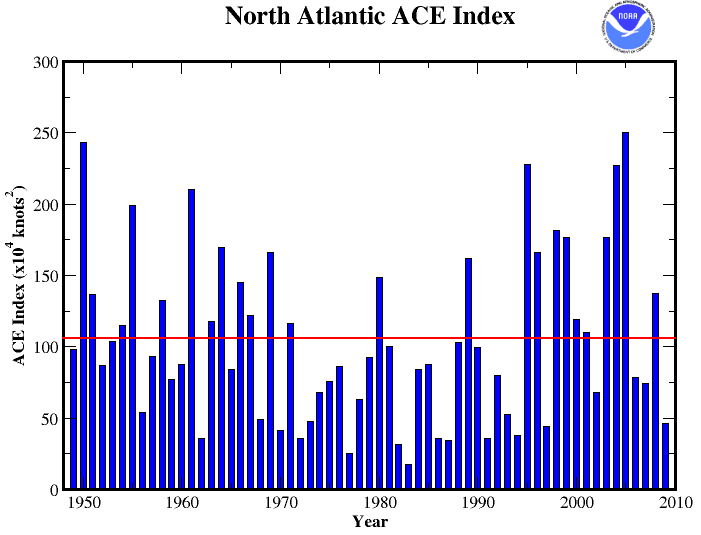
The ACE index of hurricane activity also indicated a below-average season, with a preliminary value of approximately 46x104 knots2. The 1949-2008 ACE average is 106x104 knots2, with 2009 having the 12th lowest ACE since 1949. The below average conditions are attributable to higher than average wind shear and lower than average relative humidity in the middle atmosphere suppressing tropical cyclone development across the basin. These conditions are expected during an El Niño, similar to the one that developed over the course of the 2009 hurricane season. Of the 11 seasons with a lower ACE index, nine occurred during El Niño events.
Monthly Tornadoes Report
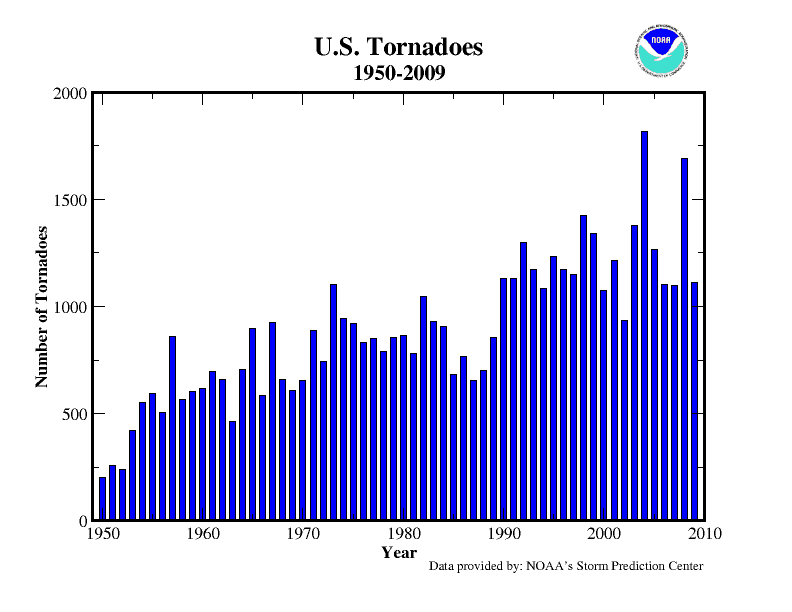
The 2009 tornado count at the end of December was 1,156. June was the most active month of the year with 268 confirmed tornado reports. This ranks 2009 as the 9th quietest month since 1990 and the 5th quietest month this decade. The only months to experience more tornadoes than the past 3-year average was April, June, July, and December.
The highest concentrations of tornado reports were clustered in the Southeast and into the Midwest. The Plains States and “Tornado-Alley” had a relatively calm tornado year relative to their historical records. 2009 was the busiest year of the decade for Louisiana and Alabama in terms of the number of tornadoes, with 82 and 103 tornadoes, respectively. Conversely, Texas and Kansas had their second calmest year of the decade with 108 and 87, tornadoes respectively. According to the SPC, November 2009 had only 4 preliminary tornado reports marking the calmest November since 1980, and the 3rd quietest (tied: 1950,1962,1969) since extensive records began in 1950. November, in the past, has been a fairly active month for parts of the southeastern United States.
NOAA's National Climatic Data Center is the world's largest active archive of weather data. The preliminary temperature and precipitation rankings are available from the center by calling: 828-271-4800.
NOAA works closely with the academic and science communities on climate-related research projects to increase the understanding of El Niño and improve forecasting techniques. NOAA's Climate Prediction Center monitors, analyzes and predicts climate events ranging from weeks to seasons for the nation. NOAA also operates the network of data buoys and satellites that provide vital information about the ocean waters, and initiates research projects to improve future climate forecasts.