National Temperature
|
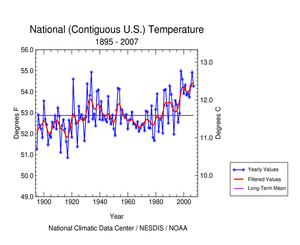
Based on data through the end of the year, 2007 was the 10th warmest year on record for the U.S. with a nationally averaged temperature of 54.2°F (12.4°C). This value is 1.4°F (0.8°C) above the 20th century (1901-2000) mean. |
 |
|
|||||||||||||||||||||||||||||||||
|
The last nine 5-year periods (2003-2007, 2002-2006, 2001-2005,
2000-2004, 1999-2003, 1998-2002, 1997-2001, 1996-2000, and 1995-
1999), were the warmest 5-year periods (i.e. pentads) in the last
113 years of national records, demonstrating the anomalous warmth
of the last decade. The 8th warmest pentad was a tie between
1995-1999 and in the
1930s (1930-34), when the western U.S. was suffering from an
extended
drought coupled with
anomalous warmth. The warmest year on record for the U.S. was
1998, where the record warmth was concentrated in the Northeast
as compared with the Northwest in
1934. For the
year as a whole, much above average temperatures are
concentrated in the western U.S. and in parts of the East. |
 larger image 
larger image 
larger image 
larger image |
Seasonal
Analysis:
The temperature for the 2006-2007 winter season (Dec-Feb) was the 39th warmest such period on record (1896-2007), with warmer than average temperatures along the Eastern Seaboard and the northern tier of states. Winter temperatures were below normal in Texas, New Mexico, Colorado and California. Spring (March-May) temperatures were 8th warmest for the nation, with much above average temperatures across the central and western parts of the contiguous U.S. No states were record warmest or coldest during the spring, although Missouri was third warmest on record during this period. Warm temperatures persisted into the Summer (June-August), as the nation ranked 6th warmest in the last 113 years. Much above average temperatures were spread across much of the West and Rocky Mountain areas, along with Tennessee, Alabama and Florida. Five regions had much warmer than average temperatures, and the West had its third-warmest summer on record. Many locations in the Central and Southeastern U.S. broke records for the most days above 90°F and 100°F during a heat wave in August. Over 70 all-time record high temperatures were set or tied in these drought-plagued areas, breaking records which had stood as long as 83 years. |
|
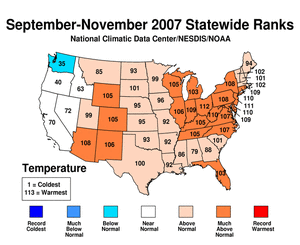
During October, unseasonably warm temperatures affected most of the country and five Northeast states set record warm temperatures for the month. November temperatures were somewhat closer to normal in the East, but warm in the West, where Arizona set a new record high average temperature. The resulting 2007 fall season (September-November) ranked 6th warmest on record. |
|
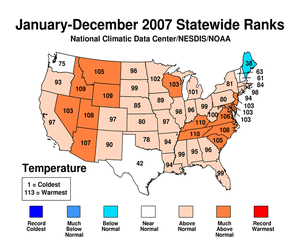
Much warmer than average temperatures affected much of the mountain west and parts of the East during 2007. This was the 10th warmest January-December in the 113-year record. Both Kentucky and Tennessee had the 4th warmest years on record. Forty-three of the lower 48 states were either warmer or much warmer than average in 2007. Maine alone ranked below average during the 2007 year-to-date period. |
 larger image |
 larger image |
Annual temperatures averaged across the state of Alaska during 2007 ranked 15th warmest since 1918. Winter temperatures in 2007 were above average for the 8th consecutive year. Spring was slightly below average, summer was warmer than average, and fall was significantly warmer than the 1918-2000 average. |
|
Wildfires across Alaska were not as widespread as in recent years, with the exception of the Anaktuvuk River wildfire, which set a new record for the largest fire on the North Slope. For additional information on the U.S. wildfire season, please see the Wildfire Season Summary. |
|
The figure below shows the percentage of the contiguous U.S. that was very warm and the percentage that was very cold during each of the past 47 months. During 2007, only one month (July) averaged very cold over nearly 20% or more of the country. |
 larger image |
In contrast, over 20% of the U.S. was very warm in four months of 2007. March was the second warmest on record across the U.S., with over 60% of the U.S. ranked as very warm. Very warm and very cold conditions are defined as the warmest and coldest ten percent of recorded temperatures, respectively. |
|
The anomalous warmth affecting the U.S. in 2007 is also reflected in temperatures in the lower troposphere. Data collected by NOAA's TIROS-N polar-orbiting satellites and adjusted for time-dependent biases by NASA and the Global Hydrology and Climate Center at the University of Alabama in Huntsville indicate that temperatures in the lower half of the atmosphere (lowest 8 km of the atmosphere) over the U.S. were warmer than the 20-year (1979-1998) average for the 10th consecutive year. |
|
With a temperature anomaly of 1.1 °F (0.61°C), the 2007 lower troposheric temperature over the contiguous U.S. ranked as the 4th warmest year since this satellite record began in 1979. |
 larger image |
National Precipitation
|
Precipitation in the United States during 2007 was variable throughout much of the country with periods of excessive rainfall, especially across the central third of the U.S., and persistent and developing drought in the southeastern quarter of the country and the far western states. Winter was relatively wet in the South and North Central regions and relatively dry in the West and Southeast. In the spring, it was the driest March-May on record in the Southeast. The West was ranked 6th driest and the West North Central region had its 3rd wettest spring on record. In summer, the remnants of Tropical Storm Erin brought excessive rain to Texas, Oklahoma and Kansas, giving the South its wettest summer on record. Meanwhile, much of the Southeast continued to suffer in drought with its 11th driest summer on record, following the driest spring. Precipitation across the U.S. during the fall ranked 37th driest, although no regions ranked much above or much below normal. For the contiguous U.S. as a whole, seven months in 2007 were drier than average. Combined with unusually warm temperatures in the Southeast, this exacerbated drought conditions across much of the southeastern quadrant of the country. By August, over 40% of the contiguous U.S. was in moderate to extreme drought, as reported by the U.S. Drought Monitor. Increased October precipitation helped decrease this percentage to near 30% by the end of November. Despite above-average precipitation again in December, U.S. precipitation in 2007 was below the long-term mean, ranking as the 47th driest year on record. The average annual precipitation was 28.9 inches (733 mm), which is 0.3 inches (7 mm) below the 20th century (1901-2000) average. |
 larger image |
 larger image |
|
Below average precipitation occurred across portions of the western and southeastern states during the winter. Several states in the middle of the country, including Nebraska and Kansas, had much above normal winter precipitation. A dry winter exacerbated the drought conditions across the Southwest and foreshadowed the upcoming dry year in the Tennessee Valley region. The West Coast, Southeast and southern Mississippi valley states were exceptionally dry during the spring, whereas much of the central corridor of the country had much above normal precipitation. Both Mississippi and Georgia had their driest springs on record, and Alabama and Tennessee had their second driest. In contrast, both North Dakota and Nebraska had their third wettest springs on record. Summer precipitation across the southern plains was much above average, with both Oklahoma and Texas record wettest, partially due to the remnants of Tropical Storm Erin in August. Flooding was widespread across portions of central Oklahoma after the storm brought seven to eleven inches of rain in some places along with wind gusts as high as 82 mph (132 km/hr) in this land-locked state. In the Southeast, continuing rainfall deficits across this region were not helped by a relative lack of tropical activity in this area. Precipitation received during the fall was below average across the nation. Only the Northeast Climate Region had more precipitation than normal this season. Above normal precipitation across much of Alabama, Kentucky and western Tennessee in late October helped relieve some of the Moderate to Exceptional Drought conditions in these areas. Exceptional drought continued to affect parts of Alabama, Georgia, Tennessee, the Carolinas and a tiny portion of western Virginia by the beginning of December. |
 larger image 
larger image 
larger image 
larger image 
larger image |
|
2007 precipitation (see map above right) ranked North Carolina the driest and Tennessee the 2nd driest on record. In fact, this was the 2nd driest such period for the Southeast and the third driest for the West. Conversely, only five states and no climate regions received much above normal rainfall in 2007. |
 larger image
 |
 larger image
 |
 larger image |
The adjacent figure shows the percent of the contiguous U.S. that was very wet and the percent that was very dry during each of the past 48 months. During 2007, more than a tenth of the country was very dry during January, March, May, August and November. |
|
Nearly 20% of the contiguous U.S. was very wet in March, and over 10% of the U.S. was also very wet during January, May, July, August, October and December. Very wet and very dry conditions are defined as the wettest and driest ten percent of recorded precipitation values, respectively. |
Severe Storms
|
According to NOAA's Storm Prediction Center, preliminary estimates indicate that there have been nearly 1300 reported tornadoes from January- December 2007, which is slightly above the ten-year average and well above the 30-year average. Note that these numbers represent preliminary tornado reports and not the number of total tornadoes. |
 larger image
 |
|
Spring in the central and southern parts of the country was punctuated by several severe weather outbreaks producing over 600 reported tornadoes and leading to nearly 50 deaths during March through May 2007. The first large tornado outbreak occurred on February 24, when 21 tornadoes were reported, mostly in Louisiana, Arkansas, and Mississippi. The next outbreak less than a week later, when over 70 tornadoes were reported across the Gulf Coast region, Missouri, Illinois and South Carolina on March 1. Later that month, 80 reported tornadoes occurred across the western Great Plains from Texas to Nebraska on the 28th. The next large outbreak occurred on May 5, when 111 tornadoes were reported from the Texas panhandle through Iowa, Nebraska, and South Dakota. |
 larger image - Greensburg, KS tornado damage
 |
The most devastating tornado of 2007 was the EF5 tornado that hit Greensburg, Kansas shortly before 10 pm CDT on the night of Friday, May 4, 2007. The tornado, given the rating of five on the Enhanced Fujita scale, was the first to receive the EF5 classification and the first tornado to earn a 5-rating since the May 3, 1999 Moore/ Oklahoma City, OK tornado. At least ten fatalities were reported from this devastating storm, which damaged or destroyed an estimated 95% of the town of Greensburg. The tornado was on the ground for 22 miles (35.4 km) and had a maximum path width of 1.7 miles (2.7 km), moving north-northeast until it turned northward upon reaching Greensburg and later curved back to the west. Despite the tornado's strength, the 32-minute warning lead time given by the Dodge City NWS office and the quick reaction of the people of Greensburg kept the number of fatalities in the town of over 1600 persons down to a minimum. |
 larger image - Greensburg, KS Tornado Path
 |
Atlantic Hurricanes
The 2007 Atlantic basin hurricane season was below the 1950-2000 average with 15 named storms, of which 6 were hurricanes, including 2 major hurricanes. The ACE index of hurricane activity indicates a somewhat below-average season, with a preliminary value of approximately 68 x104 knots2. An average season is anywhere from 66 x 104 knots2 to 103 x 104 knots2. The relatively less active season in 2007 was attributed in part to a large Bermuda high, which acted to suppress conditions conducive to hurricanes in the western Atlantic. |
|
The first storm of the official 2007 Atlantic hurricane season was Subtropical Storm Andrea, which developed off the southeastern coast of the U.S. on May 9th. Hurricane Dean became the first major hurricane of the Atlantic season in mid-August and made landfall as a Category 5 storm on August 21 on the Yucatán Peninsula of Mexico. Olga was the last named storm during the 2007 season. Olga transformed from a sub-tropical storm into a tropical cyclone on December 11th before it made landfall along the eastern coast of the Dominican Republic that evening. At least 24 people lost their lives to Olga in the Caribbean, mostly from flash floods, before it dissipated on December 13. |
 larger image
 larger image
 |
|
Three tropical depressions (Barry, Erin, TD 10), one tropical storm (Gabrielle), and a weak hurricane (Humberto) made landfall with the mainland U.S. during 2007. Tropical Depression Barry and TD 10 made landfall in Florida, Erin and Humberto in Texas, and Gabrielle moved across the Outer Banks of North Carolina. More details about these and all the 2007 Atlantic tropical systems can be found on NCDC's Atlantic hurricane page. |
Snow Season
 Data courtesy of Rutgers University
Global Snow Lab |
Generally near to above average snowfall blanketed the Northern Cascades, Big Horn Mountains in Wyoming, and the Colorado Front Range during the 2006-2007 snow season, while the Sierra Nevada, Wasatch (UT), and the mountains of Arizona suffered from well below average accumulations. Slightly above average snow accumulations covered the North American continent as a whole over the winter, with a well below average snowpack in the spring, consistent with a recent trend towards reduced spring snow cover for North America as shown in the adjacent image. |
|
Several notable winter storms affected the continental U.S. in 2007. The first great ice storm that occurred January 11-16 paralyzed areas from the Rio Grande Valley to New England and southeastern Canada. Two subsequent storms affected the southern U.S. and later the southern Plains and mid-Atlantic states. The ice left hundreds of thousands of residents without power, resulted in at least 85 deaths across 12 states and three Canadian provinces, and caused numerous flight cancellations out of busy airports such as Dallas-Ft. Worth. Up to two inches of ice and additional layers of sleet and snow accumulated in some areas during the first storm. Record-breaking cold temperatures followed these storms in many western states. |
 |
|
In mid-February, a large snow storm reaching from the Mid-Mississippi Valley into the Mid-Atlantic and New England areas brought from four to twenty inches of snow across much of the Central U.S. and up to thirty inches of snow in parts of eastern New York and northern Vermont. The Northeast Snowfall Impact Scale (NESIS) classified this as a Category 3 (major) storm and ranked it as the 14th most intense snow storm on record for the Northeast. See map of event below left. |
 larger image
 |
A few weeks later, two winter storms struck the Upper Midwest in late February and early March, bringing heavy and record-breaking amounts of snowfall in some areas from February 23 to March 2. More details of these and other snow and ice events are available in the annual summary of significant events. |
|
A Category 2 (significant) St. Patrick's Day winter storm caused travel problems across parts of the Northeast on the 16th and 17th. More than 1000 flights were cancelled in New York City as more than 5 inches of snow fell in Central Park. Eight inches fell in Frostburg, Maryland and up to 2 feet of snow accumulated in the northern Catskills of New York. Farther to the south, freezing rain and ice accumulated from northern Virginia throughout much of Pennsylvania and into parts of southern New York, making driving conditions hazardous. |
 larger image
 |
|
Well below normal snowfall amounts fell over much of the West in the first several months of 2007. Near the end of spring, few areas had above average snowpack, while accumulations less than 50% of average were widespread from Oregon to the Southwest. See map of May 1 snowpack below left. Many western states rely on melting mountain snowpack for municipal and agricultural water supplies, and the below-average conditions left many areas with far less than the snow required to replenish reservoirs. |
 larger image
 |
The 2007-2008 snow season began with above average snowfall across parts of the Southwest and well-below-normal amounts in the Sierra Nevadas, Cascades, and the Bear River (ID, UT) and Salt River Ranges. A major ice storm hit parts of the south-central U.S. in the second week of December, leaving over 600,000 residents in Oklahoma without power and causing 27 fatalities across five states. Several back-to-back midlatitude cyclones brought significant snowfall from the Great Plains through New England in mid- and late December. |
NOAA's National Climatic Data Center is the world's largest active archive of weather data. The preliminary temperature and precipitation rankings are available from the center by calling: 828-271-4800. NOAA works closely with the academic and science communities on climate-related research projects to increase the understanding of El Niño and improve forecasting techniques. NOAA's Climate Prediction Center monitors, analyzes and predicts climate events ranging from weeks to seasons for the nation. NOAA also operates the network of data buoys and satellites that provide vital information about the ocean waters, and initiates research projects to improve future climate forecasts. |
 NOAA's National Centers for Environmental Information