 |
Contents of This Report:

The North American 500 mb Maps for March
| The mean upper-air pattern during March was generally characterized by positive height anomalies over the western United States which were associated with above normal surface temperatures. A series of upper-level troughs moved across the eastern part of the nation bringing below normal temperatures to the eastern third of the country. Several storms brought heavy rainfall to areas of the Southeast, most notably drought-stricken Florida. Record snows blanketed some areas of the Northeast.
Additional information on hydrometeorological analysis and forecasting can be found at the Hydrometeorological Prediction Center's Web Page. The principles behind the 500 mb flow are briefly explained here. |
 animation |
 National Temperature - March
| larger image |
The graph to the left shows March monthly mean temperature averaged across the contiguous United States based on long-term data from the U.S. Historical Climatology Network (USHCN). The 2001 value is estimated from preliminary Climate Division data using the first difference approach. March 2001 ranked near the middle of the historical distribution. The preliminary nationally averaged temperature for March 2001 was 42.4° F (5.8° C) which equalled the long-term mean. Thirteen of the previous seventeen Marches have been above the long-term mean. The actual March temperature values from 1895 through 2001 are available. |
| Data collected by NOAA's TIROS-N polar-orbiting satellites and adjusted for time-dependent biases by NASA and the Global Hydrology and Climate Center at the University of Alabama in Huntsville indicate that temperatures in the lower half of the atmosphere (lowest 8 km) were the second coldest since 1979 over the U.S. for March 2001. The average lower tropospheric temperature over the continental U.S. was -1.17° C (-2.10° F) below the 1979-1998 mean. This contrasts sharply with the previous two Marches which have been above the mean. |  larger image |
| The map to the right, based on approximately 250 airport stations, shows departures from the 1961-1990 normal temperatures for March 2001. In general, most of the nation east of a line from South Dakota south through Texas was cooler than normal. Areas west of this line were generally warmer than normal, especially in the West region. A map of day-to-day temperature variability is available.
The southern third of Alaska was warmer than normal with the rest of Alaska, Hawaii and Puerto Rico reporting near normal temperatures. For further regional analysis, view NCDC's regional page. |
 larger image |
 larger image |
The standardized temperature anomalies for March 2001 were above normal west of a line from Montana south to western New Mexico. From Texas to the Northeast below normal anomalies were prevalent. Below normal indices also occurred in eastern South Dakota, northern Iowa and southern Wisconsin. The month averaged near normal across most of the rest of the country. The adjacent animated map shows the geographical pattern of temperature anomalies for the last 12 months compared to a base period of 1931-1990. For further regional analysis, view NCDC's regional page. |
National Precipitation - March
 larger image |
Based upon preliminary precipitation data, March 2001 ranked as the forty-first wettest such month since records began in 1895. Eight of the last thirteen Marches have been near or above the long-term mean.
The preliminary National Precipitation Index ranked March 2001 as the fiftieth wettest March. Fourteen of the last twenty Marches have had positive index values. |
| The map to the right, based on approximately 250 airport stations, shows March 2001 total precipitation as a percent of the 1961-1990 station normals. Above normal precipitation generally occurred from southern Colorado southeastward through Texas then along the coastal states eastward through Florida then north to southern Maine. Some areas of southern coastal California as well as southern Alaska were also wetter than normal. Below normal precipitation occurred over much of the rest of the country including Hawaii and Puerto Rico. A ridge of high pressure over western sections of the country was associated with generally dry conditions while the Gulf and Atlantic coast states experienced wetter than normal conditions. For further regional analysis, view NCDC's regional page. |  larger image |
 larger image |
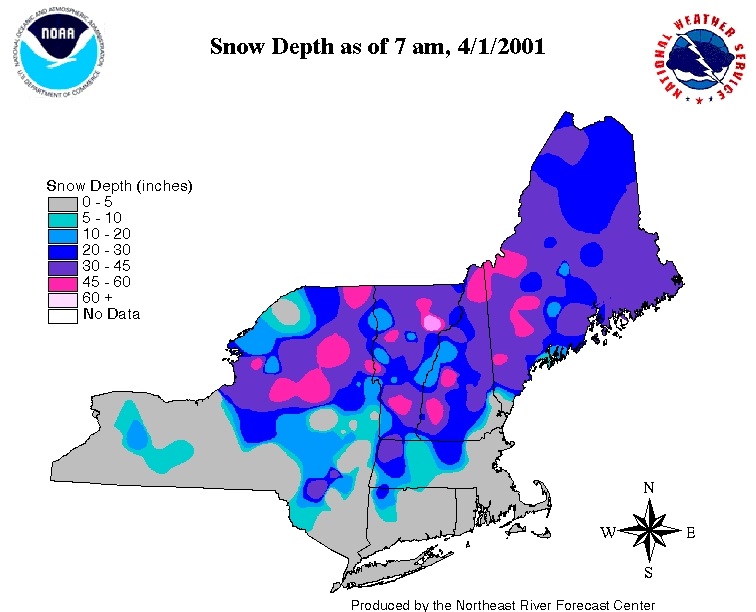
Snow cover duration for March 2001, as observed by satellite, exceeded the 1992-2001 average over a large portion of the northern tier states. A snow depth analysis by the U.S. Air Force reveals an extensive snow cover remaining over central and eastern Canada. |
|
The month started with an extensive snow cover across the central U.S. A couple of mid-month snowstorms dumped heavy snow from the central to northern Plains during the 12th-13th and 16th-18th. The snow cover quickly retreated as temperatures warmed later in the month, but areas of deep snow cover remained in the northern Plains and Northeast. Although snow cover extent in the northern and central Rockies (as shown in the extent and duration map above) was above the 1992-2001 average, snow depth as indicated by mountain snowpack was well below the long-term average across most of the West and the water content of the snow cover was below normal in most river basins. This has raised concerns over spring and summer water supplies, which are heavily dependent on the mountain snowpack accumulated during the winter months. Portions of the northern Plains and upper Great Lakes states remained snow covered throughout the month. Snow depth at the end of March ranged from one to one and a half feet (30 to 45 cm) in northern Minnesota to nearly three feet (90 cm) in the snow belt of Upper Michigan. Records for snow cover duration were set in South Dakota, with Aberdeen logging 144 days with consecutive snow cover (of 1 inch or more) ending on April 1 and Sioux Falls 141 days as of March 27th. Much of the Northeast remained snow covered throughout the month. Snow depth at the end of March in parts of the region ranged from one foot (30 cm) to well over three feet (90 cm). The snow cover was maintained by cold temperatures and a series of storms that swept across the area, including storms on the 6th-7th, 23rd, and 30th-31st. Record and near-record seasonal snowfall totals occurred at many stations, including:
|
Current data are based on preliminary reports from River Forecast Center stations and First and Second Order airport stations obtained from the National Weather Service (NWS) Climate Prediction Center and real time Global Telecommunications System (GTS) monthly CLIMAT summaries. THE CURRENT DATA SHOULD BE USED WITH CAUTION. These preliminary data are useful for estimating how current anomalies compare to the historical record, however the actual values and rankings for the current year may change as the final data arrive at NCDC and are processed.
The following NCDC datasets are used for the historical U.S. data: the climate division drought database (TD-9640), and the hurricane datasets (TD-9636 and TD-9697). It should be noted that the climate division drought database consists of monthly data for 344 climate divisions in the contiguous United States. These divisional values are calculated from the 6000+ station Cooperative Observer network.