 |
Contents of This Report:
- North American 500 mb Maps
- August National Temperature
- August National Precipitation
- January-August National Temperature
- January-August National Precipitation

The North American 500 mb Maps for August
The upper-air pattern during August consisted of a trough along the Pacific coast, dominant high pressure from the central Rockies to the Mississippi River and a trough over the eastern third of the country.
The Pacific coast trough provided slightly above normal temperatures for the coastal states although coastal stations were cooler than normal. The mean upper-level ridge over the West provided much warmer than normal conditions for the central and eastern Rockies as well as the central Plains and western Gulf states. At the same time, prevalent troughiness from the mid-Mississippi Valley through the Northeast allowed for much cooler than normal temperatures, especially for the central Appalachians, and the mid-Atlantic region.
| Due to the eastern trough, near normal precipitation was noted from the western Great Lakes through the Ohio Valley and from Georgia to southern New England. The mid-continent ridge provided dry conditions from the Pacific Northwest, through the inter-mountain West, and from the central Plains, south to Texas and eastward to Florida. The Pacific coastal trough provided wetter than normal conditions for the Great Basin, the extreme Southwest, and California. | 
|
|
Additional information on hydrometeorological analysis and forecasting can be found at the Hydrometeorological Prediction Center's Web Page. The principles behind the 500 mb flow are briefly explained here. | |
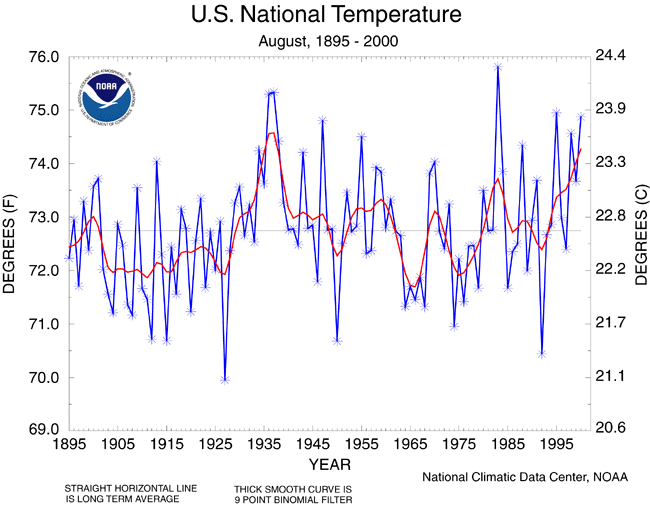
 National Temperature - August
larger image |
The August 2000 monthly mean temperature averaged across the contiguous United States, based on data from the U.S. Historical Climate Network (USHCN) and preliminary data from the Climate Division Database, ranked as the fifth warmest August since records began in 1895. The preliminary nationally averaged temperature for August 2000 was 74.9° F, 2.1° F above the long-term mean. The actual August temperature values from 1895 through 2000 are available. |
| The map to the right, based on approximately 250 airport stations, shows departures from the 1961-1990 normal temperatures for August 2000. In general, the Pacific Coast and areas of the eastern Great Lakes, mid-Atlantic and Northeast were cooler than normal. The Tennessee Valley, Gulf Coast, and the Rocky Mountain region were warmer than normal while the central and southern Plains were much warmer than normal. Most of the interior and northern Alaska stations were cooler than normal while most of the southern coastal sites were near normal. The Hawaiian stations averaged about normal. | 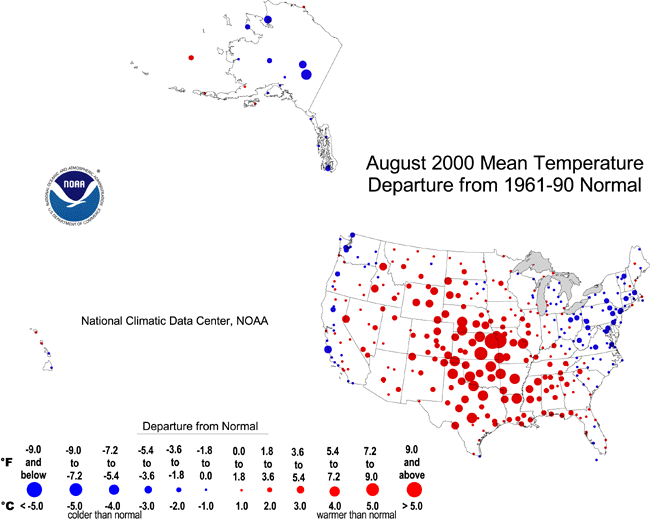 larger image |
 larger image |
Extreme maximum temperatures during August 2000 exceeded 115° F through the interior valley of southern California. Temperatures exceeded 105° F over most of southern Arizona, extreme southern Nevada and interior southern California. Extreme maximum temperatures also exceeded 105° F from central Texas eastward to central Alabama and from southeastern Texas, northward into extreme southern Nebraska. Maximum temperatures failed to exceed 90° F in the highest elevations of the inter-mountain West, portions of the Pacific Coast, and from the western Great Lakes south through the central Appalachians, the interior mid-Atlantic region, and Northeast. Approximately 700 ASOS stations were used in this analysis. |
| The number of days with high temperatures in excess of 90° F exceeded the normal number of days of greater than 90° F for August in a wide swath from central Florida, northwestward to the central Rockies. Within this band, the departures exceeded the normal by at least twelve days in portions of the Texas panhandle, eastern Kansas and the Nebraska panhandle. The number of days with high temperatures in excess of 90° F failed to exceed the normal from eastern North Dakota, southeastward through South Carolina and northward. Portions of the Southwest, the San Franciso Bay area, and the Pacific Northwest also failed to exceed the normal of 90° F days during August. |  larger image |
 animation |
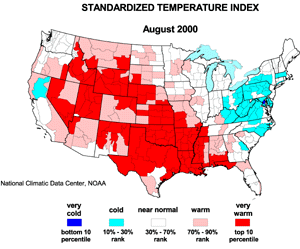
The standardized temperature anomalies for August 2000 show abnormal warmth from the central Rockies southeastward to the central Gulf Coast. Cooler than normal conditions are depicted in the eastern Great Lakes states, the central Appalachians, and from North Carolina to southern New England. Parts of interior California were also much cooler than normal. This compares well with other temperature indicators. The map animation provided shows the geographical pattern of temperature anomalies for the last 12 months compared to a base period of 1931-1990. |
National Precipitation - August
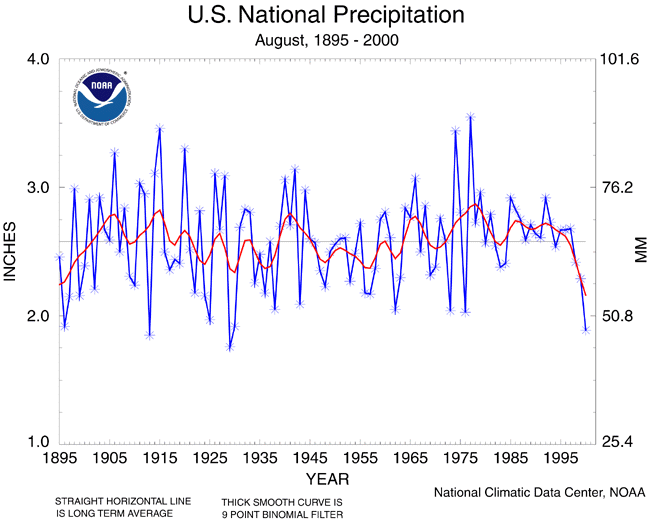 larger image |
Based upon preliminary precipitation data, August 2000 ranked as the third driest such month since records began in 1895. This was the first August with much below normal precipitation since 1976. |
| The preliminary national standardized precipitation index ranked August 2000 as the second driest August since records began. |  larger image |
| The map to the right, based on approximately 250 airport stations, shows August 2000 total precipitation as a departure from 1961-1990 station normals. Above-normal precipitation can be found in all of Alaska except for the south central portion. The Hawaiian stations averaged slightly wetter than normal. On the mainland U.S., stations were predominantly wetter than normal in the Great Basin, portions of the mid-Mississippi Valley and the mid-Atlantic coastal region. Stations were drier than normal along the Pacific Coast, the Northwest, the northern Rockies, as well as the central and southern Plains and much of the Southeast. |  larger image |
National Temperature - January-August 2000
 larger image |
The January-August 2000 mean temperature averaged across the contiguous United States, based on data from the U.S. Historical Climate Network (USHCN) and preliminary data from the Climate Division Database, ranked as the warmest such eight-month period since records began 1895. The preliminary nationally averaged temperature for January-August 2000 was 57.3° F, 2.7° F above the long-term mean. The last three such year-to-date periods have averaged much above the long term mean. The actual year-to-date data values from 1895 through 2000 are available. |
| Data collected by NOAA's TIROS-N polar-orbiting satellites and adjusted for time-dependent biases by NASA and the Global Hydrology and Climate Center at the University of Alabama in Huntsville indicate that temperatures in the lower half of the atmosphere (lowest 8 km) were the warmest on record over the U.S. for the year-to-date period (January -August). The average lower tropospheric temperature over the continental U.S. during the January-August 2000 period was 1.50° F above the 1979-1998 long-term mean. |  larger image |
National Precipitation - January-August 2000
 larger image |
Based upon preliminary precipitation data, January-August 2000 ranked as the 23rd driest such eight-month period since records began in 1895. About 15% of the country was much drier than normal while about six percent of the country was much wetter than normal. January-August 2000 is the first such period in eleven years to average below the long-term mean. |
| The preliminary national standardized precipitation index ranked January-August 2000 as the 24th driest such eight-month period since records began in 1895. |  larger image |
Current data are based on preliminary reports from River Forecast Center stations and First and Second Order airport stations obtained from the National Weather Service (NWS) Climate Prediction Center and real time Global Telecommunications System (GTS) monthly CLIMAT summaries. THE CURRENT DATA SHOULD BE USED WITH CAUTION. These preliminary data are useful for estimating how current anomalies compare to the historical record, however the actual values and rankings for the current year may change as the final data arrive at NCDC and are processed.
The following NCDC datasets are used for the historical U.S. data: the climate division drought database (TD-9640), and the hurricane datasets (TD-9636 and TD-9697). It should be noted that the climate division drought database consists of monthly data for 344 climate divisions in the contiguous United States. These divisional values are calculated from the 6000+ station Cooperative Observer network.