 |
The North American 500 mb Maps for May
The upper-air pattern remained active during May especially along the U.S. - Canadian border. Several deep, storm-producing troughs crossing the country from west to east, created numerous boughts of severe weather for the central plains to the Atlantic coast.
A mean upper-level ridge dominated the country with a weak trough over the northern plains states. This ridge provided much warmer than normal temperatures from coast to coast with only the Pacific Northwest and New England having near normal temperatures for the month.
| The active northerly storm track allowed numerous frontal passages and low pressure systems to provide abundant moisture from the northern plains eastward through the northeast. The trailing cool fronts from these low pressure systems triggered scattered convection and severe weather from the western plains to the Atlantic coast. The accompanying moisture was not enough to prevent overall dryness from the southwest through the Carolinas. Within this region, only Arkansas was wetter than normal. |  animation |
Additional information on hydrometeorological analysis and forecasting can be found at the Hydrometeorological Prediction Center's Web Page. The principles behind the 500 mb flow are briefly explained Here.

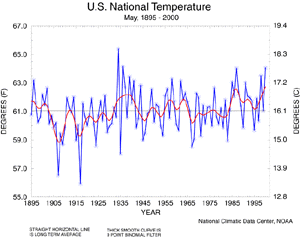
 National Temperature - May
| The May 2000 monthly mean temperature averaged across the contiguous United States, based on preliminary data for the U.S. Historical Climate Network (USHCN), was warmer than normal and ranked as the third warmest May since 1895. Over 35% of the country was much warmer than normal while less than one percent of the country was much cooler than normal. The actual May temperature values from 1895 through 2000 are available. |  larger image |
 larger image |
The preliminary national standardized temperature index ranked May 2000 as the second warmest May since 1895. |
| The map to the right, based on approximately 250 airport stations, shows departures from the 1961-1990 normal temperatures for May 2000. Most of the country from the central California coast, to the central Great Lakes, to the mid-Atlantic region averaged above normal. The northern Rockies, northern Great Plains, and New England were near normal. Most of the interior and northern Alaskan stations were cooler than normal, with the greatest departures in the northern part of the state. Most of the southern coastal sites were near normal. The Hawaiian stations averaged only slightly above normal. |  larger image |
 larger image |
Extreme maximum temperatures during May 2000 exceeded 100° F through a good portion of the southwest as well as the interior valley of northern California, parts of eastern Colorado, southeastern Utah, western Kansas and extreme southwestern Nebraska. Pockets of 100° F and above were also noted in central South Carolina and the tri-state area of Georgia, Florida, and Alabama. Temperatures in excess of 110° F were noted in southern interior California as well as the upper Red River Valley of Texas. Maximum temperatures failed to exceed 70° F in interior western Washington as well as the northern Bitterroots of Idaho. |
| Daily high temperatures in excess of 90° F exceeded the average number of days of greater than 90° F for May in a large area from the Great Basin to the Central Plains, to the South Atlantic Coast, then north to Boston. Within this area, the departure exceeded the average by at least eight days in western Texas, eastern New Mexico, southern Louisiana, and the tri-state area of Alabama, Florida, and Georgia. |  larger image |
 animation |
The standardized temperature anomalies for May 2000 show the warmth from coast to coast seen in the plots of the other temperature indicators. The map animation provided to the left shows the geographical pattern of temperature anomalies for the last 12 months, compared to a base period of 1931-1990. |
| Data provided by scientists at NASA and the Global Hydrology and Climate Center at the University of Alabama in Huntsville also indicated the presence of extremely warm temperatures in the lower half of the atmosphere (lowest 8km or 26,200 feet of the atmosphere) over the U.S. The Microwave Sounding Unit (MSU) on-board NOAA�s TIROS-N polar-orbiting satellite measured record warm temperatures during the May, spring, and January through May (year-to-date) periods. The average lower tropospheric temperature over the continental U.S. was 3.53 degrees F above the 1979-1998 long-term mean in May, 1.49 degrees F warmer than the previous record from May 1996. |  larger image |
National Precipitation - May
 larger image |
Based upon preliminary precipitation data, May 2000 ranked as the 29th driest such month since 1895. About 22% of the country was much drier than normal while about five percent of the country was much wetter than normal. |
| The preliminary national standardized precipitation index ranked May 2000 as the 20th driest May since 1895. |  larger image |
| The map to the right, based on approximately 250 airport stations, shows May 2000 total precipitation as a departure from 1961-1990 station normals. Above-normal precipitation can be found in the Aleutians and the extreme north of Alaska, while most of the other Alaskan stations, as well as the Hawaiian stations, were drier than normal. On the mainland U.S., stations were predominantly wetter than normal from the Northeast to the northern Great Plains, with pockets of above normal precipitation in eastern Texas, the Great Basin, and the central and northern Pacific coast. Stations were drier than normal across all of the Southeast, the mid-Atlantic region, the central and southern plains, and the Southwest. |  larger image |
Long-term drought areal coverage (as measured by the Palmer Drought Index) increased when compared to April, with about 23% of the country in severe to extreme drought during May. Several droughts in the past hundred years have covered a much larger area for a much longer time (see graph below right). The May 2000 drought is about 60% of the magnitude of the 1988 drought at its peak. The percent area of the country experiencing severe to extreme wetness dropped steadily from 23% in August 1999 to roughly four percent at the end of May. Additional drought coverage is provided.
 larger image |
 larger image |
Tornadoes - May and Year-to-date
 larger image |
During May 2000, 217 tornadoes were documented across the contiguous United States. The 46-year average is 185. The most tornadoes observed in the May record was 391 in May 1995, while 68 tornadoes were observed in May 1958. |
| For the year-to-date, January-May 2000, 457 tornadoes were documented across the contiguous United States. The 46-year average for the five-month period is 394. The most tornadoes observed in the January-May record was 767 in 1999, while 190 tornadoes were observed in the January-May period during 1958. |  larger image |
It should be pointed out that the preliminary tornado count is traditionally higher than the final count and that the tornado observations have generally improved over the years as better observing practices and instrumentation (especially weather radar and satellites) were utilized.
National Temperature - January-May 2000
| The January-May 2000 mean temperature averaged across the contiguous United States, based on preliminary data for the U.S. Historical Climate Network (USHCN), ranked as the warmest such five-month period since 1895. Over 76% of the country was much warmer than normal while less than one percent of the country was much cooler than normal. The actual year-to-date data values from 1895 through 2000 are available. The persistent warmth of the last eleven months has resulted in record warm ranks for several combinations of months ending in May 2000. These include each of the eleven periods from April-May 2000, March-May 2000, back to June 1999-May 2000. A few examples are illustrated in the table below. |  larger image |
| Warmest Period | Value (F) | 2nd Warmest Period | Value (F) |
|---|---|---|---|
| June 1999-May 2000 | 55.7° | June 1998-May 1999 | 55.3° |
| October 1999-May 2000 | 48.1° | October 1998-May 1999 | 46.8° |
| January-May 2000 | 48.5° | January-May 1986 | 47.4° |
 larger image |
The preliminary national standardized temperature index ranked January-May 2000 as the warmest January-May since 1895. The smoothed temperature value for the January-May period has been above the long-term mean since 1983. |
National Precipitation - January-May 2000
 larger image |
Based upon preliminary precipitation data, January-May 2000 ranked as the 35th driest such period since 1895. About nine percent of the country was much drier than normal while about five percent of the country was much wetter than normal. January-May 2000 is the first such period in six years to average below the long-term mean. |
| The preliminary national standardized precipitation index ranked January-May 2000 near the long-term mean. |  larger image |
Current data are based on preliminary reports from River Forecast Center stations and First and Second Order airport stations obtained from the National Weather Service (NWS) Climate Prediction Center and real time Global Telecommunications System (GTS) monthly CLIMAT summaries. THE CURRENT DATA SHOULD BE USED WITH CAUTION. These preliminary data are useful for estimating how current anomalies compare to the historical record, however the actual values and rankings for the current year may change as the final data arrive at NCDC and are processed.
The following NCDC datasets are used for the historical U.S. data: the climate division drought database (TD-9640), and the hurricane datasets (TD-9636 and TD-9697). It should be noted that the climate division drought database consists of monthly data for 344 climate divisions in the contiguous United States. These divisional values are calculated from the 6000+ station Cooperative Observer network.