 |
National Temperature - Winter
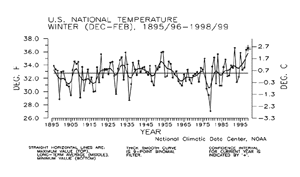
Preliminary data for Winter (December-February) 1998-1999 indicate temperatures averaged across the contiguous United States were much above the long-term mean ranking as the second warmest such season since 1895. The warmest Winter season on record was December 1991-February 1992. Over 53% of the country was much warmer than normal while about one percent of the country was much cooler than normal. A Pacific zonal flow pattern (west to east) highlighted the season and prevented all but a few episodes of much-cooler than normal temperatures. The last five winters have been above- to much-above the long-term mean.The national temperature index expresses temperature departure from the 60-year mean in terms of standard deviations. Each year's value is computed by standardizing the temperature for each of 344 climate divisions in the U.S. by using their 1931-90 mean and standard deviation, then weighting these divisional values by area.
| These area-weighted values are then normalized over the period of record. Positive values are warmer and negative values are cooler than the mean. The preliminary national standardized temperature index ranked Winter 1998-99 as the second warmest such season since records began in 1895. | 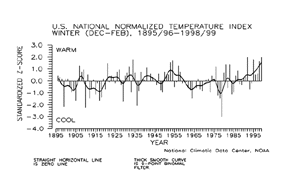 |

 Temperature Variability
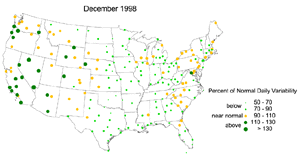
A reflection of the dominant zonal flow pattern across the United States during the Northern Hemisphere winter might be seen in a measure of the day-to-day variability of temperature. Generally during winter there is a more frequent exchange of distinct air masses across most of the United States, which leads to a larger average daily difference in temperature (yesterday's mean temperature minus today's mean temperature) than during other times of the year. The daily difference in temperature may be lower in areas where a single air mass remains dominant. This can happen under a stable circulation pattern (at the jet stream level) that locks an air mass in place--for example, a strong zonal flow, or a stable ridge/trough pattern. The daily difference in temperature will be higher in areas that experience a greater frequency of frontal passages as cold arctic air moves southward and warmer, maritime air moves northward. This will happen under a variable circulation pattern, or along a stable storm track.
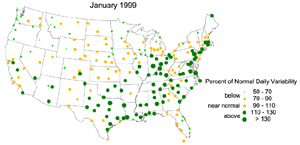
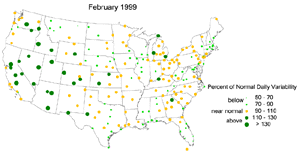
To quantify the variability in daily temperature, the average daily differences in temperature for the winter months of December, January and February 1998-99 have been expressed as a ratio of the normal (1961-90) average daily difference. The magnitude of this ratio is expressed by the size and color of the dot representing the value at each of approximately 250 First Order airport stations across the United States. Small dots indicate that daily variability in temperature was less than normal, and may be a consequence of a dominant air mass. Large dots indicate that daily temperature variability was greater than normal reflecting a more frequent passage of differing air masses.
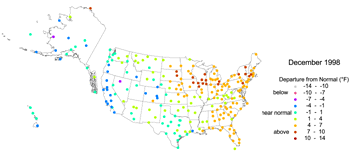
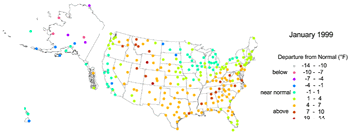
For example, in December, much of the central United States experienced much lower than normal temperature variability that may be attributed to a lower frequency of air mass migration across this region, a consequence of the persistent zonal flow pattern. The lack of cool, arctic air masses resulted in the warm temperature anomalies seen east of the Rockies. In contrast, higher variability and cooler temperature departures occurred in the West.
 |
 |
In January, a swath from the Texas Gulf Coast to the Ohio Valley and into New England experienced higher than normal temperature variability. This may be also a consequence of persistence since this was the predominant storm track during the month, and coincides with above average precipitation throughout the region.
 |
 |
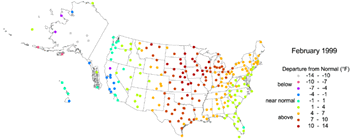
In February, there was a noticeable contrast from west to east across the country. The Far West had cooler than normal temperatures and higher than normal day-to-day variability, while east of the Rockies conditions were warmer than normal with lower temperature variability.
 |
 |

National Precipitation - Winter
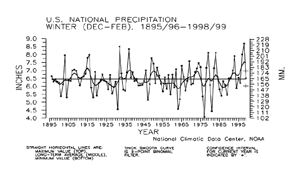 |
Preliminary data for Winter (Dec-Feb) 1998-99 indicate precipitation averaged across the contiguous United States was at the long-term mean ranking as the 47th wettest such season since 1895. Over eight percent of the country was much wetter than normal while over 14 percent of the country was much drier than normal. |
The national precipitation index expresses precipitation departure from the 60-year mean in terms of standard deviations. Each year's value is computed by standardizing the annual precipitation in each of 344 climate divisions across the U.S. using the gamma distribution over the 1931-90 period. The gamma statistical distribution takes into account heavy precipitation years and extremely dry years in the historical record (in mathematical parlance, "a zero-bounded skewed distribution"). These gamma-standardized divisional values are then weighted by area and averaged to determine a national standardized value for each year.
| These national values are normalized over the period of record. Negative values are drier and positive values are wetter than the mean. This index gives a more accurate indication of how precipitation across the country compares to the local normal (60-year average) climate. | 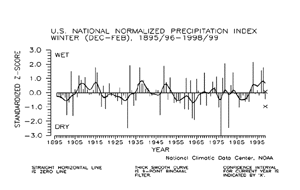 |
The preliminary national standardized precipitation index ranked Winter 1998-99 as the 30th driest winter since records began in 1895. This standardized z-score is estimated to be accurate to within 0.519 index units.

Current data are based on preliminary reports from River Forecast Center stations and First and Second Order airport stations obtained from the National Weather Service (NWS) Climate Prediction Center and real time Global Telecommunications System (GTS) monthly CLIMAT summaries. THE CURRENT DATA SHOULD BE USED WITH CAUTION. These preliminary data are useful for estimating how current anomalies compare to the historical record, however the actual values and rankings for the current year may change as the final data arrive at NCDC and are processed.
The following NCDC datasets are used for the historical U.S. data: the climate division drought database (TD-9640), and the hurricane datasets (TD-9636 and TD-9697). It should be noted that the climate division drought database consists of monthly data for 344 climate divisions in the contiguous United States. These divisional values are calculated from the 6000+ station Cooperative Observer network.
National Tornados
Based on preliminary data from the National Weather Service Storm Prediction Center the count of 188 tornadoes for Winter (Dec-Feb) 1998-99 set a U.S. winter tornado record. The 1953-1998 average winter tornado count is 55. The second greatest winter count was 149 in 1982-83, and the third greatest was 131 last year (1997-98). The smallest winter tornado count was 13 in 1984-85. 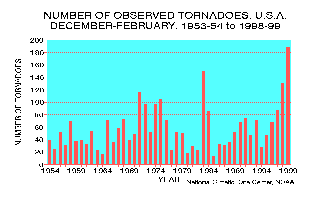 |
The high winter tornado count is due to unprecedented tornado activity in January 1999. The month-by-month preliminary tornado count is:
|
 NOAA's National Centers for Environmental Information