National Temperature
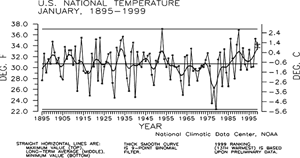
Preliminary data for January 1999 indicate that temperature average across the contiguous United States was above the long-term mean ranking as the 13th warmest January since 1895. Nearly 16% of the country was much warmer than normal while about 0% of the country was much cooler than normal.
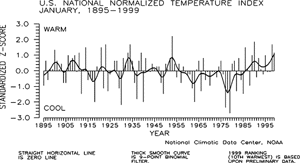
The national temperature index expresses temperature departure from the 60-year mean in terms of standard deviations. Each year's value is computed by standardizing the temperature for each of 344 climate divisions in the U.S. by using their 1931-90 mean and standard deviation, then weighting these divisional values by area.
These area-weighted values are then normalized over the period of record. Positive values are warmer and negative values are cooler than the mean. The preliminary national standardized temperature index ranked January 1999 as the 10th warmest such month on record.
National Precipitation
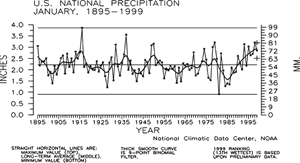
January 1999 was the 13th wettest such month since 1895, based on preliminary data. Nearly 18% of the country was much wetter than normal while about six percent of the country was much drier than normal.
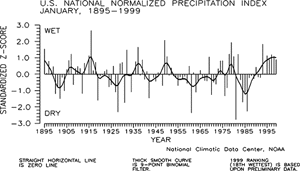
The national precipitation index expresses precipitation departure from the 60-year mean in terms of standard deviations. Each year's value is computed by standardizing the annual precipitation in each of 344 climate divisions across the U.S. using the gamma distribution over the 1931-90 period. The gamma statistical distribution takes into account heavy precipitation years and extremely dry years in the historical record (in mathematical parlance, "a zero-bounded skewed distribution"). These gamma-standardized divisional values are then weighted by area and averaged to determine a national standardized value for each year.
These national values are normalized over the period of record. Negative values are drier and positive values are wetter than the mean. This index gives a more accurate indication of how precipitation across the country compares to the local normal (60-year average) climate.
The preliminary national standardized precipitation index ranked January 1999 as the 18th wettest such month on record. This standardized z-score is estimated to be accurate to within 0.256 index units.
National Tornados
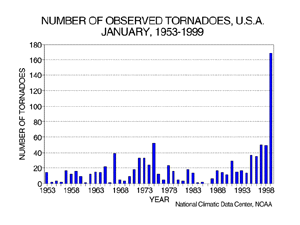
Based on preliminary data from the National Weather Service Storm Prediction Center the count of 169 tornadoes for January 1999 set a U.S. January tornado record. The January 1999 value was ten times the 1953-1998 average January tornado count of 16 and three times the previous January record of 52 tornadoes which was set back in 1975. The weather pattern took on a spring-like flavor during parts of January with a series of fast moving storms coming in from the Pacific which spawned the record number of January tornadoes.
Three significant tornado outbreaks occurred with a preliminary total of 121 tornadoes reported resulting in 19 deaths. The first outbreak occurred on January 2 in southeast Texas and along the western Gulf coast, the second outbreak occurred on January 17 in Tennessee, and the third on January 21-22, again mostly in Arkansas and Tennessee areas. More details are available in the "Extremes" section of this report.
It should be pointed out that the preliminary tornado count is traditionally higher than the final count and that the tornado observations have generally improved with time as better observing practices and instrumentation (especially weather radar and satellites) were utilized.
Current data are based on preliminary reports from River Forecast Center stations and First and Second Order airport stations obtained from the National Weather Service (NWS) Climate Prediction Center and real time Global Telecommunications System (GTS) monthly CLIMAT summaries. THE CURRENT DATA SHOULD BE USED WITH CAUTION. These preliminary data are useful for estimating how current anomalies compare to the historical record, however the actual values and rankings for the current year may change as the final data arrive at NCDC and are processed.
The following NCDC datasets are used for the historical U.S. data: the climate division drought database (TD-9640), and the hurricane datasets (TD-9636 and TD-9697). It should be noted that the climate division drought database consists of monthly data for 344 climate divisions in the contiguous United States. These divisional values are calculated from the 6000+ station Cooperative Observer network.
 NOAA's National Centers for Environmental Information
