National Overview

March Highlights
March Temperature

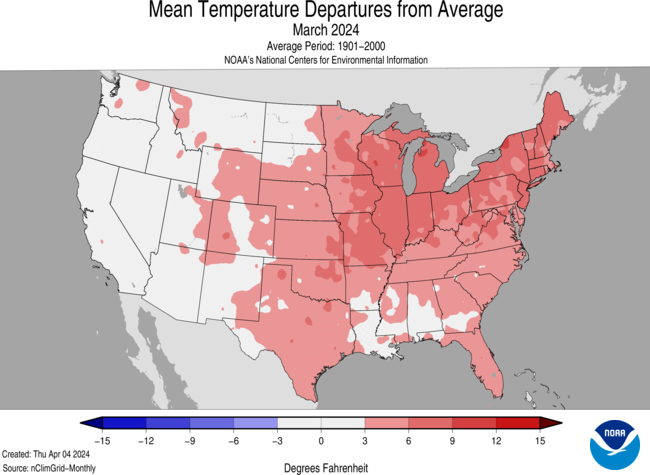
The contiguous U.S. average temperature during March was 45.1°F, 3.6°F above average, ranking 17th warmest in the 130-year record.
Temperatures were above average across much of the contiguous U.S., while below-average temperatures were observed in small pockets of the West and Southwest.
For the month of March, Connecticut and Delaware each had their eighth warmest March on record. Nine additional states ranked among their top-10 warmest March on record.
The contiguous U.S. average maximum (daytime) temperature during March was 56.6°F, 3.6°F above the 20th century average, ranking in the warmest third of the historical record for daytime temperatures. Maximum temperatures were above average across the majority of the eastern contiguous U.S. and Plains, and in parts of the Northwest and Rockies. Near-average temperatures were observed across much of the West and in parts of the Southeast, while below-normal temperatures were observed in parts of West and Southwest. Illinois ranked eighth warmest on record, while eight additional states ranked among their top-10 warmest March for daytime temperatures.
The contiguous U.S. average minimum (nighttime) temperature during March was 33.7°F, 3.7°F above the 20th century average, ranking 16th-warmest March on record for overnight temperatures. Minimum temperatures were above average across much of the contiguous U.S. while near- to below-average temperatures spanned portions of the northern Rockies and Plains and the West. Maine ranked second-warmest on record for March, while 13 additional states experienced a top-10 warmest March for nighttime temperatures.
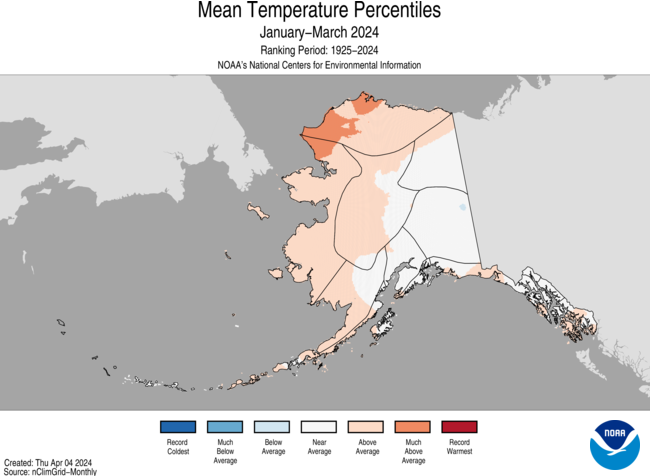
The Alaska statewide March temperature was 14.1°F, 3.3°F above the long-term average, ranking in the warmest third of the 100-year period of record for the state. Temperatures were above average across most of the state with near-normal temperatures in parts of the North Slope, Interior, Southwest and parts of the Aleutians and Panhandle.
Based on NOAA's Residential Energy Demand Temperature Index (REDTI), the contiguous U.S. temperature-related energy demand during March was 45 percent of average and the ninth-lowest value in the 130-year period of record.
March Precipitation

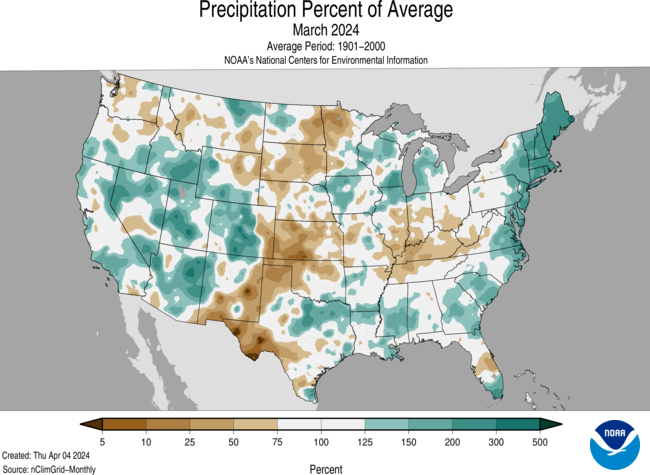
The March precipitation total for the contiguous U.S. was 2.85 inches, 0.34 inch above average, ranking in the wettest third of the 130-year record.
Precipitation was above average across much of the West, in the Great Lakes and along the Gulf and East coasts and in parts of the northern Plains. Conversely, precipitation was below normal across much of the Ohio Valley, the Plains, and in parts of the Northwest and Florida.
Maine and Rhode Island each ranked second-wettest March on record, while six additional states had their top-10 wettest March on record.
Across the state of Alaska, the average monthly precipitation ranked in the middle third of the historical record. Precipitation was above average in parts of the North Slope, West Coast and Southeast, while below-normal precipitation was observed in parts of the central Interior, south-central Alaska and in parts of the Panhandle during the month.
According to the April 2 U.S. Drought Monitor, about 18% of the contiguous U.S. was in drought, down about 3.6% from the end of February. Drought conditions expanded or intensified in portions of the Plains and in parts of the Northwest, central Mississippi Valley, northern Great Lakes and Hawaii this month. Drought contracted or was reduced in intensity across much of the Mississippi Valley, Puerto Rico and the West, and in parts of the Plains, Great Lakes and Carolinas.
Billion-Dollar Weather and Climate Disasters
One new billion-dollar weather and climate disaster was confirmed this month after a severe weather event impacted the central and southern U.S. during mid-March, with the most severe weather occurring on March 13–15.
Since these billion-dollar disaster records began in 1980, the U.S. has sustained 378 separate weather and climate disasters where overall damages/costs reached or exceeded $1 billion (based on the CPI adjustment to 2024) per event. The total cost of these 378 events exceeds $2.675 trillion.
Other Notable Events
Persistent heat brought record-breaking temperatures to portions of the U.S. during March:
- Approximately 106 million people, across portions of the Midwest and Northeast, experienced their top-10 warmest March on record.
- It was the 17th warmest March and the fifth warmest January-March period on record for the contiguous U.S.
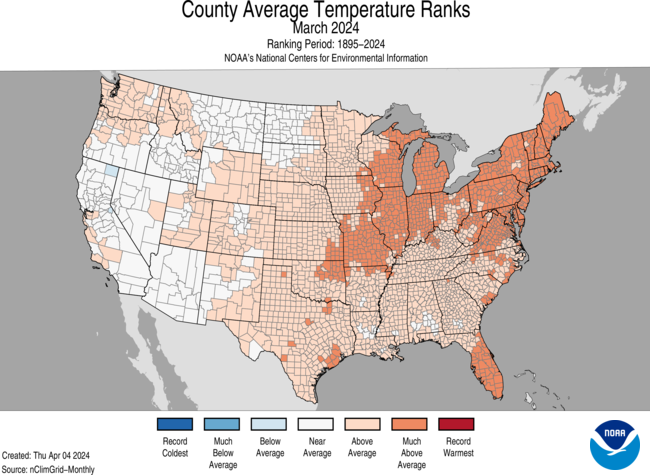
- A total of 532 counties experienced their top-10 warmest March on record. For the year-to-date period, 17 counties were record warm while an additional 1,258 counties ranked in the top-10 for this January-March period. There are 3,143 counties in the U.S.
- Winter did not bring heavy snowfall to Wisconsin nor the temperatures necessary to maintain the snow, allowing fires to begin early and in high numbers. Between January–March 2024, there have been more than 220 fires across Wisconsin.
- Above-normal temperatures were observed across much of Puerto Rico during March. San Juan broke several daily temperature records and tied 1981 for its second-warmest March on record.
On March 12–15 powerful storms brought baseball-sized hail and more than 20 tornadoes to portions of the Midwest:
- More than 400 severe weather reports were documented, becoming the most intense severe weather outbreak of the year through March 31.
- A powerful storm system brought considerable snowfall to Denver and the Colorado Rocky Mountains on March 13–15. Over a foot of new snow was measured in parts of the city, making it the most significant snowstorm the area has experienced in the past three years.
- On March 14, a state of emergency was declared for Ohio as several tornadoes struck the state, resulting in three fatalities when an EF-3 tornado crossed Auglaize and Logan Counties.
- In Ada, Oklahoma, a 5.25-inch diameter hail stone fell becoming the largest stone reported in Pontotoc County, Oklahoma since 1950 and the largest to fall in the state in nearly 13 years.
A blizzard in early March blasted parts of Sierra Nevada with gusts of up to 190 mph and more than 10 feet of snow, shattering the “snow drought” and significantly boosting vital snowpack levels.
Five wildfires, including the Smokehouse Creek wildfire, were finally contained in the Texas Panhandle, the largest cattle-producing region in the world. The wildfires resulted in approximately 1.1 million acres scorched, hundreds of destroyed structures, hundreds of miles of ruined fencing and more than 7,000 dead cattle.
Snow drought occurred in the Southeast, as Asheville, Greensboro and Charlotte, North Carolina, had their longest streaks with no measurable snowfall through March. The last measurable snows in those cities were recorded on March 13, January 17 and January 30, 2022, respectively.
Snow depth across Anchorage remained above two feet by the end of March—the second-highest depth ever recorded this late in March.
Year-to-Date Highlights


January-March Temperature

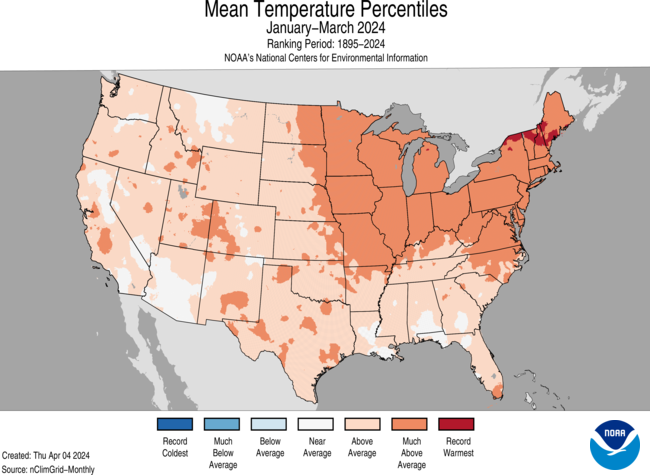
For the January-March period, the average contiguous U.S. temperature was 39.4°F, 4.2°F above average, ranking fifth warmest on record for this period.
Temperatures were above average across most of the contiguous U.S., while record-warm temperatures were observed in parts of the Northeast.
Wisconsin, Michigan, New York, Vermont, New Hampshire and Maine each ranked second warmest on record, while an additional 15 states ranked in their top-10 warmest year-to-date period. No state experienced a top-10 coldest event for this three-month period.
The contiguous U.S. average maximum (daytime) temperature during January-March was 50.0°F, 3.9°F above the 20th century average, ranking 11th warmest in the historical record. Above-average temperatures were observed across much of the conterminous U.S., while near- to below-average temperatures were observed in parts of the West, western Plains and Southeast. Wisconsin and Michigan each ranked second-warmest on record for daytime temperatures during the January-March period. An additional 19 states ranked among their top-10 warmest for daytime temperatures during this period.
The contiguous U.S. average minimum (nighttime) temperature during this three-month period was 28.8°F, 4.6°F above the 20th century average, ranking fourth warmest in the historical record. Above-average nighttime temperatures were observed across nearly all of the Lower 48, while near- to below-average temperatures were observed in small portions of the West, Lower Mississippi Valley and Southeast. New Hampshire and Vermont each ranked warmest on record, while 21 additional states ranked among their top-10 warmest January-March period on record for nighttime temperatures.
The Alaska January-March temperature was 9.4°F, 3.5°F above the long-term average, ranking in the warmest third of the historical record for the state. Much of the state was above average for the three-month period while temperatures were near average across the eastern portions of the state and in parts of the Aleutians and Panhandle.
Based on REDTI, the contiguous U.S. temperature-related energy demand during January-March was 27 percent of average and was the fifth-lowest value on record.
January-March Precipitation

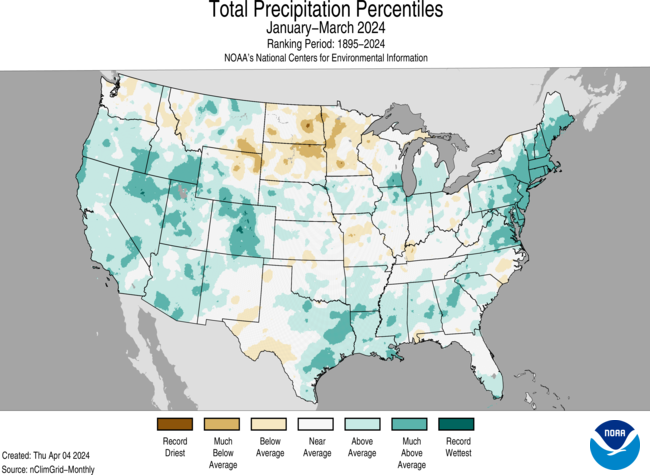
The January-March precipitation total for the contiguous U.S. was 8.15 inches, 1.19 inches above average, ranking 10th wettest in the 130-year record.
Precipitation was above average across much of the contiguous U.S., with Rhode Island having its second-wettest year-to-date period on record. Six additional states ranked among their top-10 wettest on record for this three-month period.
Conversely, precipitation was below average across much of the northern Plains and in small parts of the Northwest, central and southern Plains, Ohio Valley and Southeast during the January–March period. No states ranked among their top-10 driest year-to-date period on record.
The January-March precipitation for Alaska ranked in the wettest third of the 100-year record, with above-average precipitation observed in parts of the North Slope, West Coast and Southeast, while below-normal precipitation was observed in parts of the central Interior and south-central Alaska, as well as southern portions of the Panhandle during this period.
Extremes
The U.S. Climate Extremes Index (USCEI) for the year-to-date period was 6 percent above average, ranking in the upper third of the 115-year period of record. Extremes in warm maximum and minimum temperatures were the major contributors to this elevated CEI value. The USCEI is an index that tracks extremes (occurring in the upper or lower 10 percent of the record) in temperature, precipitation and drought across the contiguous United States.
On the regional scale, the Southwest and Ohio Valley were above average while the Northeast and Upper Midwest ranked much-above average with the Northeast experiencing the largest extent of extremes on record for this period. Each of these regions experienced elevated extremes in warm minimum temperatures, while the Ohio Valley, Northeast and Upper Midwest also observed elevated extremes in warm maximum temperatures. Wet PDSI and extremes in one-day precipitation were elevated across much of the Northeast, while extremes in dry PDSI blanketed more than one third of the Upper Midwest. Below-average extremes were observed across the South, Northwest and West regions during this three-month period.
Monthly Outlook
According to the March 31 One-Month Outlook from the Climate Prediction Center, above-normal monthly average temperatures in April are favored to impact much of the central U.S., Northwest and Northeast. Above-normal monthly precipitation is likely from much of the Plains to parts of the East Coast and in much of the Southwest during April. Drought is likely to persist along portions of the Northern Tier, the Southwest, Hawaii and Puerto Rico.
According to the One-Month Outlook issued on April 1 from the National Interagency Fire Center, much of the Upper Midwest and in parts of the central and southern Plains have an above-normal significant wildland fire potential during the month of April, while much of southeastern U.S. and areas along the Gulf Coast are expected to have below-normal potential for the month.
Regional Highlights
These regional summaries were provided by the six Regional Climate Centers and reflect conditions in their respective regions. These six regions differ spatially from the nine climatic regions of the National Centers for Environmental Information.
Northeast (Information provided by the Northeast Regional Climate Center)
An unusually warm, record-wet March featured record low snowfall in some locations.
Temperature
The Northeast had its 10th warmest March since records began in 1895, with an average temperature of 39.8 degrees F, 5.3 degrees F above normal. State average temperatures for March ranged from 4.0 degrees F above normal in Rhode Island to 5.9 degrees F above normal in New York. This March ranked among the 12 warmest for all 12 Northeast states: Connecticut, eighth warmest; Delaware, Maine, Maryland, Massachusetts, and New Jersey, ninth warmest; New York, Pennsylvania, Rhode Island, Vermont, and West Virginia, 11th warmest; and New Hampshire, 12th warmest.
Precipitation
It was the fifth-wettest March since 1895 for the Northeast, which picked up 5.38 inches of precipitation, 151 percent of normal. March precipitation for the 12 Northeast states ranged from 79 percent of normal in West Virginia, the lone drier-than-normal state, to 230 percent of normal in Maine. March 2024 ranked among the 17 wettest Marches on record for 10 of the states: Delaware, Maine, and Rhode Island, second wettest; Massachusetts, New Hampshire, New Jersey, and Vermont, third wettest; Connecticut, fourth wettest; Maryland, 13th wettest; and New York, 17th wettest. March 2024 became the wettest March on record for seven major climate sites: Bridgeport, Connecticut; Kennedy Airport, New York; LaGuardia Airport, New York; Atlantic City, New Jersey; Islip, New York; Caribou, Maine; and Albany, New York.
Drought
The U.S. Drought Monitor from March 5 showed less than one percent of the Northeast in moderate drought and three percent as abnormally dry. Moderate drought and abnormal dryness expanded slightly in western New York in response to continued precipitation deficits and much below-normal streamflow and groundwater levels. Meanwhile, moderate drought persisted on Nantucket, Massachusetts, driven mostly by reduced groundwater levels. However, conditions improved enough in northwestern Pennsylvania to ease abnormal dryness there. The U.S. Drought Monitor from March 26 showed less than one percent of the Northeast in moderate drought and two percent as abnormally dry. During March, western New York experienced record low or much below normal groundwater levels and 7-day streamflow, based on USGS data. During the spring fire season in the Mid-Atlantic, locally dry conditions contributed to multiple wildfires that burned several structures, led to evacuations, and reduced air quality in some locations.
Notable Weather
From March 10 to 12, a complex storm system brought heavy rain and snow to the Northeast, with precipitation totals of up to 3 inches. Coastal areas from Maryland to Maine saw mostly rain, while interior areas saw more of a mix of precipitation types, particularly higher elevations of northern New York and northern New England where the greatest snowfall totals approached 13 inches. Wind gusts of 30 to 60 mph accompanied the storm, with locally higher gusts generally along the coast. The gusty winds brought down trees and wires, resulting in power outages and contributing to a death in Pennsylvania, and led to temporary ground stops at airports such as Newark International Airport in New Jersey and Washington Dulles International Airport in Virginia. Meanwhile, coastal flooding in New England led to some road closures. From March 20 to 21, a storm moving across northern parts of the Northeast brought snow mostly to northern New England, particularly the higher elevations which generally saw the greatest snowfall totals of 8 to 12 inches. A Blizzard Warning was issued by the NOAA National Weather Service office in Caribou, Maine, for northern parts of that state as heavy snow was blown around by wind gusts as high as 50 mph. In southern parts of the region like West Virginia and Maryland, gusty winds of up to 60 mph downed trees and power lines. A major storm system delivered flooding rain, heavy snow, and ice to the Northeast from March 23 to 24. Much of the Mid-Atlantic, southeastern New York, and a large portion of southern New England saw mostly rain, with the greatest totals of 3 to 5 inches generally along the Interstate 95 corridor from southeastern Pennsylvania into southern Connecticut. March 23 became the wettest March day since recordkeeping began for LaGuardia Airport, New York (3.47 in.); Kennedy Airport, New York (3.13 in.); and Philadelphia, Pennsylvania (3.09 in.). It was among the three wettest March days for six other major climate sites including Central Park, New York; Wilmington, Delaware; and Concord, New Hampshire. The heavy rain resulted in localized flooding that closed roads, led to water rescues, suspended transportation services, and inundated buildings in some of these areas. Additionally, there was one flood-related fatality in southeastern Pennsylvania. Much of New York and northern New England saw a mix of precipitation types including freezing rain and snow. In fact, the storm produced one of the snow season’s largest snowfalls for an area stretching from northern and eastern New York into western and northern Maine, with the greatest storm totals ranging from 18 to 30 inches. For instance, Caribou, Maine, and Burlington, Vermont, had their greatest daily snowfall of the snow season on March 23 with 10.9 inches of snow and 8.6 inches, respectively. Some locations in New York and New England saw several hours of freezing rain, with reports of 0.50 inches to 0.75 inches of ice accumulation in places like Portland, Maine, and Albany, New York. Wind gusts of up to 50 mph accompanied the storm, with locally higher gusts in places like New York’s Long Island. Factors such as gusty winds, saturated ground, heavy snow, or ice accumulation brought down trees and power lines, blocking roads and resulting in power outages. For example, in Maine, dozens of roads were closed and over 200,000 customers lost power. The weather conditions also contributed to flight delays and cancellations, as well as vehicle accidents, across the Northeast. However, the snowfall gave some northern New England ski resorts a bump in attendance and allowed them to slightly extend their season. Outside of northern New England, snowfall was generally below normal. March 2024 was the least snowy March on record, tying several other years in most cases, for nine major climate sites: Worcester, Massachusetts; Boston, Massachusetts; Williamsport, Pennsylvania; Bridgeport, Connecticut; Islip, New York; Providence, Rhode Island; Allentown, Pennsylvania; Huntington, West Virginia; and Philadelphia, Pennsylvania. In fact, even with the March snowfall boost in northern New England, the snow season, which started in October, has generally been lackluster. For instance, some ski resorts relied heavily on snowmaking operations and the snowmobiling season in northern Maine ended about a month earlier than usual, with losses expected for businesses that rely on revenue from tourism. In early March, officials in northern Maine asked folks to remove their ice fishing shacks from local waterways due to rapidly changing ice conditions, while the New York State Department of Environmental Conservation warned hikers in the Adirondacks to “postpone high elevation activities due to unstable spring conditions” usually more typical of late March to mid-April. Peak bloom of cherry blossoms in Washington, D.C., occurred on March 17, tying as the second earliest date since 1921. The earliest peak bloom was March 15, 2000. Plants budding or blooming earlier than usual has also been noted in other areas like western New York and eastern Massachusetts, with allergy season arriving early and possibly being more intense in multiple parts of the Northeast. Additionally, some golf courses opened for the season during March.
For more information, please visit the Northeast Regional Climate Center Home Page.
Midwest Region (Information provided by the Midwest Regional Climate Center)
Temperature
The average March temperature for the Midwest was 40.5 degrees F (4.7 degrees C), which was 3.6 degrees F (2 degrees C) above the 1991-2020 normal. Anomalous warmth was present across the entire region, with temperatures 1-3 degrees F (0.6-1.7 degrees C) above normal in the northwest to more than 6 degrees F (3.3 degrees C) above normal in the central and eastern portions of the region. Preliminary statewide average temperatures ranged from 1.8 degrees F (1 degree C) above normal in Minnesota to 4.6 degrees F (2.6 degrees C) above normal in Michigan. The first two weeks of the month had widespread warmth. Kansas City, Missouri, had its 5th earliest 80 degrees F (26.7 degrees C) day on March 3. Near-normal and slightly below-normal temperatures returned to the region for the last two weeks of the month. Many long-running stations across the area, particularly in the central Midwest, had a top ten warmest March.
Precipitation
March precipitation totaled 2.62 inches (67 mm) for the Midwest, which was 0.05 inches (1 mm) above normal, or 102 percent of normal. Precipitation was up to 5 inches (127 mm) above normal across the Great Lakes and down to 3 inches (76.2 mm) below normal along the Ohio River. Preliminary statewide precipitation totals ranged from 1.76 inches (45 mm) below normal in Kentucky to 0.9 inches (23 mm) above normal in Michigan. Precipitation rankings across most Midwestern cities were unremarkable, except in Milwaukee, which had its third wettest March in 151 years.
Drought
The Midwest had some drought improvement throughout March. About 38 percent of the region started the month affected by drought. Drought coverage was reduced to about 27 percent by month’s end. The epicenter of drought remained locked across eastern Iowa, with a large area affected by extreme (D3) drought, while the western half of the state had one category improvement on the US Drought Monitor map. Drought improvements were noted across Missouri, Minnesota, and Wisconsin, although dryness and drought remained. Areas around the confluence of the Mississippi and Ohio Rivers trended drier in March, and drought development was an increasing concern.
Snowfall
March snowfall was confined to the upper Midwest, where totals ranged from 2-25 inches (5.1-63.5 cm). Snowfall was within 5 inches (12.7 cm) above or below normal throughout most of Iowa and Michigan. Conversely, Minnesota and northwest Wisconsin had 5-15 inches (12.7-38.1 cm) of above-normal snowfall for March. Minneapolis measured 15.2 inches (38.6 cm) of snow for the month, which was more snow than they received from Oct 2023 – Feb 2024.
Notable Weather
Hundreds of hail, tornado, and severe wind reports were noted across the Midwest on March 13-14 along an axis from southern Missouri to central Ohio. Large hail measuring 3-4 inches (76.2-101.6 mm) was reported in the St. Louis, Missouri, area. There were three fatalities and 27 injuries when an EF-3 tornado traversed Ohio’s Auglaize and Logan counties. Two people were injured when an EF-2 tornado touched down in Jefferson County, Indiana. Another 38 injuries were reported associated with an EF-3 tornado west of Selma, Indiana. At least 17 tornadoes were confirmed in the Midwest during this outbreak.
For more information, please visit the Midwest Climate Watch Home page.
Southeast (Information provided by the Southeast Regional Climate Center)
Temperature
Temperatures were above average across the Southeast in March, except in parts of southern Alabama, where temperatures were slightly below average. The greatest departures were found across the Florida Peninsula, southern Georgia, eastern portions of the Carolinas, and northern Virginia, where mean temperatures were 4 to 6 degrees F (2.2 to 3.4 degrees C) above average for the month. Key West, FL recorded its third warmest March on record (since 1871), while Fort Lauderdale, FL tied its third warmest March on record (since 1912). Above average temperatures persisted across the U.S. Caribbean. Saint Croix recorded its warmest March on record (since 1951) with a mean temperature of 81.7 degrees F (27.6 degrees C), breaking the previous record of 80.9 degrees F (27.2 degrees C) set in 1981. San Juan, PR tied its second warmest March on record (since 1898). Heat advisories were issued on the island for the 19th, with heat index values near 100 degrees F (37.8 degrees C) in San Juan and Mayaguez. The month began with unseasonably warm weather. Mean temperatures were 5 to 15 degrees F (2.8 to 8.3 degrees C) above average across much of the region through the first week of March, with some locations as much as 20 degrees F (11.1 degrees C) above average along the northern tier. After a brief period of near to slightly below average temperatures, warm weather returned around the middle of the month, with several locations running over 20 degrees F (11.1 degrees C) above average. Maximum temperatures reached 80 degrees F (26.7 degrees C) for the first time this year across northern Virginia on the 14th and 15th, which is 2 to 3 weeks earlier than average. In Florida, maximum temperatures reached 90 degrees F (32.2 degrees C) for the first time this year in places like West Palm Beach, Fort Lauderdale, and Miami on the 17th and 18th, which is at least a month earlier than average. This period of warm weather was followed by several days of unseasonably cool temperatures, with mean temperatures running 5 to 15 degrees F (2.8 to 8.3 degrees C) below average from the 19th through the 21st. Minimum temperatures dropped below freezing along the northern Gulf Coast. Highlands, NC, located above 4,000 feet (1,219 m) elevation in southwestern North Carolina, recorded a minimum temperature of 17 degrees F (-8.3 degrees C) on the 20th, making it the fifth coldest monthly minimum temperature on record (since 1877). After a brief warm-up, cooler temperatures returned to the region from the 24th to the 29th, with many locations across the northern tier of the region running 5 to 10 degrees F (2.8 to 5.6 degrees C) below average. Subfreezing temperatures were recorded across northern portions of Alabama and Georgia. March ended with more unseasonably warm weather across much of the region. Raleigh-Durham, NC reached 85 degrees F (29.4 degrees C) for the first time this year on the 31st, which is at least 2 weeks earlier than average.
Precipitation
Precipitation was above average across most of the Southeast in March. The wettest locations were found across southern portions of Alabama, Georgia, and South Carolina, as well as eastern portions of North Carolina and Virginia, where monthly totals were 4 to 8 inches (102 to 203 mm) above average (over 200 percent of normal). Cape Hatteras, NC recorded its wettest March on record (since 1874) with 13.86 inches (352 mm), breaking the previous record of 11.20 inches (284 mm) set in 1989. This included 3.75 inches (95 mm) on the 4th, which is the third wettest March day on record. Further north, Norfolk, VA recorded its second wettest March on record (since 1871) with 10.30 inches (262 mm) of precipitation. Charleston, SC recorded 8.12 inches (206 mm) for the month, which is nearly 2.5 times its expected monthly total. This included 3.04 inches (77 mm) on the 1st, which is the fourth wettest March day on record (since 1938). Also on the 1st, Asheville, NC recorded 1.63 inches (41 mm) of precipitation, which is more than it recorded during the entire month of February (1.24 inches (31 mm)). On the 9th, an area of low pressure tracked northeastward across the region, resulting in heavy precipitation and severe weather. Americus, GA, located in the southwestern part of the state, recorded its third wettest March day on record (since 1876) with 4.80 inches (122 mm). Downtown Charleston, SC also recorded 3.63 inches (92 mm), which is the wettest March day on record (since 1893). Another low pressure system tracked across the region on the 22nd and 23rd, resulting in widespread totals of 1 to 2 inches (25 to 51 mm). Eastern portions of North Carolina and Virginia recorded up to 4 inches (102 mm), while parts of South Florida recorded over 5 inches (127 mm) of precipitation over the two days. Several days later, one final low pressure system tracked across the Southeast, bringing more heavy precipitation to the region on the 27th and 28th. A swath of 1 to 2 inches (25 to 51 mm) extended from Florida to eastern Virginia, with some locations recording over 3 inches (76 mm). Norfolk, VA recorded 3.06 inches (78 mm) on the 28th, which is the third wettest March day on record (since 1871). While most of the region was wetter than average in March, some locations recorded below average totals for the month, including western portions of Virginia such as Charlottesville (84 percent of normal), Blacksburg (62 percent of normal) and Roanoke (83 percent of normal), as well as parts of central Florida, such as Orlando (46 percent of normal). Precipitation was variable across the U.S. Caribbean. Above average precipitation was observed across the northern and southern slopes of Puerto Rico, while below average precipitation was observed along the eastern and western slopes as well as the outlying islands. Trujillo, located in the northern coastal region, recorded 4.27 inches (108 mm) on the 26th, making it the second wettest March day on record (since 1957). Precipitation was generally below average in Saint Thomas and near average in Saint Croix. Most CoCoRaHS gauges in Saint John recorded less than 1 inch (25 mm) for the month. In terms of winter precipitation, trace amounts of snowfall, ice pellets, and up to 0.1 inches (2.5 mm) of freezing rain were reported across western portions of North Carolina and Virginia on the 1st of the month. Up to 0.5 inches (13 mm) of snow was reported across northern and western portions of Virginia, as well as western portions of North Carolina on the 10th of the month. Trace amounts of snow were also reported across western Virginia on the 18th and 19th. For the month, Mount Mitchell, NC recorded just a trace of snow. This ties the lowest March snowfall total on record (since 1925). The lack of snowfall has been persistent across parts of the region. On the 18th of the month, Asheville, NC and Charlotte, NC broke their previous records for the greatest number of consecutive days without measurable snowfall with runs of 737 and 779 days, respectively. Other locations reached one of their top 5 longest runs of days without measurable snowfall, including Greenville-Spartanburg, SC, Greensboro, NC, and Raleigh-Durham, NC.
Drought
Drought conditions generally improved in March. Abnormal dryness (D0) was eliminated across the interior of the region and along the northern Gulf Coast but persisted across the West Coast of Florida and eastern portions of North Carolina. A very small pocket of moderate (D1) drought also persisted in eastern North Carolina. Over 97 percent of the region was free of any drought or abnormal dryness at the end of the month, the highest percentage since September 2021. Drought conditions also improved in Puerto Rico. Abnormal dryness (D0) was eliminated across the interior of the island. Moderate (D1) drought was also eliminated on the southwestern end of the island and contracted on the northwestern and eastern ends. Abnormal dryness (D0) persisted on Saint Thomas, while Saint John and Saint Croix remained free of any drought or abnormal dryness.
Agriculture
Wet conditions limited field activities in parts of Alabama, Georgia, and South Carolina, and delayed some spring planting, notably for corn and other vegetables. Wet conditions also caused issues with seed germination and led to rotting of some young seedlings. Heavy precipitation in parts of southwest Georgia caused some agricultural facilities to flood and spoiled cases of produce before they could be shipped. Freezing temperatures during the month damaged some of the peach crop in South Carolina, though most peaches in Georgia were unharmed. Strawberries and blueberries were also spared as farmers were able to cover their crops ahead of time. While many places continued to see too much precipitation, some locations benefited from the additional moisture, especially across Florida, where the greening of pastures helped improve grazing conditions and reduced the amount of supplemental feed needed for livestock. Warm temperature and adequate soil moisture also allowed for preparation of spring planting across much of the state.
Notable Weather
There were 101 reports of severe weather across the Southeast in March, which is less than half of the median frequency of 208 reports over the period 2000 to 2022 (49 percent of normal). There were five confirmed tornadoes (1 EF-0, 3 EF-1s, 1 EF-2), which is below the median frequency of 20 (25 percent of normal). Four of these occurred across southern Alabama and Georgia, and northern Florida as part of a severe weather outbreak on the 9th of the month. Most of the damage consisted of downed trees with some structural damage to homes and outbuildings. The strongest tornado was an EF-2 that touched down near the community of Nahunta in Brantley County, GA, causing extensive damage to mobile homes, some of which were flattened and wrapped around trees. At least five people were injured. There were 57 wind reports in March, which is below the median frequency of 119 reports (48 percent of normal). Wind gusts over 50 mph (22 m/s) were reported from Florida to Virginia in association with the low pressure system that tracked through the region on the 9th and 10th of the month. Some gusts approached 70 mph (31 m/s) across parts of southwestern Virginia and northwestern North Carolina. Wind gusts over 60 mph (27 m/s) were reported across portions of Alabama and Georgia on the 15th and 16th. These storms also produced golf ball-sized hail and an EF-0 tornado in DeKalb County, AL. Wind gusts of 50 to 60 mph (22 to 27 m/s) were recorded across coastal sections of North Carolina and Virginia in association with the low pressure system off the East Coast from the 23rd to the 25th of the month. A severe thunderstorm produced a 75 mph (34 m/s) wind gust in Valdosta, GA on the morning of the 27th, resulting in downed trees that destroyed over 30 homes. There were 38 hail reports in March, which is below the median frequency of 69 reports (55 percent of normal). The largest hailstone was 2 inches (51 mm), or hen egg-sized, in the community of White City in Gulf County, FL on the 27th of the month. The famous Cherry Blossoms in Washington D.C. reached their peak bloom on the 17th of the month, which tied for the second earliest bloom date since the National Park Service began tracking their phenology in 1921. The earliest bloom date on record is just two days earlier (March 15, 1990). Raleigh, NC recorded a daily pollen concentration of 2,040 grains per cubic meter on the 21st of the month, which is the fourth highest daily concentration and highest concentration to date in the season since 2002. On the 25th, Atlanta, GA recorded a daily concentration of 4,117 grains per cubic meter, which is the highest value to date in the season since 2012. There were five rip current fatalities in March, all in Puerto Rico.
2023 Atlantic Hurricane Season
The Atlantic basin saw seven named storms in September, three of which affected the Southeast region. The circulation associated with Hurricane Lee brought high surf with waves up to 15 feet (4.6 m) and dangerous rip currents to Puerto Rico and the U.S. Virgin Islands on the 11th and 12th of the month. On the morning of the 23rd, Tropical Storm Ophelia made landfall in Emerald Isle, NC with winds of 70 mph (31.3 m/s). It gradually weakened as it tracked inland along the I-95 corridor through eastern North Carolina, becoming a tropical depression after crossing into Virginia later that evening. Wind gusts of 30 to 50 mph (13.4 to 22.4 m/s) were reported across central and eastern portions of North Carolina and Virginia. A few gusts exceeded 70 mph (31.3 m/s) near Wilmington, NC and along the Outer Banks, where storm surge ranged from 2 to 4 feet (0.6 to 1.2 m). Five people were rescued from a boat anchored in Lookout Bight as it was battered by rough surf and high winds. Water levels rose over 3 feet (0.9 m) across parts of the James River, with moderate to major tidal flooding observed in Jamestown and the city of Hopewell in eastern Virginia. Storm surge flooding was also observed on the Neuse and Pamlico rivers in eastern North Carolina, which resulted in significant flooding in the towns of New Bern and Washington. Further inland, flash flooding from heavy rainfall was observed in Greenville, NC and Richmond, VA, resulting in several road closures. Tens of thousands of power outages were reported across North Carolina and Virginia. At the end of the month, the circulation associated with Tropical Storm Philippe brought high surf and dangerous rip currents to Puerto Rico and the U.S. Virgin Islands.
For more information, please visit the Southeast Regional Climate Center Home Page.
High Plains (Information provided by the High Plains Regional Climate Center)
A late winter storm impacted the region at the end of March, bringing blizzard conditions and severe weather. Despite the significant storm, much of the region received below normal precipitation this month. In a typical display of the unpredictability and whiplash of the plains, parts of western Kansas were under both tornado and blizzard warnings at the same time. Several tornadoes touched down, followed by up to 6 inches (15.24 cm) of snow and wind gusts of 40 mph (64 km/h). A brief EF-1 tornado with 90 mph (145 km/h) winds hit the town of Garden City, causing minor damage. The winter weather associated with the system wreaked havoc in nearly every state in the region. Major interstates were closed, with poor road conditions stretching from Kansas to North Dakota. The hardest hit states were Colorado and South Dakota, with reports of up to 12 inches (30.48 cm) of snow. Strong winds led to whiteout conditions, leading to a rash of wrecks.
Temperature
March brought cooler temperatures for parts of the west, while the eastern portions of the region remained warm. The system that pushed through the region in late March led to a cool-down for many. While temperatures for the month were on both ends of the spectrum, nothing was out of the ordinary. The only major location to rank in the top 10 warmest or coldest was Laramie, Wyoming. The city ranked as the 8th warmest with an average temperature of 35.3 degrees F (1.8 degrees C), while surrounding locations such as Cheyenne or Rawlins were just outside the top 10. The front that pushed through late in the month provided some relief to the eastern parts of the region. While no records were broken, it did lead temperatures to drop below freezing for some and created potential issues for blooming plants.
Precipitation
Precipitation was spotty throughout the region except for Colorado. Parts of the state experienced record wetness, while parts of south-central Kansas reported trace to no precipitation. Much of the precipitation in Colorado this month was snow, falling from a significant storm in the middle of the month. Highways were closed across the state and over 800 flights were canceled at Denver International Airport. The snow was extremely heavy, leading to branches breaking and causing scattered power outages. Over 60 inches (152.4 cm) fell in parts of the Rockies, while portions of the foothills received over 12 inches (30.48 cm) this month. Canon City and Fruita crushed their precipitation records by over an inch (2.54 cm) due to the exceptional wetness. While much of Nebraska was dry, a record-setting snowstorm impacted North Platte early this month. In the city, 15.3 inches (38.86 cm) of snow fell on the 7th and set a new single-day record. The snow was extremely heavy at times, with up to 3 inches (7.62 cm) falling per hour. This narrow band stretched to the Broken Bow area; however, snowfall totals were much lower elsewhere. Despite most of Colorado being wet, the eastern plains were very dry. Minimal amounts of precipitation were reported around Campo and Lamar, with some areas receiving less than 0.10 inches (2.54 mm). Just across the border in Kansas, areas between Dodge City and Wichita received similar amounts resulting in drought expansion.
Drought
Drought conditions within the region are in decent shape at the end of March. Expansion and intensification were sporadic, but not serious. Overall, the region observed a slight increase of less than a percent of D0 to D4 (abnormally dry to exceptional drought conditions). The drought that has plagued central and eastern Nebraska has slowly improved over the past few months, with a pocket of D2 (severe drought) remaining between Lincoln and Grand Island. This is a significant improvement over the previous year, when D4 was present within the state. Similar to Nebraska, Kansas is in much better shape than 2023. Although there was a slight intensification in the south-central part of the state where it was nearly bone-dry, the current situation is significantly less bleak than the previous year when D4 covered the southwestern portions of the state. Elsewhere in the region, other improvements and degradation were observed.
For more information, please visit the High Plains Regional Climate Center Home Page.
South (Information provided by the Southern Regional Climate Center)
Heavy rains led to flooding and school closures across Arkansas on March 15th. The largest wildfire in Texas state history continued to impact the Texas Panhandle and western Oklahoma in early March.
Temperature
Temperatures were above normal across much of the Southern Region during March, with stations in the northern portions of the region recording temperatures as much as 5 degrees F above normal. The only area recording below normal temperatures was Far West Texas, where temperatures were zero to two degrees F below normal. Statewide averages were above normal for all states in the Region: Oklahoma (22nd warmest, out of 130 years), Tennessee (23rd warmest), the Southern Region as a whole (25th warmest), Texas (27th warmest), Arkansas (28th warmest), Mississippi (38th warmest), and Louisiana (39th warmest). The warmest recorded temperature in the Region was 99 F at three stations, all in Texas: Laredo on March 13th. Faith Ranch on March 13th, and Rio Grande Village on March 30th. The coldest recorded temperature was 9 F at Mt. Leconte, Tennessee on March 19th. The coldest lowland temperature was 14 F near Goodwell, Oklahoma on March 26th. No long-term stations in the Southern Region set records for highest maximum monthly or lowest minimum monthly temperature during March.
Precipitation
Precipitation was mixed across the Southern Region during March. Much of Louisiana, Mississippi, East Texas, and southern Arkansas recorded precipitation ranging from 125 and 200 percent of normal. The remainder of the Region was near to below normal with the driest conditions being recorded in the west of the Region. State totals were above normal for Mississippi (27th wettest) and Louisiana (34th wettest) and below normal for Tennessee (41st driest). Precipitation totals for Arkansas, Oklahoma, Texas, and the Southern Region as a whole were near their historical median values. Three stations, one WBAN and two CoCoRaHS, recorded more than 13 inches of precipitation in March: near Collinsville, Mississippi (13.83 inches), New Orleans Audubon, Louisiana (13.32 inches), and near Monroe, Louisiana (13.13 inches). Two stations, both in Arkansas, reported more than six inches of precipitation on one day: Magnolia (7.2 inches, March 15th) and El Dorado (6.3 inches, March 15th). Six long-term stations set single day accumulations records for March with the greatest difference between the old and new records being Magnolia, Arkansas on March 15th (7.2 inches vs 5.95 inches).
Drought/Flooding
During March, drought conditions remained largely steady across the Southern Region, with some areas of Tennessee, Mississippi, Louisiana, and East Texas seeing improvements in existing drought conditions of one to two categories, according to the US Drought Monitor. The only areas experiencing degradation in drought conditions were north-central Oklahoma and isolated areas of Central and South Texas. As of March 26th, Louisiana and Arkansas are essentially drought free; none of the Region is in Exceptional Drought. Given normal to above average precipitation for much of the Region over the previous months, subsoil moisture has rebounded across the Region with the USDA reporting at least 50 percent of land having Adequate subsoil moisture in all states in the Region except Texas which reported 46 percent of land having Adequate subsoil moisture. Planting of field crops began in southern portions of the Region during March with Texas and Louisiana reporting 32 and 51 percent of rice acres planted and Texas reporting 57 percent of corn acres planted as of March 31st.
Notable Weather
The Smokehouse Creek Fire, which began in February, continued to affect the Texas Panhandle and western Oklahoma. The fire was 100 percent contained as of March 16th according to the Texas A&M Forest Service. In total, the fire destroyed over 100 homes, burned over a million acres of rangeland, killed thousands of cattle, and led to two confirmed fatalities in Texas. The fire is the largest recorded in Texas state history and the largest in the United States so far in 2024. Heavy rains associated with thunderstorms on March 15th led to reports of flooding across portions of Arkansas and caused Magnolia Arkansas Public Schools to close for the day. There were 11 tornadoes reported across the Southern Region in March: 7 rated EF0, 3 EF1, and 1 EF2 affecting the states of Texas, Oklahoma, Louisiana, Arkansas, and Mississippi. There were no injuries or fatalities associated with these tornadoes. There were 172 reports of hail across the Region in March, with the largest being 5.25 inches near Ada, Oklahoma on March 14th. There were 86 severe wind reports with the fastest being 77 mph on March 15th near Sugar Land, Texas.
For more information, please visit the Southern Regional Climate Center Home Page.
West (Information provided by the Western Region Climate Center)
March came in like a lion for California and much of the Southwest as a powerful, multi-day storm impacted the region bringing heavy rain and mountain snow, and high winds. Mid-month saw a lull in storms and then several slow moving, cutoff low-pressure systems impacted the Southwest again during the latter half of the month. Regionally, the Southwest saw well above normal precipitation and temperatures were near-to-below normal. Continued dry and warm conditions persisted for much of the Pacific Northwest and northern Rockies with record low snowpack for some locations raising concerns about worsening drought conditions.
Temperature
Temperatures were one to three degrees Fahrenheit above normal (in the 70th to 90th percentile) for much of Washington, northern Idaho, western Montana, and southeast New Mexico. Quillayute, Washington, on the Olympic Peninsula, had a monthly average temperature of 47.5 degrees Fahrenheit, 3.5 degrees Fahrenheit above normal and the third warmest on record; Portland, Oregon mean monthly temperature was 50 degrees Fahrenheit and 1.7 degrees Fahrenheit above normal. Below normal temperatures were found throughout north central Montana, California, the Great Basin, and much of Arizona. The Sierra Nevada, California was one of the colder locations in the West; mean monthly temperature departures were 3.6 degrees Fahrenheit below normal at Blue Canyon, 3.4 degrees Fahrenheit below normal at Yosemite Village, and 2.5 degrees Fahrenheit below normal at Tahoe City.
Precipitation
Conditions were generally drier than normal in Washington, northern Oregon, northern Idaho, western Montana, and southeast New Mexico. The Washington Cascades and parts of the Rockies in Montana were particularly dry with SNOTEL stations reporting 40 percent to 60 percent of normal monthly precipitation; six SNOTEL stations in Washington and five in Montana are reporting the second lowest March precipitation totals on record. Low precipitation is being reflected in the well below normal snowpack in this region. Several strong storms impacted the Southwest bringing above normal monthly precipitation to the Sierra Nevada, northern Great Basin, most of Utah, and the mountains of Arizona and New Mexico; most SNOTEL sites in this region reported greater than 150 percent of normal precipitation for the month. In southeast Idaho, both Pocatello and Idaho Falls had the wettest march on record with 3.28 inches and 1.98 inches, respectively. Reno, Nevada logged 2.20 inches of precipitation coming in as the fourth wettest March on record.
Drought and Snowpack
According to the U.S. Drought Monitor (USDM) at the end of March, 23 percent of the West was in drought. Areas of extreme (D3) and exceptional (D4) drought are found in far southeast Arizona, southern New Mexico, and western Montana. Minor drought improvements were made throughout much of the West. However, the April 1 snowpack across Washington, northern Idaho, and western Montana was well below normal, and at record low levels for some locations, and worsening drought conditions are expected heading into summer as a result.
Alaska Summary
Precipitation was below normal for much of South Central, the Interior, and the southern half of the Panhandle. Ketchikan received 8.34 inches of precipitation for the month at 76 percent of normal and Petersburg received 4.87 inches at 64 percent of normal; this continues a several month dry stretch for the southern Panhandle which has led to below normal snowpack and potential summer drought impacts. Western coastal Alaska saw above normal precipitation with Nome at 228 percent of normal and Kotzebue at 173 percent of normal. Most of the state saw temperature anomalies of one to four degrees Fahrenheit above normal with some isolated areas in southern Alaska much warmer including Northway at 6.8 degrees Fahrenheit above normal and Talkeetna at 6.1 degrees Fahrenheit above normal. Parts of southwest Alaska had slightly below normal temperatures.
Hawaii Summary
Hawaii saw drier than normal conditions across the entire chain of islands except for the east coast of the Big Island. Lihue had its sixth driest March with 0.89 inches of precipitation (16 percent of normal), Molokai had its sixth driest March with 0.45 inches of precipitation (15 percent of normal), and Honolulu the tenth driest with 0.23 inches of precipitation (10 percent of normal). Drought currently covers 42 percent of Hawaii with severe drought (D2) found only on the Big Island and Maui; spatial drought coverage has increased since the start of the calendar year but is still much less than the 81 percent of area covered at the start of the water year.
Notable Weather
Four-day blizzard buries Sierra Nevada and strands motorists: A powerful storm impacted California during the first four days of March with the northern Sierra Nevada, near Lake Tahoe, being one of the hardest hit areas. Five to seven feet of snow fell, with locally higher amounts, and strong winds gusted to over 150 mph. Large Sierra storms are common; however, this storm was one of the strongest in the past 40 years when considering 4-days increases in snow water equivalent. Many cars and tractor trailers were stranded overnight on interstate 80 as extreme conditions forced the closure of the road without being able to first get all vehicles to safety. No injuries were reported.
For more information, please go to the Western Regional Climate Center Home Page.