
 Southwest U.S. Wildfires
|
Global Hazards and
Significant Events for June 2002
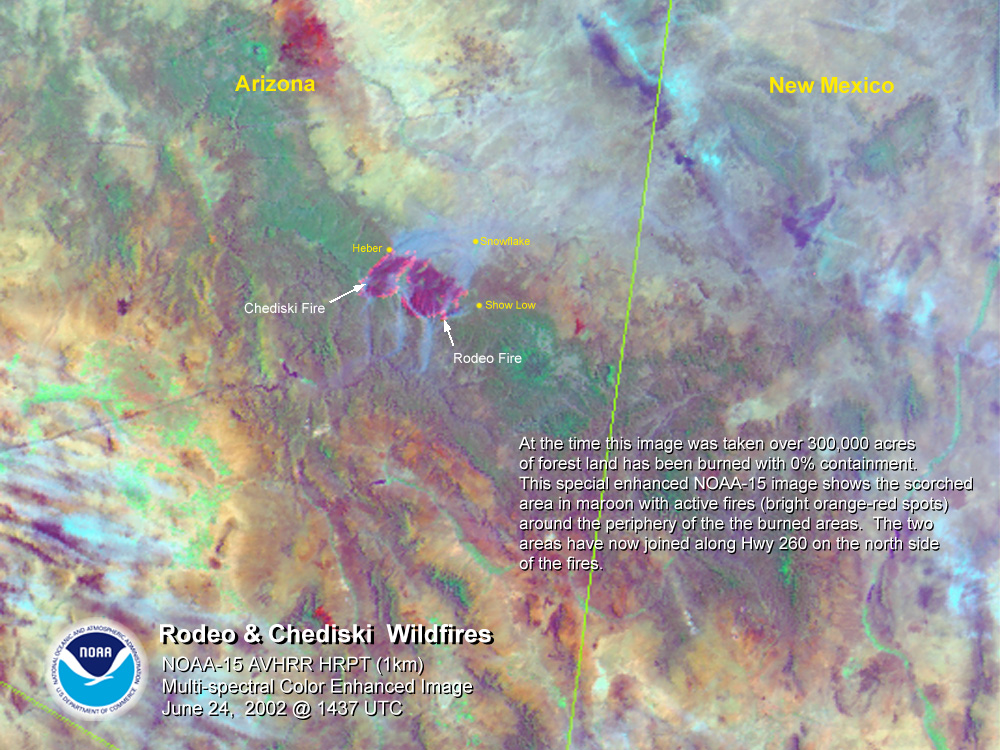
Large wildfires spread rapidly across parts of
the southwestern United States under conditions of severe drought,
low humidity, high winds and hot temperatures. The Rodeo/Chediski
wildfire, the largest wildfire in Arizona history, burned over
468,000 acres (189,000 hectares) and destroyed 467 homes and
businesses (MSNBC). Other large wildfires burned across parts of
Colorado, Utah, New Mexico and California.
|

| A heat wave that began
in May
2002 across parts of southwest Asia continued in June, with
more than 20 deaths reported in Pakistan during the first 3 weeks
of the month (CIP report). Daily temperatures exceeded 47°C
(117°F) across much of central Pakistan on the 9th. Normal
daily maximum temperatures in Pakistan during June generally range
between 36 and 43°C (97 and 109°F). |

larger
image
|
| Monthly temperatures
during June 2002 were 1-3°C (1.8-5.4°F) above a 1988-2002
average across Afghanistan and Pakistan, a region that has
experienced drought for the last 4 years. |
larger
image
|
The government of Zambia declared the country’s
food shortage a natural disaster in early June, as nearly 4
million people face starvation (BBC news). Drought has affected
much of southern Africa, including Mozambique, Malawi, Zimbabwe
and Swaziland.
| In the United States,
drought
intensified across parts of the Southeast and West, while
beneficial rains eased drought conditions across the
Northeast. |

larger
image
|

larger
image
|
Locally heavy rainfall
brought limited relief to drought-stricken areas of Montana and
adjacent areas of Alberta and Saskatchewan. The North American
wetness map (as shown in the figure to the left) depicts surface liquid water
anomalies as derived from the Special Sensor Microwave Imager
(SSMI) aboard NOAA's polar orbiting satellites. |


larger
image
|
The onset of the
Indian monsoon season was enhanced by the westward movement of a
low pressure system across central and western parts of the country
during the 22nd-26th. In the Gujarat region along the west coast of
India, rainfall during the 25th-26th totaled 250 mm (9.8 inches) at
Ahwa.
Early monsoon rains brought
flooding to northeastern areas of India, affecting 30,000
people and flooding the Brahmaputra River (AP). Endangered wildlife
such as wild elephants and rhinoceroses were forced out of wildlife
preserves making them vulnerable to poaching.
|
Farther to the east, heavy rains
brought flooding to parts of Bangladesh, with thunderstorms
affecting the area between the 16th-18th.
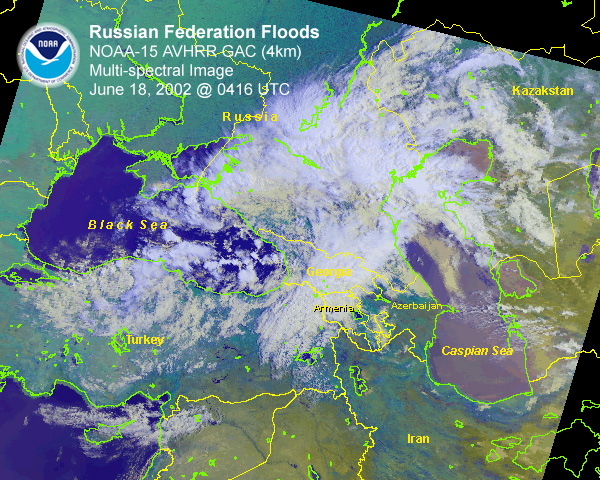
| Heavy rains along a
frontal system brought extensive
flooding to parts of southern Russia between the Black Sea and
Caspian Sea during the 17th-18th. At least 102 people were killed,
with more than 40,000 houses flooded (AP/OCHA). In addition, over
200 bridges and more than 1,500 km (900 miles) of road were damaged
in one of the worst natural disasters in the region since the 1930s
(BBC News). The worst affected areas include Stavropol, Krasnodar
and Chechnya where Russian President Vladimir Putin ordered the
deployment of 12,000 military personnel to deal with the effects of
the flooding (ENS). |

larger
image
|

larger
image
|
Flooding that has been
characterized as some of the worst in a century affected large
portions of central and northern China, including the provinces of
Shaanxi, Fujin, Sichuan and Guizhou (ENS).
At least 500 people have died in floods, which began in early
June in areas around the Yangtze River (AFP). In the worst affected
province of Shaanxi, torrential rains from the 8th-10th produced
devastating floods which killed 152 people (AFP). |
| More than 500 mm (20
inches) of rain fell in Fujian province near three tributaries of
the Minjiang River, the rivers Jinxi, Shaxi and Futunxi, with the
Jinxi surging to its highest level in 200 years (Xinhua). An
estimated 36 million people have been affected by the recent
flooding in China (ENS). |

larger
image
|
Flooding that began in May 2002
in Chile continued into early June, with some of the heaviest rains
in nearly 80 years affecting central Chile (OCHA). The city of
Concepción received 70.6 mm (2.78 inches) of rain during the
first 7 days of June.

Strong thunderstorms affected a large area of northern Pakistan
late on the 23rd, causing structural damage to many houses and
resulting in 5 deaths and more than 50 injuries (AP). The deaths
occurred in villages near the northwestern city of Peshawar, where
many brick and mud houses could not withstand the force of the wind
and heavy rain.
Click for
loop
Radar Imagery courtesy of RAP/UCAR
|
In the United States,
a cluster of severe thunderstorms affected the Plains from
Kansas southward through parts of Texas on the evening of the 15th.
Numerous reports of hail and
wind damage were received across the region. |

| Noguri developed in
the South China Sea on the 6th and became a typhoon as it moved
well east of Taiwan on the 9th. Maximum sustained winds reached 155
km/hr (~85 knots) over open waters before the typhoon weakened as
it approached the coast of Japan. Locally heavy rains and gusty
winds affected the southeastern coastal areas of Honshu during the
11th-12th as Noguri’s weakened remnants accelerated to the
northeast. |

larger
image
|

larger
image
|
A slow moving storm
system which tracked across western and central Europe during June
5-10 brought locally heavy rains to much of the region. Rain and
mudslides affected parts of
eastern France and southern Germany during the 6th-7th,
flooding houses and roads (AP, CIP report). Farther to the east,
rain and thunderstorms affected the Pozarevac region of Yugoslavia
which resulted in river flooding that
displaced nearly 800 families from their homes (OCHA). |
Northern Hemisphere storm tracks
during the last 30 days are available courtesy of the Climate Diagnostics Center.

| Rain and high
elevation snow which affected much of South Africa around June 1st
occurred again across northern parts of the country on the
13th-14th as up to 15 cm (6 inches) of snow fell across higher
elevations. Moderate to heavy rains were observed across the lower
elevations along with much cooler than average temperatures. An
upper level trough of low pressure (as depicted by negative 500
millibar height anomalies in the image to the right) was
responsible for the cooler, unsettled conditions. |

larger
image
|
Unseasonably cool and
wet
weather characterized conditions across South Africa during the
month of June.
larger
image
|
Unusually cold
temperatures during June promoted above average snow cover
across much of southern Argentina and Chile. A storm system which
brought heavy rains to lower elevations of central Chile early in
the month dumped heavy snow across the Andes Mountains. Significant
snow accumulations blocked the main road link between Chile and
Argentina on the 3rd (Reuters). |
References:
Basist, A., N.C. Grody, T.C. Peterson and C.N. Williams, 1998:
Using the Special Sensor Microwave/Imager to Monitor Land Surface
Temperatures, Wetness, and Snow Cover. Journal of Applied
Meteorology, 37, 888-911.
Peterson, Thomas C. and Russell S. Vose, 1997: An overview of
the Global Historical Climatology Network temperature data base.
Bulletin of the American Meteorological Society,
78, 2837-2849.


