Introduction
Temperature anomalies and percentiles are shown on the gridded maps below. The anomaly map on the left is a product of a merged land surface temperature (Global Historical Climatology Network, GHCN) and sea surface temperature (ERSST version 5) anomaly analysis. Temperature anomalies for land and ocean are analyzed separately and then merged to form the global analysis. For more information, please visit NCEI's Global Surface Temperature Anomalies page. The percentile map on the right provides additional information by placing the temperature anomaly observed for a specific place and time period into historical perspective, showing how the most current month, season or year compares with the past.
Temperature
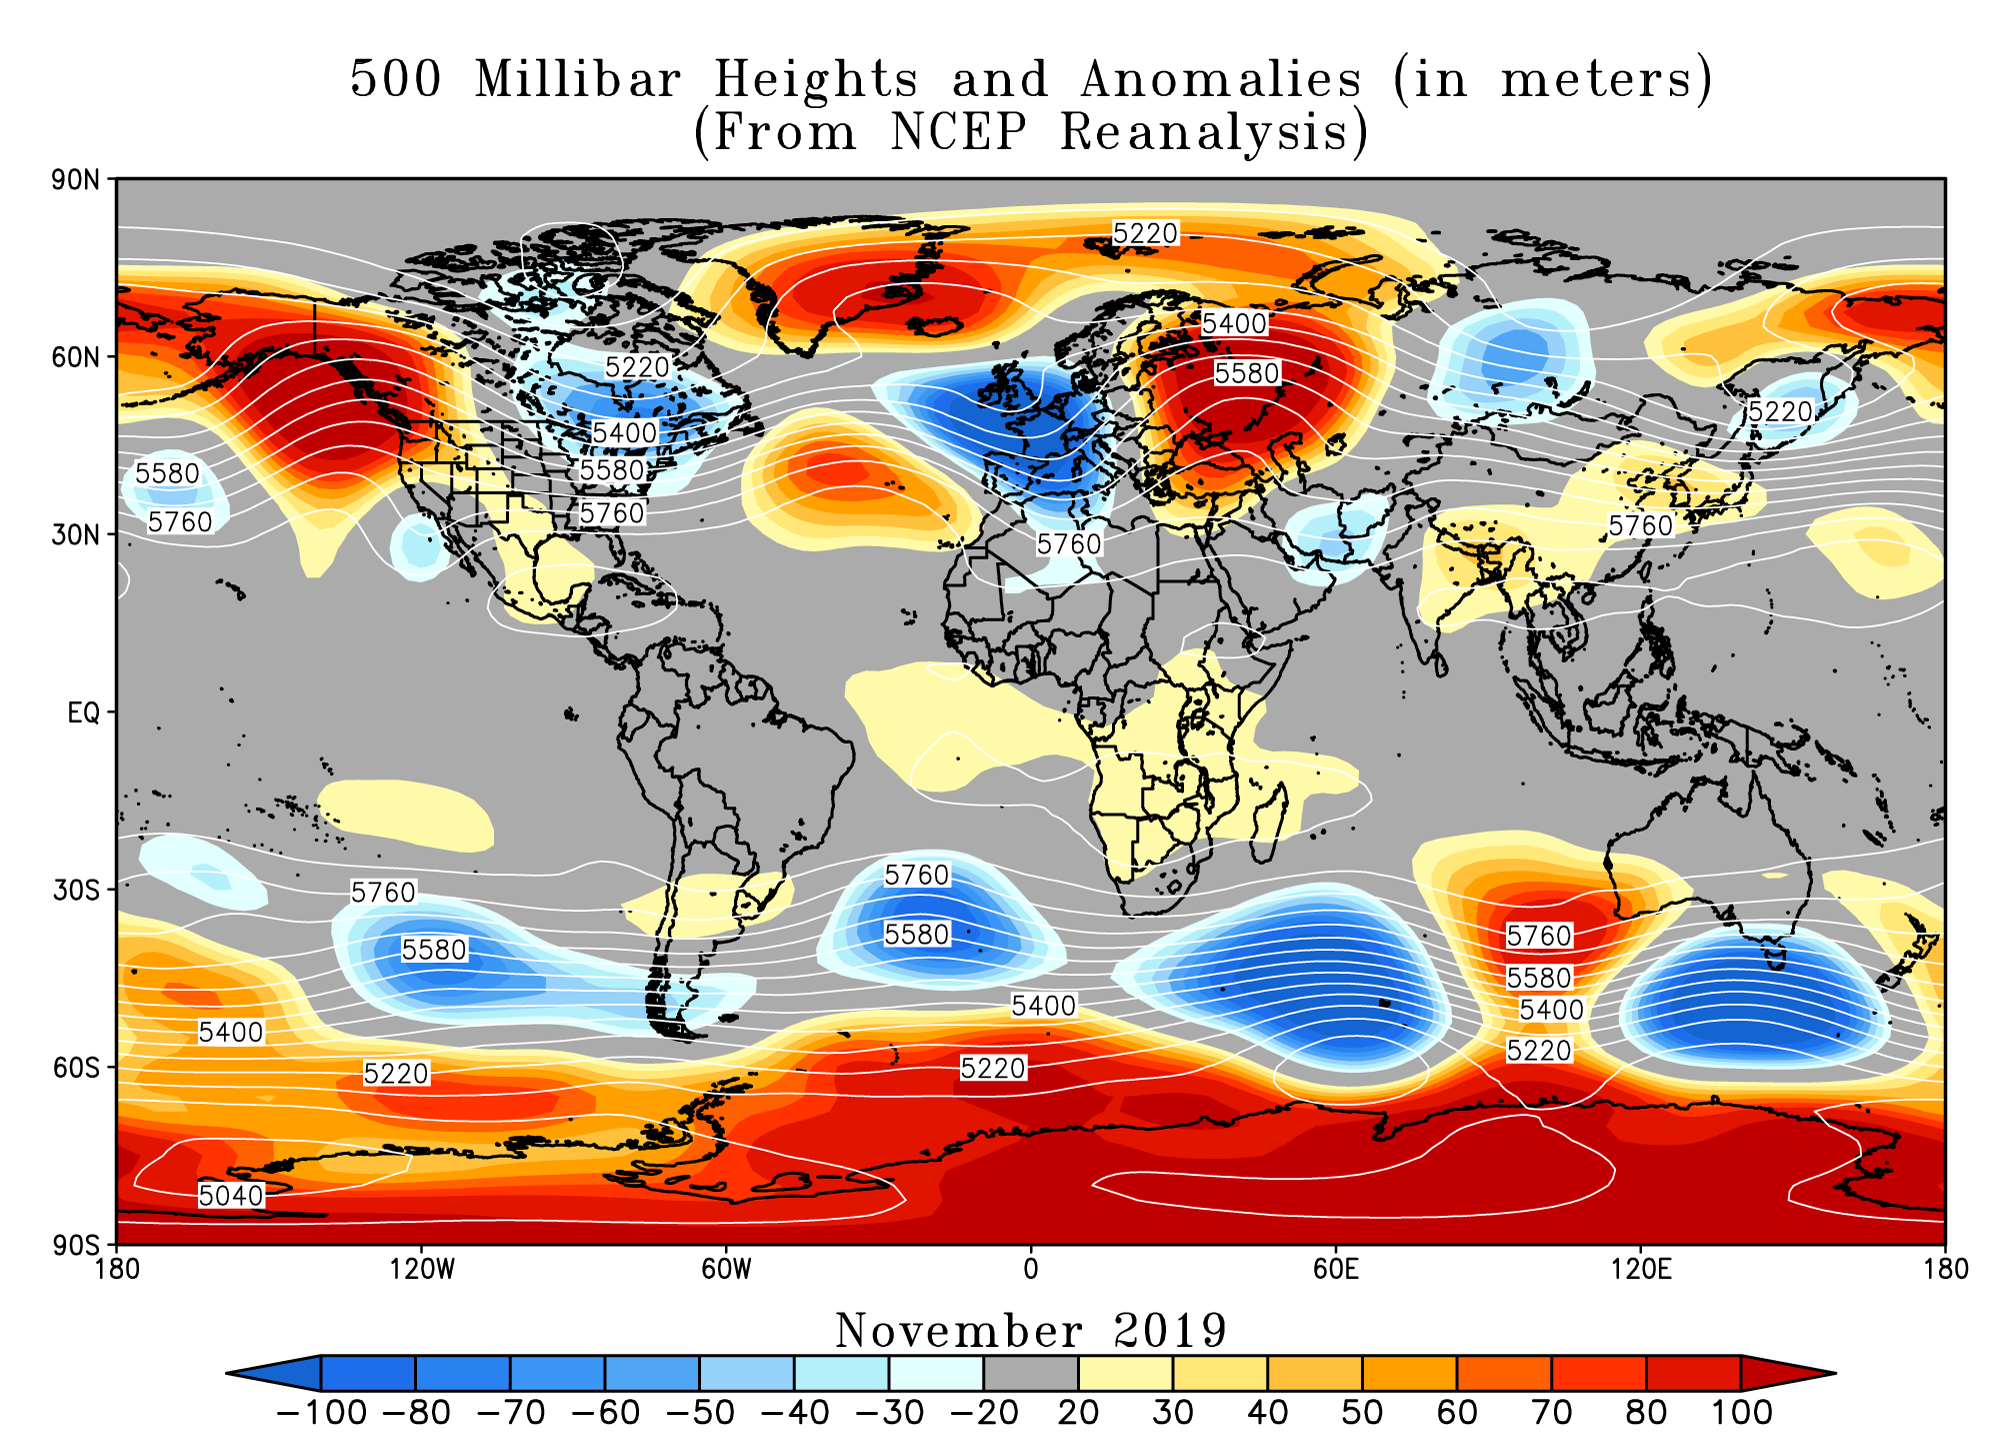
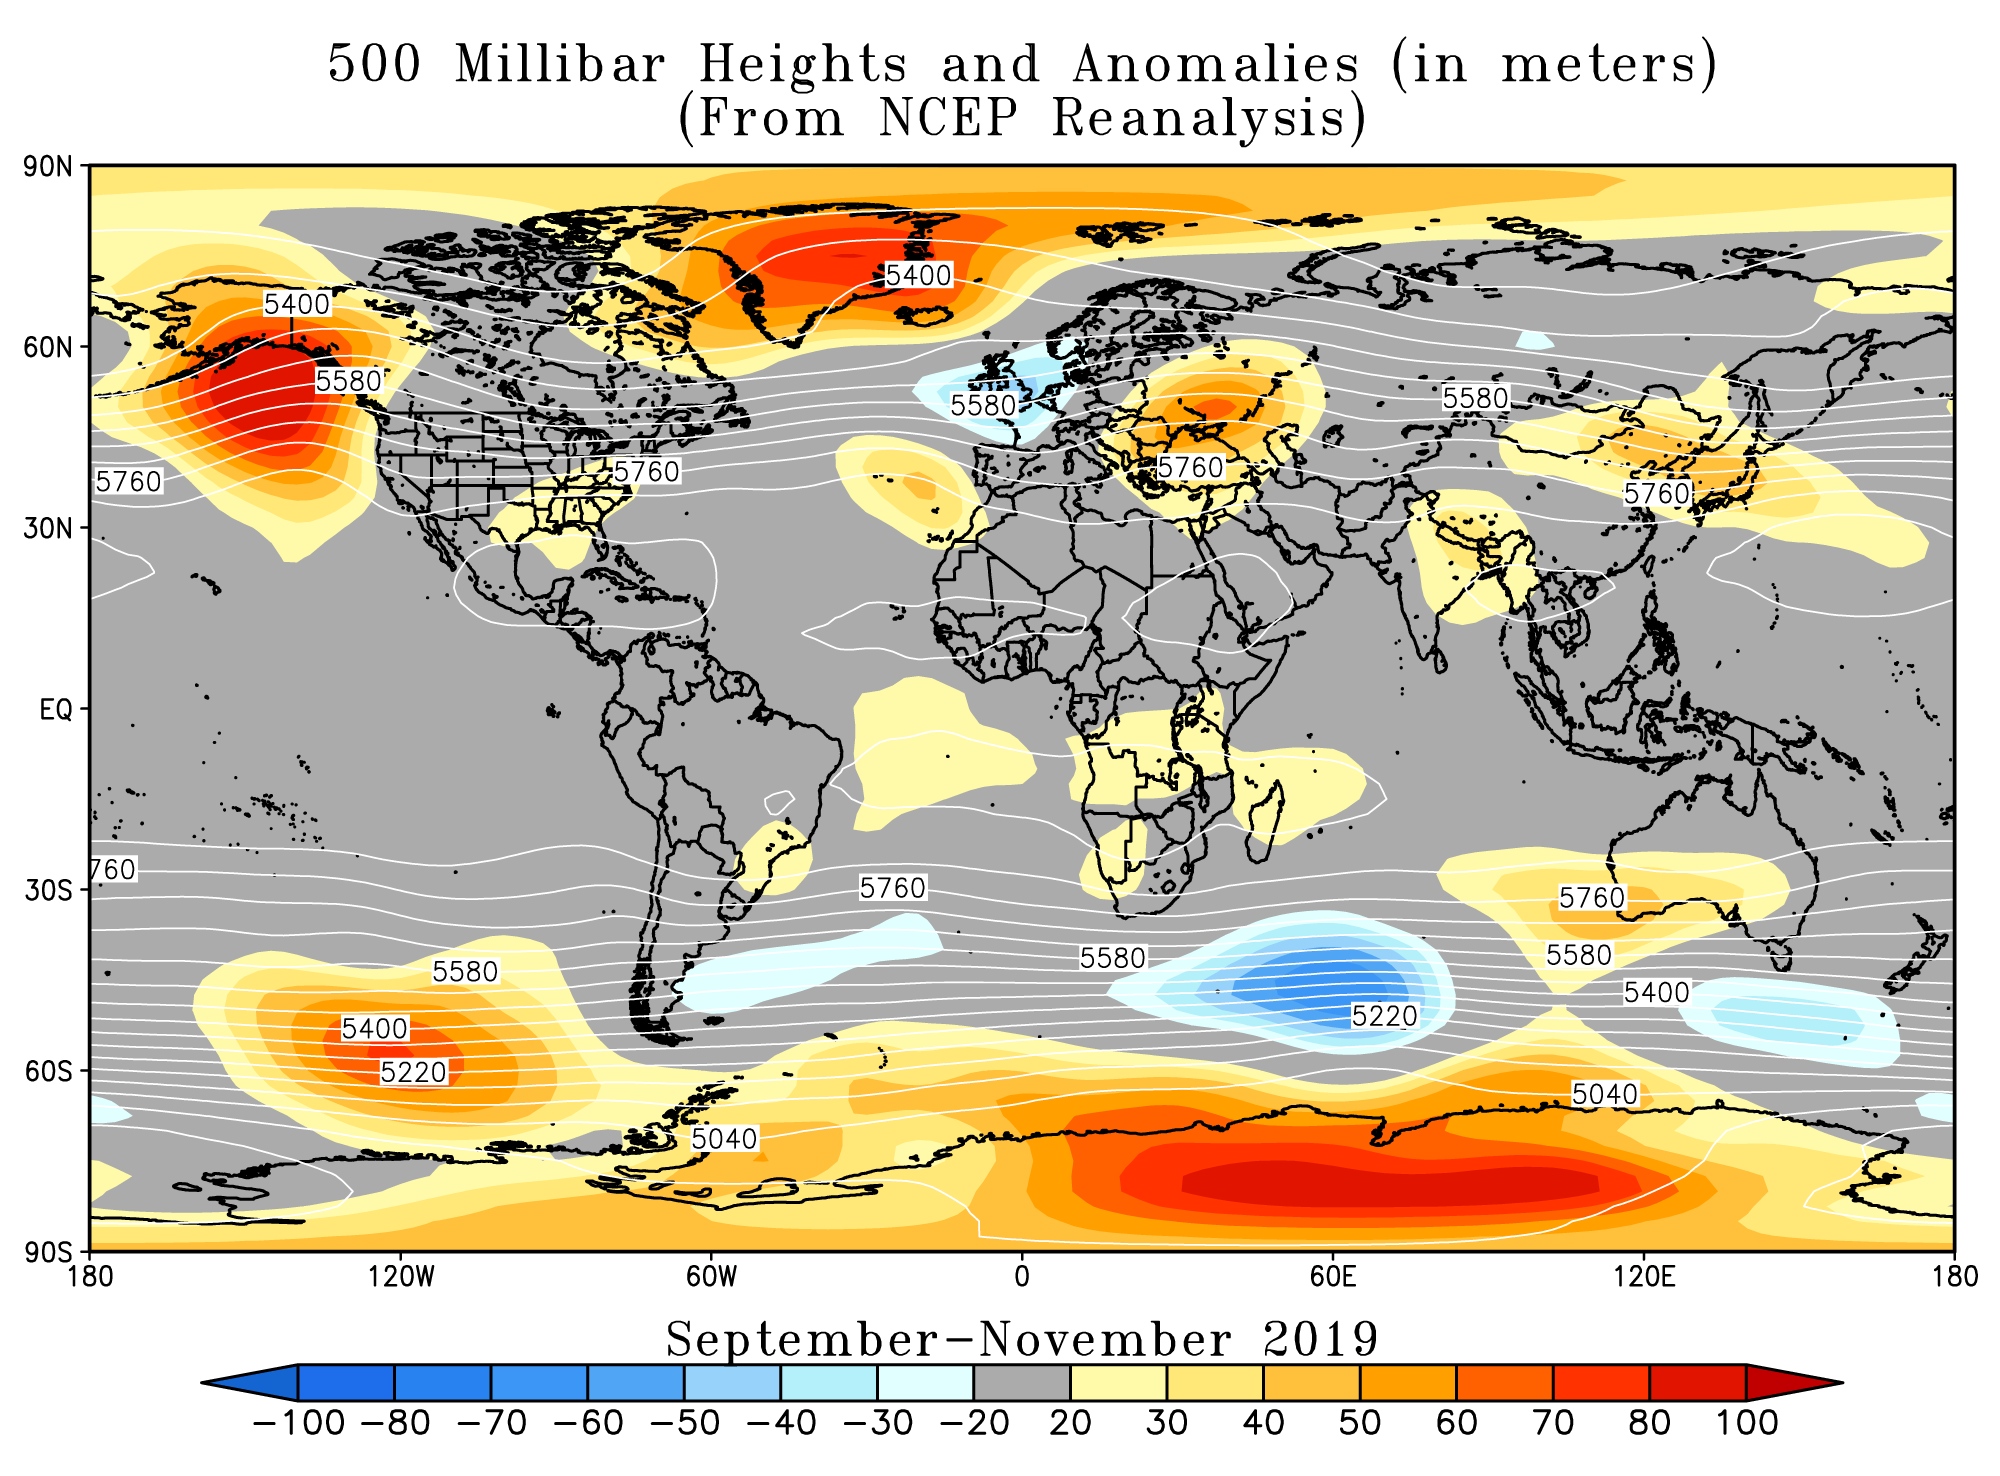
In the atmosphere, 500-millibar height pressure anomalies correlate well with temperatures at the Earth's surface. The average position of the upper-level ridges of high pressure and troughs of low pressure—depicted by positive and negative 500-millibar height anomalies on the November 2019 and September– November 2019 maps—is generally reflected by areas of positive and negative temperature anomalies at the surface, respectively.
Monthly Temperature: November 2019
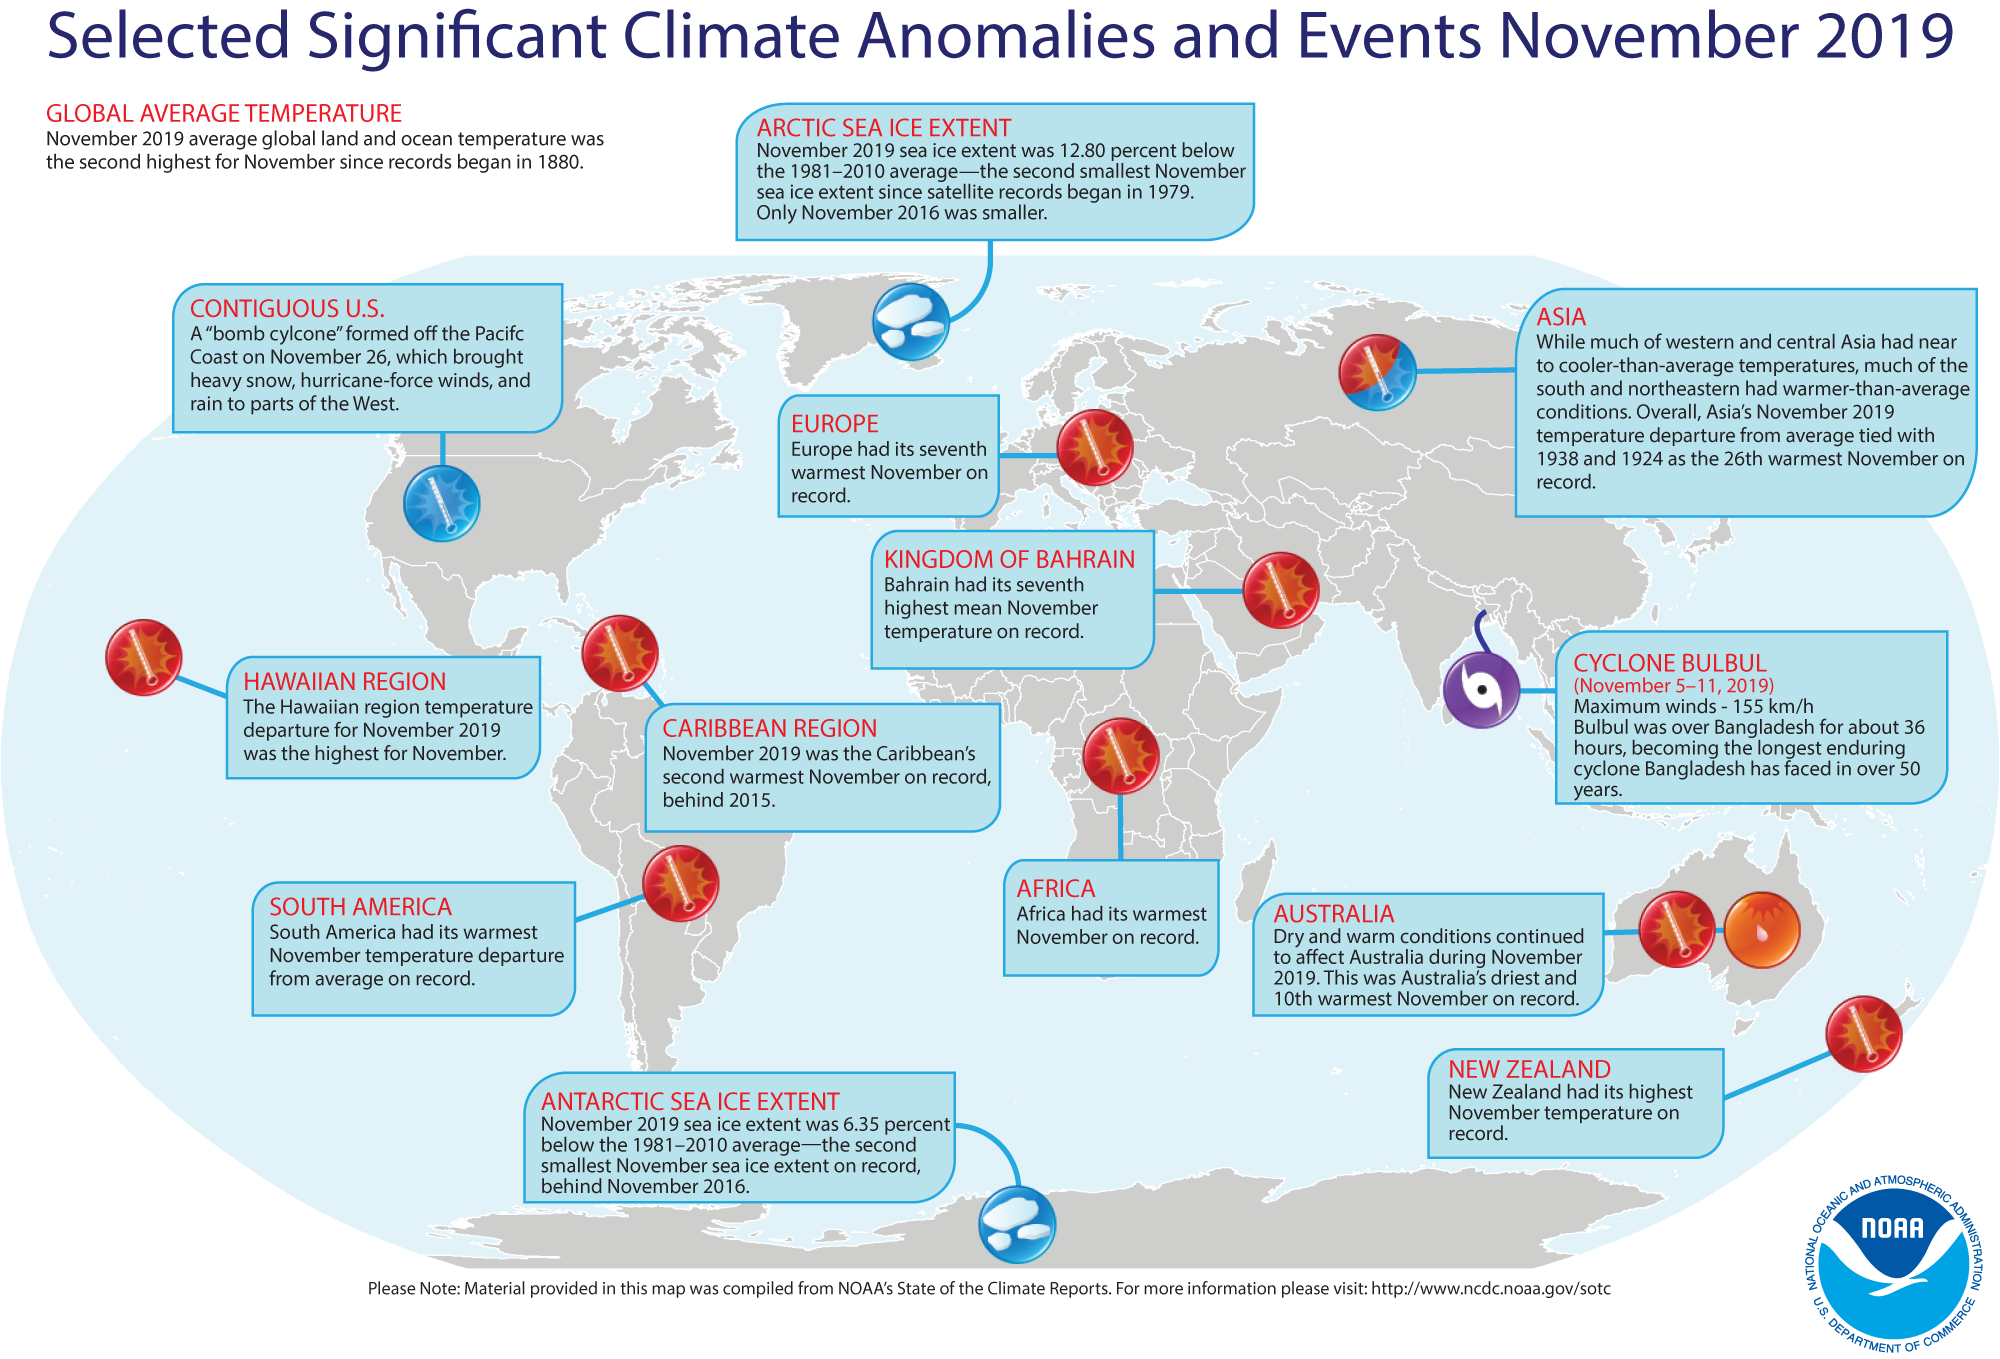
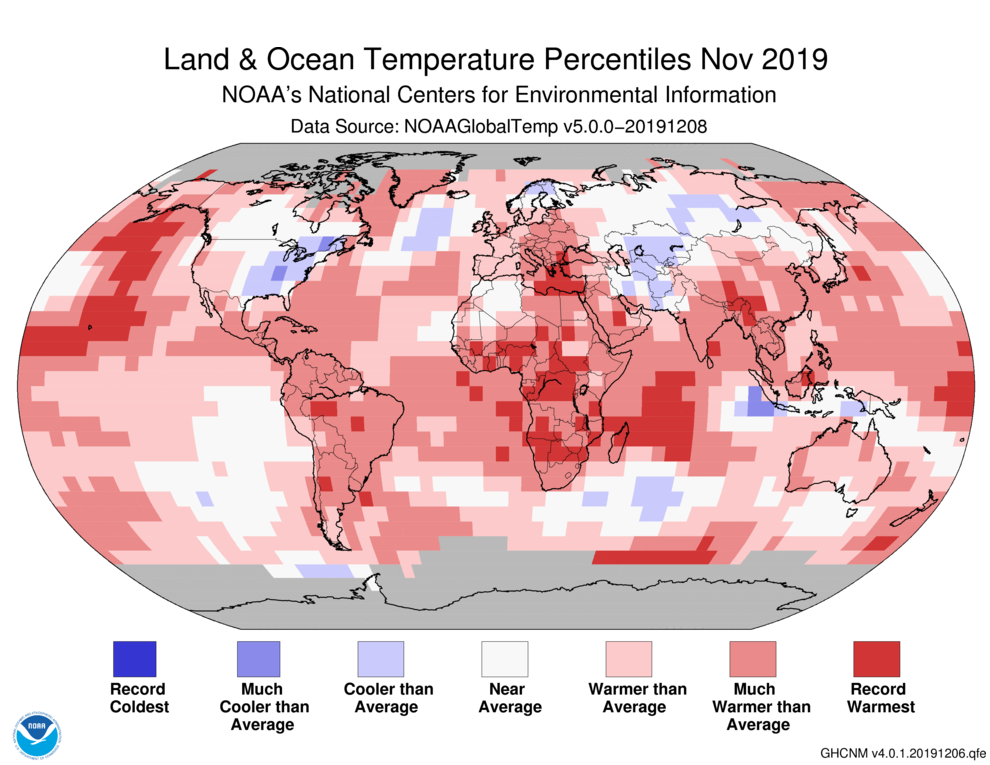
The November 2019 global land and ocean surface temperature was 0.92°C (1.66°F) above average and the second highest November temperature in the 140-year record. Only November 2015 was warmer at +1.01°C (+1.82°F). The five warmest November global land and ocean surface temperature departures from average have occurred since 2013. November 2019 marked the 43rd consecutive November and the 419th consecutive month with temperatures, at least nominally, above the 20th century average.

The global land-only surface temperature was 1.30°C (2.34°F) above the 20th century average and the eighth highest November temperature on record. The global ocean-only November 2019 temperature departure from average was also the second highest on record for November with a temperature departure from average of +0.77°C (+1.39°F). This value falls behind the record warm November set in 2015 (+0.87°C / +1.57°F). The five warmest November global ocean-only surface temperatures have occurred in the last five years (2015–2019).
The Northern Hemisphere land and ocean surface temperature was also second highest on record for November at +1.10°C (+1.98°F) above average, behind November 2015. The Southern Hemisphere global land and ocean surface temperature of 0.73°C (1.31°F) above average was the second warmest November on record. This was only 0.05°C (0.09°F) short of tying the record warm November set in 2015.
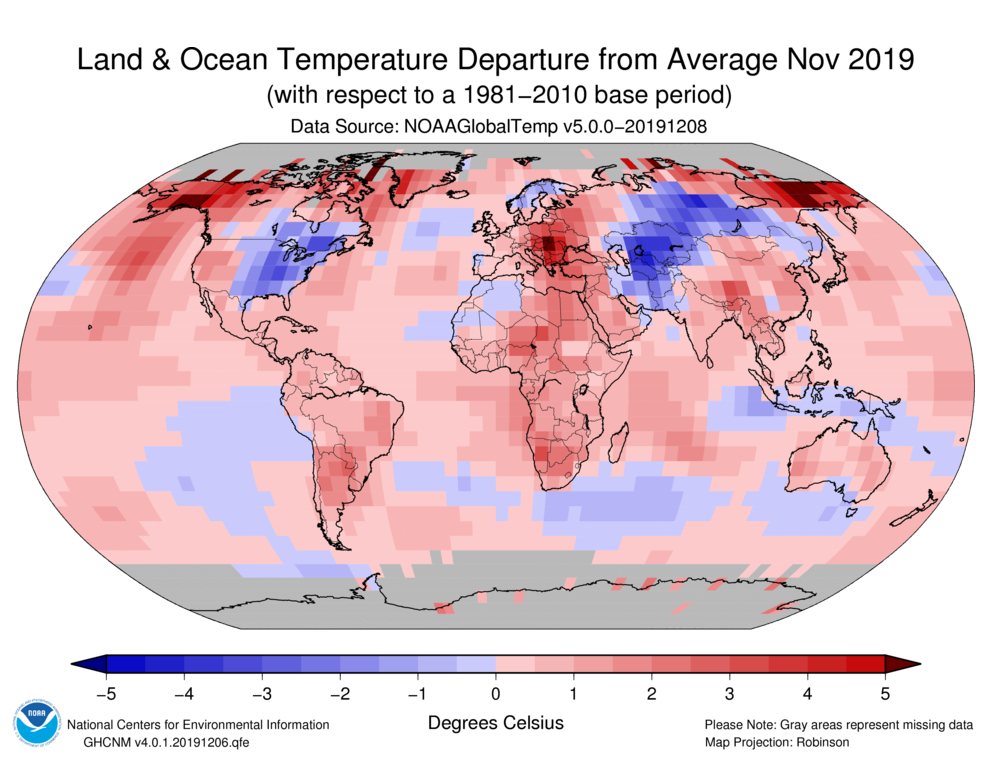
November 2019 was characterized by warmer-than-average conditions across much of the global land and ocean surfaces. The most notable temperature departures from average were present across much of the Northern Hemisphere land surfaces, specifically across parts of Alaska, northwestern and northern Canada, central Europe, and Russia's Far East, where temperatures were at least 2.5°C (4.5°F) or higher. Record-warm November temperature departures from average were present across parts of the northern and equatorial Pacific Ocean, Africa, southern Asia, South America, the South Atlantic Ocean, the Mediterranean Sea, and western Indian Ocean. Cooler-than-average conditions were present across the eastern half of the contiguous U.S. and southeastern Canada and northern parts of the Atlantic Ocean, as well as across parts of northern and southwestern Asia. However, no land or ocean areas had record-cold November temperatures.
Regionally, South America, Africa, and the Hawaiian region had their warmest November on record. The Caribbean region had its second warmest November on record, trailing behind 2015.
| November | Anomaly | Rank (out of 140 years) | Records | ||||
|---|---|---|---|---|---|---|---|
| °C | °F | Year(s) | °C | °F | |||
| Global | |||||||
| Land | +1.30 ± 0.26 | +2.34 ± 0.47 | Warmest | 8th | 2010 | +1.58 | +2.84 |
| Coolest | 133rd | 1892 | -1.13 | -2.03 | |||
| Ocean | +0.77 ± 0.15 | +1.39 ± 0.27 | Warmest | 2nd | 2015 | +0.87 | +1.57 |
| Coolest | 139th | 1909 | -0.48 | -0.86 | |||
| Land and Ocean | +0.92 ± 0.16 | +1.66 ± 0.29 | Warmest | 2nd | 2015 | +1.01 | +1.82 |
| Coolest | 139th | 1908 | -0.50 | -0.90 | |||
| Northern Hemisphere | |||||||
| Land | +1.22 ± 0.28 | +2.20 ± 0.50 | Warmest | 11th | 2010 | +2.04 | +3.67 |
| Coolest | 130th | 1892 | -1.39 | -2.50 | |||
| Ocean | +1.02 ± 0.14 | +1.84 ± 0.25 | Warmest | 2nd | 2015 | +1.11 | +2.00 |
| Coolest | 139th | 1912 | -0.54 | -0.97 | |||
| Land and Ocean | +1.10 ± 0.19 | +1.98 ± 0.34 | Warmest | 2nd | 2015 | +1.23 | +2.21 |
| Coolest | 139th | 1892 | -0.87 | -1.57 | |||
| Southern Hemisphere | |||||||
| Land | +1.50 ± 0.13 | +2.70 ± 0.23 | Warmest | 1st | 2019 | +1.50 | +2.70 |
| Coolest | 140th | 1917 | -0.80 | -1.44 | |||
| Ocean | +0.59 ± 0.15 | +1.06 ± 0.27 | Warmest | 3rd | 2015 | +0.69 | +1.24 |
| Coolest | 138th | 1924 | -0.48 | -0.86 | |||
| Land and Ocean | +0.73 ± 0.15 | +1.31 ± 0.27 | Warmest | 2nd | 2015 | +0.78 | +1.40 |
| Coolest | 139th | 1924 | -0.50 | -0.90 | |||
| Arctic | |||||||
| Land and Ocean | +2.11 ± 0.86 | +3.80 ± 1.55 | Warmest | 3rd | 2010 | +2.63 | +4.73 |
| Coolest | 138th | 1902 | -2.66 | -4.79 | |||
| Ties: 2013 | |||||||

The most current data can be accessed via the Global Surface Temperature Anomalies page.
Select national information is highlighted below. Please note that different countries report anomalies with respect to different base periods. The information provided here is based directly upon these data:
- Austria's national temperature for November 2019 was 2.0°C (3.6°F) above average and ranked among the 15 warmest Novembers since national records began in 1767.
- Warmer-than-average conditions affected Hong Kong during November 2019. The maximum temperature for Hong Kong tied as the second highest November maximum temperature on record at 26.1°C (79.0°F) or 2.0°C (3.6°F) above average. The mean temperature of 23.0°C (73.4°F) was 1.2°C (2.2°F) above average and among the six highest monthly temperatures for November since records began in 1884.
- Argentina had a warmer-than-average November, resulting in many locations across northern and central Argentina experiencing a top 10 warm November. Overall, this was the nation's third warmest November since national records began in 1961, with a temperature departure from average of 1.3°C (2.3°F) above average.
- Australia had its 10th warmest November in the nation's 110-year record with a mean temperature departure from average of +1.22°C (+2.20°F). The nation's maximum (daytime) and minimum (nighttime) temperatures were also above average at +2.09°C (+3.76°F) and +0.36°C (+0.65°F), respectively. Australia's maximum temperature ranked as the sixth highest since national records began in 1910. Regionally, Queensland, Western Australia, and the Northern Territory had a top 10 warm November on record, with Western Australia having its warmest maximum temperature (+3.00°C / +5.4°F) and third warmest mean temperature (+1.81°C / +3.26°F).
- New Zealand's national mean temperature for November 2019 was 15.3°C (59.5°F), which is 1.6°C (2.9°F) above the 1981–2010 average and the highest November temperature since national records began in 1909. This value was 0.2°C (0.4°F) warmer than the now second warmest November set in 1954 and again in 2013. According to NIWA National Climate Centre, four of New Zealand's ten warmest Novembers have occurred since 2009.
ENSO-neutral conditions continued during November 2019. According to NOAA's Climate Prediction Center, ENSO-neutral is favored during the Northern Hemisphere winter (Southern Hemisphere summer). This forecast focuses on the ocean surface temperatures between 5°N and 5°S latitude and 170°W to 120°W longitude, called the Niño 3.4 region.
Seasonal Temperature: September–November 2019
The September–November period is defined as the Northern Hemisphere's meteorological autumn and the Southern Hemisphere's meteorological spring.
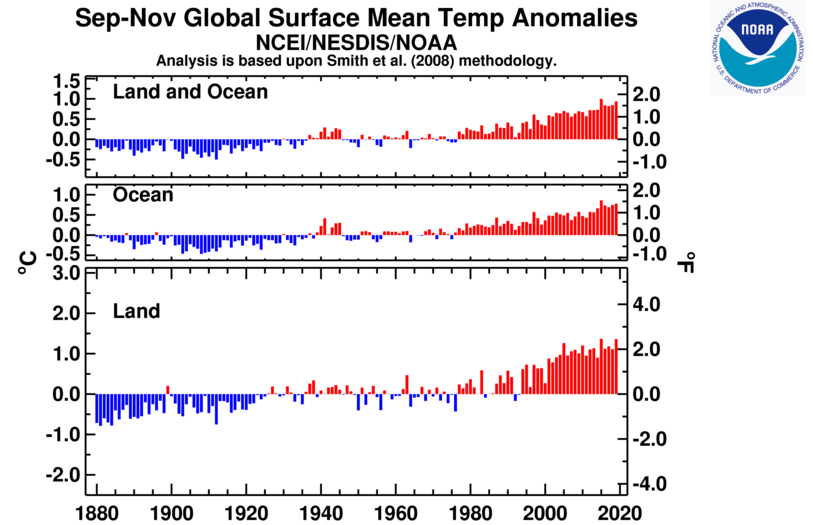
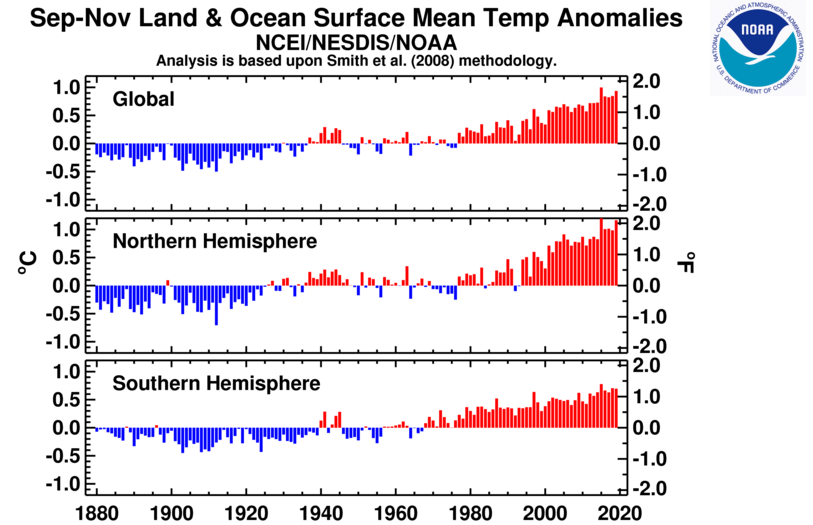
The September-November 2019 global land and ocean surface temperature was the second warmest such period in the 140-year record at 0.94°C (1.69°F) above average. This value is only 0.06°C (0.11°F) cooler than the record warm September–November of 2015. The ten warmest September–November periods have occurred since 2005, with the five warmest taking place the last five years (2015–2019).

The global land-only surface temperature was also second warmest for the three-month season, with a temperature departure from average of 1.36°C (2.45°F) above average and only 0.01°C (0.02°F) shy of tying the record warm global land-only surface temperature set in September–November 2015. The global oceans-only temperature for September–November was also second warmest at 0.78°C (1.40°F) above average. Only September–November 2015 was warmer (+0.86°C / +1.55°F).
The Northern Hemisphere September–November 2019 land and ocean surface temperature was also the second warmest such period in the 140-year record at 1.17°C (2.11°F) above average. This is only 0.04°C (0.07°F) cooler than the record-warm September–November set in 2015. The Southern Hemisphere September–November 2019 land and ocean surface temperature tied with 2018 as the second highest September–November temperature since global records began in 1880, with a hemispheric land and ocean surface temperature average of 0.70° (1.26°F) above average. Only September–November 2015 was warmer.
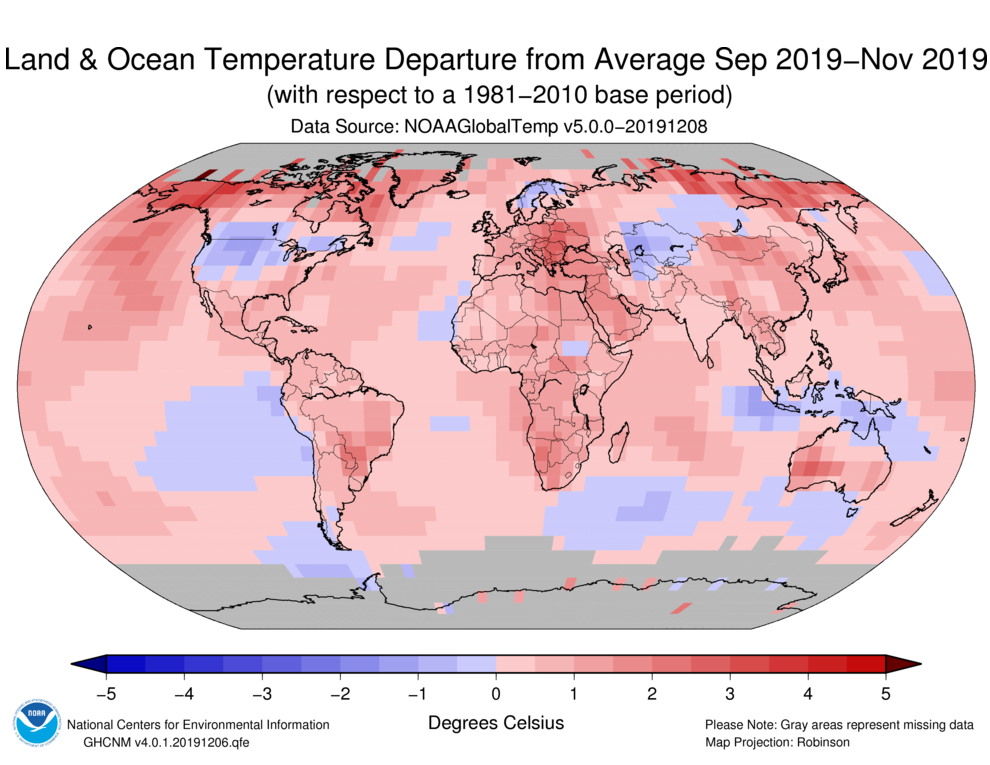
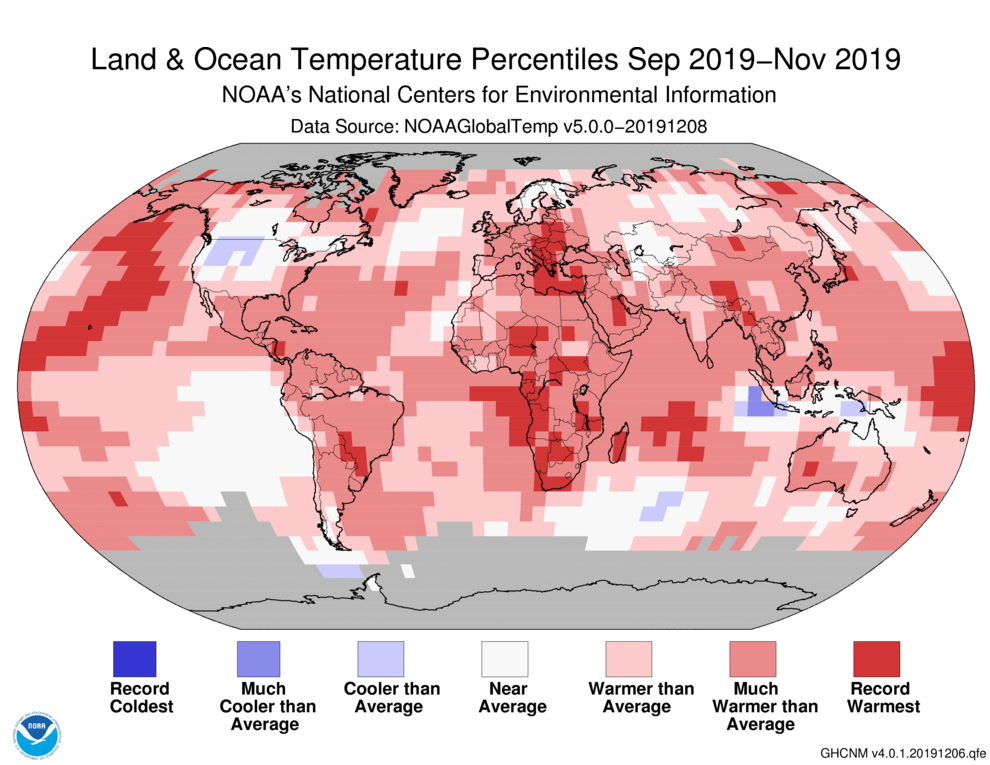
Warmer-than-average conditions were present across much of the globe during the three-month season. Record-warm temperatures during September–November 2019 were present across parts of the North and equatorial Pacific Ocean, Europe and the Mediterranean Sea, Africa, South America, western Australia, cetnral Indian Ocean, the Atlantic Ocean, and Asia. Cooler-than-average conditions were present across parts of the north-central contiguous U.S., the North Atlantic Ocean, and the southern oceans. However, no land or ocean areas had a record-cold September–November 2019 temperature.
Regionally, South America, Europe, Africa, and the Hawaiian region had a September–November temperature departure from average that ranked among the three warmest such periods on record. Of note, South America and the Hawaiian region had their warmest September–November on record.
Select national information is highlighted below. Please note that different countries report anomalies with respect to different base periods. The information provided here is based directly upon these data:
- France had its sixth warmest autumn on record at 1.0°C (1.8°F) above average. The five warmest autumns in France have occurred since 2006, with 2006 being the warmest autumn on record at 2.4°C (4.3°F) above average.
- Autumn 2019 was Austria's fourth warmest autumn in the nation's 253-year record at 1.5°C (2.7°F). Only autumns in 2014, 2006, and 2018 were warmer.
- Hong Kong's mean temperature during autumn 2019 was 26.1°C (79.0°F), which is 1.1°C (2.0°F) above average and ranks as one of the warmest autumns on record.
- Australia's national mean temperature during spring 2019 was +1.53°C (+2.75°F) above the 1961–1990 average and was the fifth highest spring temperature since national records began in 1910. Several locations had their warmest or near-record warm spring on record.
- Spring 2019 was New Zealand's 12th warmest spring since national records began in 1909, with a national temperature of 12.5°C (54.5°F) or 0.4°C (0.7°F) above the 1981–2010 average.
| September–November | Anomaly | Rank (out of 140 years) | Records | ||||
|---|---|---|---|---|---|---|---|
| °C | °F | Year(s) | °C | °F | |||
| Global | |||||||
| Land | +1.36 ± 0.23 | +2.45 ± 0.41 | Warmest | 2nd | 2015 | +1.37 | +2.47 |
| Coolest | 139th | 1881 | -0.79 | -1.42 | |||
| Ocean | +0.78 ± 0.15 | +1.40 ± 0.27 | Warmest | 2nd | 2015 | +0.86 | +1.55 |
| Coolest | 139th | 1908 | -0.47 | -0.85 | |||
| Land and Ocean | +0.94 ± 0.16 | +1.69 ± 0.29 | Warmest | 2nd | 2015 | +1.00 | +1.80 |
| Coolest | 139th | 1912 | -0.50 | -0.90 | |||
| Northern Hemisphere | |||||||
| Land | +1.35 ± 0.22 | +2.43 ± 0.40 | Warmest | 4th | 2005 | +1.41 | +2.54 |
| Coolest | 137th | 1912 | -0.96 | -1.73 | |||
| Ocean | +1.06 ± 0.15 | +1.91 ± 0.27 | Warmest | 2nd | 2015 | +1.11 | +2.00 |
| Coolest | 139th | 1912 | -0.54 | -0.97 | |||
| Land and Ocean | +1.17 ± 0.18 | +2.11 ± 0.32 | Warmest | 2nd | 2015 | +1.21 | +2.18 |
| Coolest | 139th | 1912 | -0.71 | -1.28 | |||
| Southern Hemisphere | |||||||
| Land | +1.40 ± 0.15 | +2.52 ± 0.27 | Warmest | 1st | 2019 | +1.40 | +2.52 |
| Coolest | 140th | 1880 | -0.64 | -1.15 | |||
| Ocean | +0.56 ± 0.16 | +1.01 ± 0.29 | Warmest | 5th | 2015 | +0.67 | +1.21 |
| Coolest | 136th | 1903, 1908 | -0.44 | -0.79 | |||
| Land and Ocean | +0.70 ± 0.15 | +1.26 ± 0.27 | Warmest | 2nd | 2015 | +0.78 | +1.40 |
| Coolest | 139th | 1903 | -0.45 | -0.81 | |||
| Ties: 2018 | |||||||
| Arctic | |||||||
| Land and Ocean | +1.93 ± 0.37 | +3.47 ± 0.67 | Warmest | 1st | 2019 | +1.93 | +3.47 |
| Coolest | 140th | 1902 | -1.51 | -2.72 | |||
Year-to-date Temperature: January–November 2019
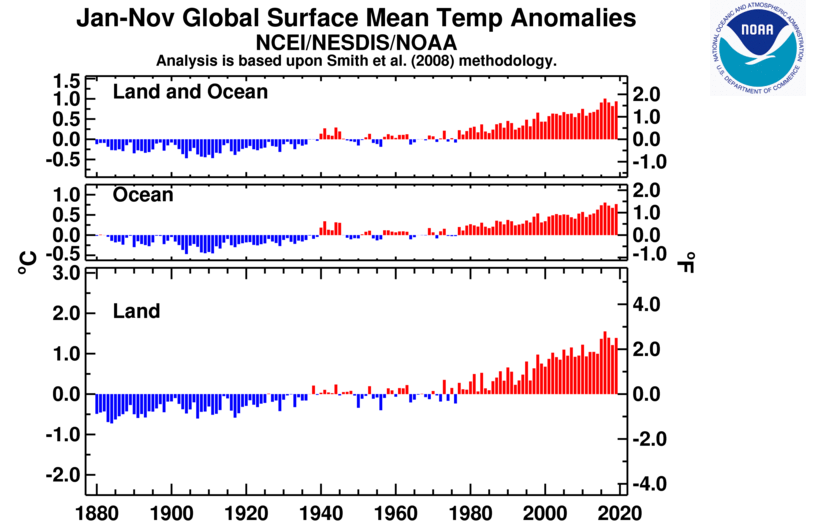
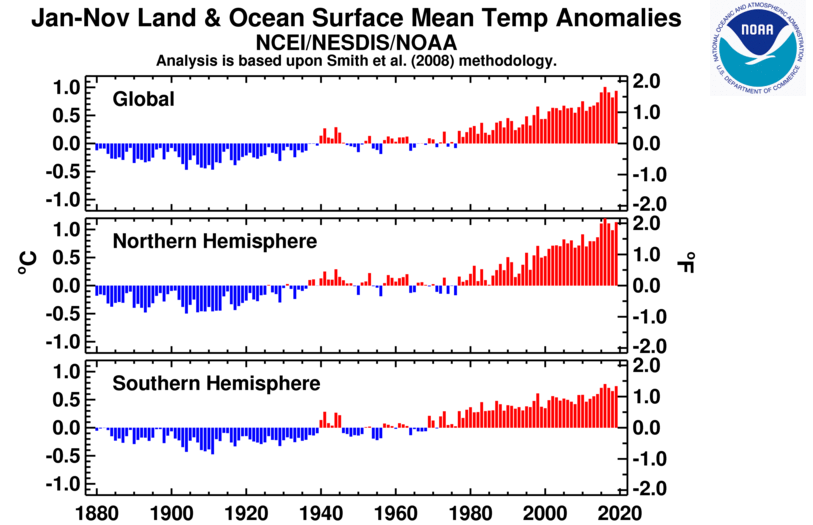
The January–November 2019 global land and ocean surface temperature was 0.94°C (1.69°F) above average and the second warmest such period since global records began in 1880. This value is 0.07°C (0.13°F) less than the record set in 2016.

The year-to-date global land-only surface temperature was the third highest such period on record at 1.39°C (2.50°F) above average. This value falls behind 2016 and 2017. The global ocean-only temperature for January–November 2019 was the second warmest on record at 0.77°C (1.39°F) above average. Only January–November of 2016 was warmer.
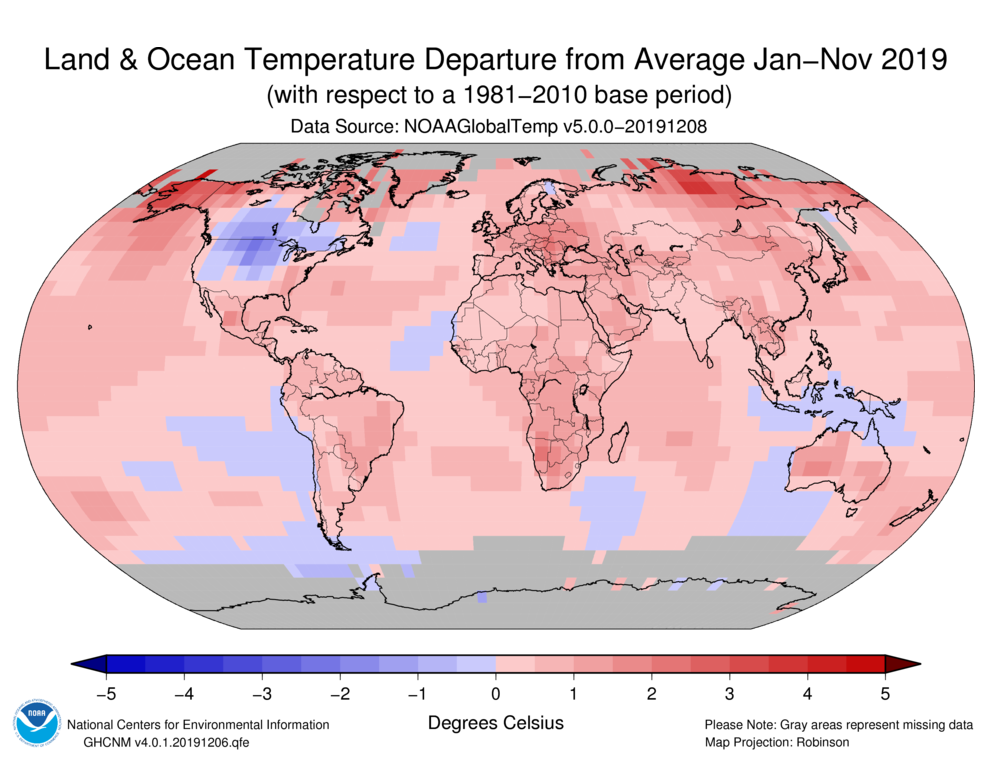
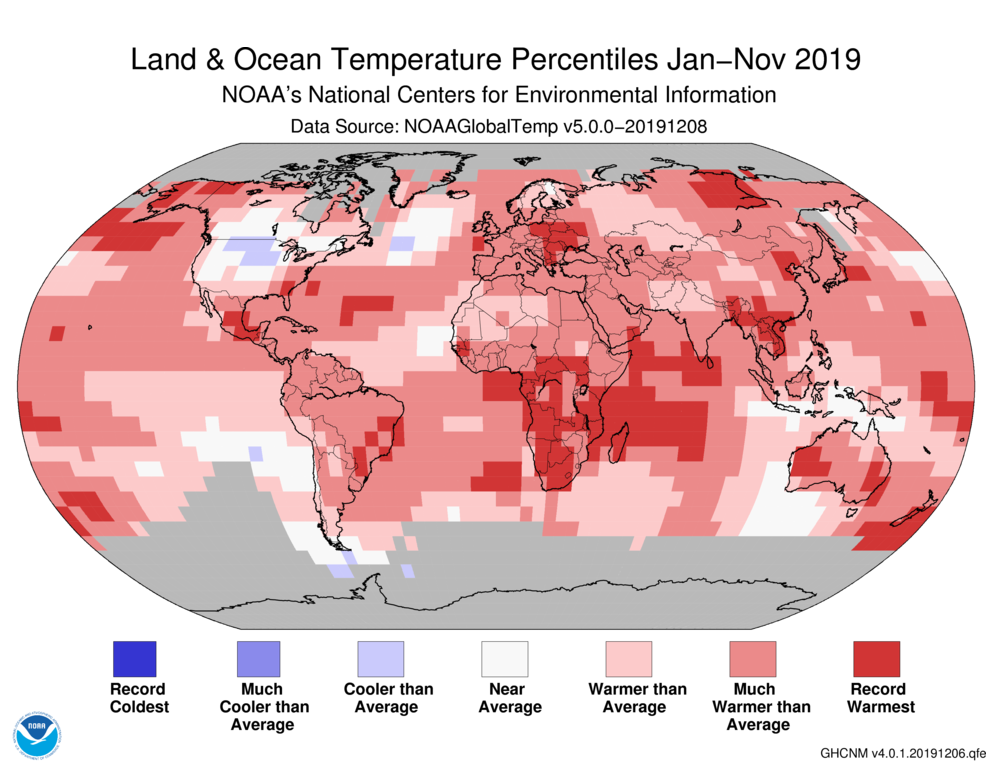
Record-warm temperatures during the year-to-date period were present across parts of North America, South America, Europe, the southern half of Africa, northern and southern Asia, Australia, and New Zealand. Across the oceans, record-warm year-to-date temperatures were present across parts of northern and southwestern Pacific Ocean, the Atlantic Ocean, and the western Indian Ocean. No land or ocean areas had record-cold temperatures during January–November 2019.
Regionally, South America, Europe, Africa, Asia, Oceania, the Gulf of Mexico, and the Hawaiian region had a January–November 2019 temperature departure from average that ranked among the three highest such periods on record.
Select national information is highlighted below. Please note that different countries report anomalies with respect to different base periods. The information provided here is based directly upon these data:
- According to Meteo France, the national year-to-date temperature anomaly for France exceeded +1.0°C (+1.8°F) and was the third highest January–November period since national records began in 1900. Only January–November of 2018 and 2014 were warmer.
- Australia had its warmest maximum temperature, seventh warmest minimum, and second warmest mean temperature for January–November 2019.
| January–November | Anomaly | Rank (out of 140 years) | Records | ||||
|---|---|---|---|---|---|---|---|
| °C | °F | Year(s) | °C | °F | |||
| Global | |||||||
| Land | +1.39 ± 0.15 | +2.50 ± 0.27 | Warmest | 3rd | 2016 | +1.55 | +2.79 |
| Coolest | 138th | 1884 | -0.73 | -1.31 | |||
| Ocean | +0.77 ± 0.17 | +1.39 ± 0.31 | Warmest | 2nd | 2016 | +0.80 | +1.44 |
| Coolest | 139th | 1904 | -0.47 | -0.85 | |||
| Land and Ocean | +0.94 ± 0.16 | +1.69 ± 0.29 | Warmest | 2nd | 2016 | +1.01 | +1.82 |
| Coolest | 139th | 1904, 1911 | -0.47 | -0.85 | |||
| Northern Hemisphere | |||||||
| Land | +1.42 ± 0.18 | +2.56 ± 0.32 | Warmest | 4th | 2016 | +1.70 | +3.06 |
| Coolest | 137th | 1884 | -0.83 | -1.49 | |||
| Ocean | +0.95 ± 0.17 | +1.71 ± 0.31 | Warmest | 1st | 2019 | +0.95 | +1.71 |
| Coolest | 140th | 1904 | -0.51 | -0.92 | |||
| Land and Ocean | +1.13 ± 0.16 | +2.03 ± 0.29 | Warmest | 2nd | 2016 | +1.23 | +2.21 |
| Coolest | 139th | 1904 | -0.50 | -0.90 | |||
| Southern Hemisphere | |||||||
| Land | +1.31 ± 0.12 | +2.36 ± 0.22 | Warmest | 1st | 2019 | +1.31 | +2.36 |
| Coolest | 140th | 1917 | -0.76 | -1.37 | |||
| Ocean | +0.63 ± 0.17 | +1.13 ± 0.31 | Warmest | 2nd | 2016 | +0.71 | +1.28 |
| Coolest | 139th | 1911 | -0.45 | -0.81 | |||
| Ties: 2017 | |||||||
| Land and Ocean | +0.74 ± 0.17 | +1.33 ± 0.31 | Warmest | 2nd | 2016 | +0.78 | +1.40 |
| Coolest | 139th | 1911 | -0.47 | -0.85 | |||
| Arctic | |||||||
| Land and Ocean | +2.16 ± 0.16 | +3.89 ± 0.29 | Warmest | 2nd | 2016 | +2.44 | +4.39 |
| Coolest | 139th | 1902 | -1.37 | -2.47 | |||
References
- Menne, M. J., C. N. Williams, B.E. Gleason, J. J Rennie, and J. H. Lawrimore, 2018: The Global Historical Climatology Network Monthly Temperature Dataset, Version 4. J. Climate, in press. https://doi.org/10.1175/JCLI-D-18-0094.1.
- Huang, B., Peter W. Thorne, et. al, 2017: Extended Reconstructed Sea Surface Temperature version 5 (ERSSTv5), Upgrades, validations, and intercomparisons. J. Climate, doi: 10.1175/JCLI-D-16-0836.1
- Peterson, T.C. and R.S. Vose, 1997: An Overview of the Global Historical Climatology Network Database. Bull. Amer. Meteorol. Soc., 78, 2837-2849.
- Huang, B., V.F. Banzon, E. Freeman, J. Lawrimore, W. Liu, T.C. Peterson, T.M. Smith, P.W. Thorne, S.D. Woodruff, and H-M. Zhang, 2016: Extended Reconstructed Sea Surface Temperature Version 4 (ERSST.v4). Part I: Upgrades and Intercomparisons. J. Climate, 28, 911-930.