Introduction
Temperature anomalies and percentiles are shown on the gridded maps below. The anomaly map on the left is a product of a merged land surface temperature (Global Historical Climatology Network, GHCN) and sea surface temperature (ERSST.v4) anomaly analysis as described in Huang et al. (2016). Temperature anomalies for land and ocean are analyzed separately and then merged to form the global analysis. For more information, please visit NCEI's Global Surface Temperature Anomalies page. The percentile map on the right provides additional information by placing the temperature anomaly observed for a specific place and time period into historical perspective, showing how the most current month, season or year compares with the past.
Temperatures
In the atmosphere, 500-millibar height pressure anomalies correlate well with temperatures at the Earth's surface. The average position of the upper-level ridges of high pressure and troughs of low pressure—depicted by positive and negative 500-millibar height anomalies on the  March 2018 and
  January–March 2018 maps—is generally reflected by areas of positive and negative temperature anomalies at the surface, respectively.
March
March 2018 was characterized by warmer-than-average conditions across much of the world's surface. However, temperature departures from average varied greatly across the Northern Hemisphere land. Warmer-than-average conditions were present across Alaska, northern and eastern Canada, South America, Africa, Australia and much of Asia. Record warmth was observed across parts of eastern Africa, the Middle East, and southern Asia, which corresponds with the locations that had the most notable warm temperature departures from average (+3.0°C [+5.4°F] or higher) during the month. Near- to cooler-than-average conditions were present across much of the contiguous U.S., southwestern Canada, Europe, and western and northern Russia. Across the oceans, record warmth was observed scattered across all oceans, while cooler-than-average conditions were limited to the North Atlantic Ocean, central and eastern tropical as well as southeastern Pacific Ocean, and across parts of the eastern Indian Ocean. No land or ocean areas experienced record cold temperatures during March 2018.
Overall, the combined global land and ocean temperature for March 2018 was 0.83°C (1.49°F) above the 20th century average of 12.7°C (54.9°F) and the fifth highest March temperature departure from average in the 139-year record. This value was also 0.40°C (0.72°F) cooler than the record high set in 2016 and was the smallest temperature departure from average in the last four years. The years 2015–17 are the three warmest Marches on record. March 2018 also marks the 42nd consecutive March and the 399th consecutive month with temperatures, at least nominally, above the 20th century average. March 2018 also had the highest monthly temperature departure from average since July 2017. The March global land and ocean surface temperature has increased 0.08°C (0.14°F) per decade since 1880. That rate is more than double since 1980.
The global land surface temperature for March 2018 was 1.49°C (2.68°F) above average and the seventh highest since global records began in 1880. The global oceans ranked as the fifth highest on record at 0.58°C (1.04°F) above average. Regionally, three of the six continents had a top ten warm March on record. Europe and Asia had their coldest March since 2013.
Select national information is highlighted below. Please note that different countries report anomalies with respect to different base periods. The information provided here is based directly upon these data:
- Cooler-than-average conditions engulfed much of Europe and western Russia during March 2018. Austria, Finland, Sweden, and the United Kingdom experienced their coolest March since 2013. Temperature departures across Austria, Finland, and Sweden were 1.5°–5.0°C (2.7°–9.0°F) below average. March 2018 temperatures across Ireland were 2.0°–3.0°C (3.6°–5.4°F) below average. The Valentia Observatory and Skerkin Island (Irish stations) had their coldest March since 1962 and 1975, respectively. Spain also had below-average temperatures, resulting in a national temperature that was 1.3°C (2.3°F) below the 1981–2010 average and the 16th coldest March since national records began in 1965. The station located in the León - Virgen del Camino observed an average maximum temperature of 8.6°C (47.5°F)—the lowest for March since its records began in 1938.
- While Europe was reeling in cold temperatures, much of central and southern Asia was experiencing much-above-average conditions during March. According to Meteo France, at least seven countries (Iraq, United Arab Emirates, Qatar, Turkmenistan, Pakistan, Uzbekistan, and Tajikistan) set new national March temperature records. Temperatures during March 2018 were 9.0°–12.0°C (16.2°–21.6°F) above average and were similar to temperatures observed typically at the end of May or early June. Asia set a new continental maximum temperature record when temperatures across Pakistan soared to 45.5°C (81.9°F), surpassing the previous continental record set in India by 0.1°C (0.2°F). Hong Kong, China also had warmer-than-average conditions during the month, with a temperature departure from average of 1.7°C (3.1°F) above average and ranked among the four highest March temperatures on record.
- Bahrain's March 2018 mean temperature was 24.6°C (76.3°F), which is 3.6°C (6.5°F) above average and resulting in the highest mean temperature for March since national records began in 1902. The previous record of 24.2°C (75.6°F) was set in 1969. The nation's mean maximum temperature was 4.9°C (8.8°F) above average and the highest for March since 1946, surpassing the previous record set in 1969 and again in 2008 by +0.8°C (+1.4°F). On March 30th, Bahrain International Airport recorded a maximum temperature of 37.6°C (99.7°F)—the third highest daily maximum temperature for March since 1946, behind 29 March 1998 (38.1°C / 100.6°F) and 19 March 1966 (38.0°C / 100.4°F). As for minimum temperatures, the national minimum temperature for March was 2.9°C (5.2°F) above average, tying with 1969 as the highest on record.
- Australia also experienced warmer-than-average conditions during March 2018, resulting in the ninth warmest March (tied) since national records began in 1910 at 0.97°C (1.75°F) above the 1961–90 average. Regionally, New South Wales and Western Australia had their top eight warmest March on record.
- Above to much-above-average temperatures were present across much of New Zealand during March 2018, with isolated parts of Tasman and Southland having near-average conditions. March 2018 was the sixth warmest March for New Zealand since national records began in 1909 at 1.3°C (2.3°F) above the 1981–2010 average. Several locations across New Zealand had their warmest March on record, with many other locations experiencing near-record temperatures. Of note, the town of Akaroa (southeast Christchurch) had a mean temperature departure from average of 2.4°C (4.3°F) above average, surpassing the previous record set in 1978.
La Niña was present across the tropical Pacific Ocean, however it weakened during March 2018. According to NOAA's Climate Prediction Center, a transition from La Niña to ENSO-neutral is likely (~55% chance) during March–May. This forecast focuses on the ocean surface temperatures between 5°N and 5°S latitude and 170°W to 120°W longitude, called the Niño 3.4 region.
| March | Anomaly | Rank (out of 139 years) | Records | ||||
|---|---|---|---|---|---|---|---|
| °C | °F | Year(s) | °C | °F | |||
| Global | |||||||
| Land | +1.49 ± 0.11 | +2.68 ± 0.20 | Warmest | 7th | 2016 | +2.36 | +4.25 |
| Coolest | 133rd | 1898 | -1.57 | -2.83 | |||
| Ocean | +0.58 ± 0.14 | +1.04 ± 0.25 | Warmest | 5th | 2016 | +0.82 | +1.48 |
| Coolest | 135th | 1911 | -0.51 | -0.92 | |||
| Land and Ocean | +0.83 ± 0.14 | +1.49 ± 0.25 | Warmest | 5th | 2016 | +1.23 | +2.21 |
| Coolest | 135th | 1898 | -0.65 | -1.17 | |||
| Northern Hemisphere | |||||||
| Land | +1.75 ± 0.19 | +3.15 ± 0.34 | Warmest | 6th | 2016 | +2.74 | +4.93 |
| Coolest | 134th | 1898 | -1.97 | -3.55 | |||
| Ocean | +0.67 ± 0.13 | +1.21 ± 0.23 | Warmest | 3rd | 2016 | +0.81 | +1.46 |
| Coolest | 137th | 1909 | -0.52 | -0.94 | |||
| Ties: 2015 | |||||||
| Land and Ocean | +1.08 ± 0.13 | +1.94 ± 0.23 | Warmest | 5th | 2016 | +1.55 | +2.79 |
| Coolest | 135th | 1898 | -0.88 | -1.58 | |||
| Southern Hemisphere | |||||||
| Land | +0.82 ± 0.13 | +1.48 ± 0.23 | Warmest | 13th | 2016 | +1.38 | +2.48 |
| Coolest | 127th | 1904 | -0.90 | -1.62 | |||
| Ties: 1999 | |||||||
| Ocean | +0.52 ± 0.15 | +0.94 ± 0.27 | Warmest | 9th | 2016 | +0.83 | +1.49 |
| Coolest | 131st | 1911 | -0.56 | -1.01 | |||
| Land and Ocean | +0.56 ± 0.14 | +1.01 ± 0.25 | Warmest | 9th | 2016 | +0.91 | +1.64 |
| Coolest | 131st | 1911 | -0.57 | -1.03 | |||
| Ties: 2014 | |||||||
| Arctic | |||||||
| Land and Ocean | +0.71 ± 0.31 | +1.28 ± 0.56 | Warmest | 41st | 2017 | +3.70 | +6.66 |
| Coolest | 99th | 1902 | -3.52 | -6.34 | |||
| Ties: 2006 | |||||||
The most current data can be accessed via the Global Surface Temperature Anomalies page.
Year-to-date (January–March)
Globally, the average land and ocean surface temperature for January–March 2018 was the sixth highest such period since global records began in 1880 at 0.74°C (1.33°F) above the 20th century average of 12.3°C (54.1°F). The 2018 year-to-date value was 0.43°C (0.77°F) lower than the record high set in 2016 and was the coolest such period in the last four years. The years 2015–17 represent the three warmest January–March on record. The first three months of the year were characterized by warmer-than-average conditions across much of the world's surface, with record warmth across New Zealand and its surrounding ocean, and scattered across Far East Russia, southern Asia, southern Australia, and across all oceans. Near- to cooler-than-average conditions were present across the western half of Canada, the eastern half of the contiguous U.S., Europe, western Russia, the central and eastern tropical Pacific Ocean, as well as southeastern Pacific Ocean, and across the Atlantic and Indian Ocean. However, no land or ocean areas had record cold temperatures during January–March 2018. Regionally, Africa, Asia, and Oceania had a top nine warm January–March since continental records began in 1910. Europe had its coldest such period in five years.
The January–March 2018 global land surface temperature was also the smallest in the last four years and the sixth highest in the 139-year record at 1.21°C (2.18°F) above the 20th century average. The global ocean temperature for the first three months of the year was also the smallest since 2014 and the fifth highest on record at 0.56°C (1.01°F) above average.
New Zealand's January–March 2018 average temperature was 1.75°C (3.15°F) above the 1981–2010 average and was the warmest such period in the nation's 110-year record, besting the previous record set in 1998 by +0.24°C (+0.43°F).
| January–March | Anomaly | Rank (out of 139 years) | Records | ||||
|---|---|---|---|---|---|---|---|
| °C | °F | Year(s) | °C | °F | |||
| Global | |||||||
| Land | +1.21 ± 0.16 | +2.18 ± 0.29 | Warmest | 6th | 2016 | +2.08 | +3.74 |
| Coolest | 134th | 1893 | -1.29 | -2.32 | |||
| Ocean | +0.56 ± 0.15 | +1.01 ± 0.27 | Warmest | 5th | 2016 | +0.83 | +1.49 |
| Coolest | 135th | 1911 | -0.49 | -0.88 | |||
| Land and Ocean | +0.74 ± 0.16 | +1.33 ± 0.29 | Warmest | 6th | 2016 | +1.17 | +2.11 |
| Coolest | 134th | 1911 | -0.54 | -0.97 | |||
| Northern Hemisphere | |||||||
| Land | +1.33 ± 0.21 | +2.39 ± 0.38 | Warmest | 7th | 2016 | +2.38 | +4.28 |
| Coolest | 133rd | 1893 | -1.59 | -2.86 | |||
| Ocean | +0.66 ± 0.15 | +1.19 ± 0.27 | Warmest | 4th | 2016 | +0.88 | +1.58 |
| Coolest | 136th | 1909 | -0.46 | -0.83 | |||
| Land and Ocean | +0.92 ± 0.17 | +1.66 ± 0.31 | Warmest | 6th | 2016 | +1.45 | +2.61 |
| Coolest | 134th | 1893 | -0.86 | -1.55 | |||
| Southern Hemisphere | |||||||
| Land | +0.91 ± 0.14 | +1.64 ± 0.25 | Warmest | 9th | 2016 | +1.33 | +2.39 |
| Coolest | 131st | 1904 | -0.90 | -1.62 | |||
| Ocean | +0.48 ± 0.16 | +0.86 ± 0.29 | Warmest | 12th | 2016 | +0.80 | +1.44 |
| Coolest | 128th | 1911 | -0.51 | -0.92 | |||
| Land and Ocean | +0.55 ± 0.15 | +0.99 ± 0.27 | Warmest | 7th | 2016 | +0.88 | +1.58 |
| Coolest | 133rd | 1911 | -0.53 | -0.95 | |||
| Ties: 2014 | |||||||
| Arctic | |||||||
| Land and Ocean | +1.50 ± 0.35 | +2.70 ± 0.63 | Warmest | 13th | 2016 | +3.22 | +5.80 |
| Coolest | 127th | 1966 | -2.49 | -4.48 | |||

The most current data can be accessed via the Global Surface Temperature Anomalies page.
Precipitation
March
The maps below represent precipitation percent of normal (left, using a base period of 1961–90) and precipitation percentiles (right, using the period of record) based on the GHCN dataset of land surface stations. As is typical, precipitation anomalies varied significantly around the world. Precipitation during March 2018 was generally drier than normal across Argentina, the southern half of Australia, north-central Europe, southern Asia, and across parts of the eastern half of the contiguous U.S. Wetter-than-normal conditions were notable across much of Europe, northern Asia, South Korea, Japan, Alaska, and across parts of the northeastern and south-central contiguous U.S.
Select national information is highlighted below. (Please note that different countries report anomalies with respect to different base periods. The information provided here is based directly upon these data):
- Wetter-than-average conditions were present across much of Spain during March 2018. Averaged as a whole, the nation had 163.0 mm (6.4 inches) of total precipitation for the month, which is 347%, or over triple, the normal March precipitation total. This was the second wettest March since national records began in 1965, trailing behind 2013 by only 3.0 mm (0.12 inch). Several stations across the nation had their wettest March on record.
- France had above-average precipitation during the month at 160% of normal precipitation, with its Mediterranean region receiving 2–4 times March's normal precipitation, and in some locations over 5 times the month's normal precipitation totals. Some locations had near-record precipitation totals, such as Provence - Alpes - Cote d'Azur and Corsica, which had their second wettest March on record, behind 2013.
- Drier-than-average conditions plagued much of Argentina during March 2018, resulting in the ninth driest March since national records began in 1961. The national March 2018 precipitation total was 26.7% below the 1961–90 average. In the last fifteen years, only three years (2007, 2014, and 2017 [wettest year on record]) had above average conditions.
- Precipitation varied across Australia, however, when averaged as a whole, the national average precipitation total was near average for March 2018. Regionally, Queensland had the highest positive precipitation departure from average at 68% above average, while South Australia had the lowest departure from average at 67% below average.
- Precipitation varied greatly across New Zealand during March. No new March rainfall records were set, but a few stations had near-record precipitation totals. On the wet side, Ranruly and Lower Retaruke had their second wettest March since records began in 1897 and 1966, respectively. On the dry side, South West Cap had the third driest March since records began in 1991.
Ocean Heat Content
Ocean Heat Content (OHC) is essential for understanding and modeling global climate since > 90% of excess heat in the Earth's system is absorbed by the ocean. Further, expansion due to increased ocean heat contributes to sea level rise. Change in OHC is calculated from the difference of observed temperature profiles from the long-term mean.
| Basin | 0-700 meters | Rank (1955-2023) | |||||
|---|---|---|---|---|---|---|
| Entire Basin | Northern Hemisphere | Southern Hemisphere | ||||
| Atlantic | 7.952 | 5th | 4.413 | 6th | 3.539 | 5th |
| Indian | 2.829 | 13th | 0.350 | 17th | 2.479 | 11th |
| Pacific | 6.699 | 7th | 3.644 | 4th | 3.055 | 8th |
| World | 17.504 | 6th | 8.431 | 6th | 9.073 | 7th |
| Source: Basin time series of heat content | ||||||

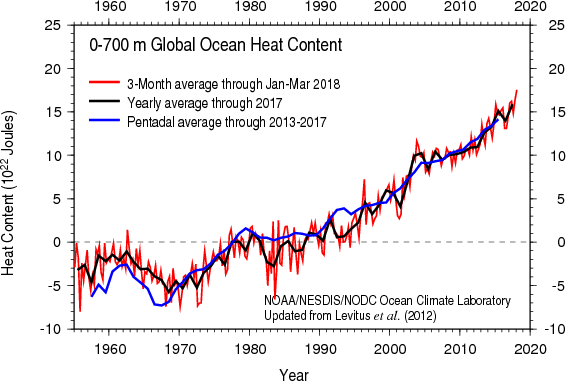
Global OHC for January–March 2018 was the highest January–March OHC in our records, which extend back to 1955; it was, in fact, the highest global OHC for all quarters in the record. Overall, the latest quarterly OHC reveals widespread warmer than normal conditions, a situation observed since the end of 2016. As in the previous quarter, much higher, > 30x10^5 J/m^3, than long-term mean OHC conditions are remarkable at northern high latitudes, i.e. in the Greenland Sea, Norwegian Sea, Barents Sea, and in Baffin Bay. Similarly, much higher than normal OHC is also observed in the Gulf Stream/North Atlantic Current, the Brazil Current, the Gulf of Mexico and the Caribbean Sea, and off the tip of the Antarctic Peninsula. Cooler than normal conditions, < -20x10^5 J/m^3, persist in the subpolar North Atlantic Ocean south of Greenland and Iceland, the central South Pacific Ocean, and the western Equatorial and South Indian Ocean. The cool signal extending westward from the South America coast around the Equator is weaker, with OHC < -5x10^5 J/m^3, than in October-December 2017. Much cooler than normal conditions, < -30x10^5 J/m^3, appear along the southeastern coast of Japan.
References
- Peterson, T.C. and R.S. Vose, 1997: An Overview of the Global Historical Climatology Network Database. Bull. Amer. Meteorol. Soc., 78, 2837-2849.
- Huang, B., V.F. Banzon, E. Freeman, J. Lawrimore, W. Liu, T.C. Peterson, T.M. Smith, P.W. Thorne, S.D. Woodruff, and H-M. Zhang, 2016: Extended Reconstructed Sea Surface Temperature Version 4 (ERSST.v4). Part I: Upgrades and Intercomparisons. J. Climate, 28, 911-930.