Introduction
Temperature anomalies and percentiles are shown on the gridded maps below. The anomaly map on the left is a product of a merged land surface temperature (Global Historical Climatology Network, GHCN) and sea surface temperature (ERSST.v4) anomaly analysis as described in Huang et al. (2016). Temperature anomalies for land and ocean are analyzed separately and then merged to form the global analysis. For more information, please visit NCDC's Global Surface Temperature Anomalies page. The percentile map on the right provides additional information by placing the temperature anomaly observed for a specific place and time period into historical perspective, showing how the most current month, season or year compares with the past.
Supplemental June 2016 Information
- Top 15 Monthly Global Land and Ocean Temperature Departures
- 2016 Year-to-date Temperature versus Previous Years
Temperatures
In the atmosphere, 500-millibar height pressure anomalies correlate well with temperatures at the Earth's surface. The average position of the upper-level ridges of high pressure and troughs of low pressure—depicted by positive and negative 500-millibar height anomalies on the  June 2016 map—is generally reflected by areas of positive and negative temperature anomalies at the surface, respectively.
June

Warmer to much-warmer-than-average conditions dominated across much of the globe's surface, resulting in the highest temperature departure for June since global temperature records began in 1880. This was also the 14th consecutive month the monthly global temperature record has been broken—the longest such streak in NOAA's 137 years of record keeping. The June 2016 combined average temperature over global land and ocean surfaces was 0.90°C (1.62°F) above the 20th century average, besting the previous record set in 2015 by 0.02°C (0.04°F). June 2016 marks the 40th consecutive June with temperatures at least nominally above the 20th century average. The last time June global land and ocean temperatures were below average was in 1976 (-0.07°C / -0.13°F). June 2016 tied with March 2015 as the ninth highest monthly temperature departure among all months (1,638) on record. Overall, 14 of the 15 highest monthly temperature departures in the record have all occurred since February 2015, with January 2007 among the 15 highest monthly temperature departures. June 2016 also marks the 378th consecutive month with temperatures at least nominally above the 20th century average. The last month with temperatures below the 20th century average was December 1984 (-0.09°C / -0.16°F).
The majority of the world's land surface had warmer to much-warmer-than-average temperatures during June 2016, with the largest temperature departures observed across much of north-central Russia, the Russian Far East, and northern Australia where temperature departures were 3.0°C (5.4°F) or higher. Record warmth was sporadically across parts of the southwestern contiguous U.S., southern Mexico, northeastern Brazil, northeastern and southwestern Africa, the Middle East, northern Australia, and Indonesia. The only land area with cooler-than-average conditions during June 2016, according to the percentiles map, was central and southern South America. No land areas had a record cold temperature during June 2016. According to NCEI's Global Regional Analysis, five of six continents had at least a top five warm June, with North America observing a record high average temperature for June.
Averaged as a whole, the global temperature across land surfaces for June 2016 was 1.24°C (2.23°F) above the 20th century average—tying with 2015 as the highest June temperature in the 1880–2016 record. June 2016 marks the 34th consecutive June with temperatures at least nominally above average. The last time global land surface temperatures were below average in June was in 1982 (-0.05°C / -0.09°F).
Select national information is highlighted below. (Please note that different countries report anomalies with respect to different base periods. The information provided here is based directly upon these data):
- Australia's mean temperature during June 2016 was 1.30°C (2.34°F) above the 1961–1990 average, the sixth highest June temperature since national temperature records began in 1910. Minimum temperatures were much warmer than average, while maximum temperatures were near average. The nationally-averaged minimum temperature was 2.22°C (4.00°F) above average—the fourth highest June minimum temperature on record.
- The June 2016 mean temperature across the United Kingdom was 13.9°C (57.0°F) or 0.9°C (1.6°F) above the 1981–2010 average. The warmer-than-average value was mainly driven by extremely warm nighttime temperatures. The nation's averaged minimum temperature tied as the highest since national records began in 1910. Regionally, England and Wales also had the highest (or joint highest) average minimum temperature since 1910.
- New Zealand's average temperature during June 2016 was 10.2°C (50.4°F), which is 1.6°C (2.9°F) above the 1981–2010 average—the third highest June temperature departure from average since national records began in 1909. According to New Zealand's National Climate Centre, the cities of Christchurch and Dunedin had their highest June temperature on record.
- Extremely hot conditions plagued Hong Kong, China during most of June. Maximum temperatures above 35.0°C (95.0°F) affected the region for four consecutive days during 24–27 June, surpassing the previous record of three consecutive days (30 May–1 June 1963) of maximum temperatures above 35°C (95°F). The highest daily maximum temperature recorded in June 2016 was 35.5°C (95.9°F) on 25 June 2016—the second highest maximum temperature in June since records began in 1884. The monthly mean temperature for Hong Kong was 1.5°C (2.7°F) above the 1981–2010 average and the second highest mean temperature for June.
- Warmer-than-average temperatures were observed across Spain during June 2016. The national average temperature was 0.7°C (1.26°F) above the 1981–2010 average. This was the tenth highest June temperature since 1965.
- According to the Centro Internacional para la Investigación del Fenómeno de El Niño (CIIFEN), the average monthly temperature along much of the western coast of South America continued to be predominantly above average, with temperature departures from average as high as 2.0°C (3.6°F) in Colombia; while the interior of South America (Bolivia and Paraguay) had below average temperatures (-1.0°C / -1.8°F).
The worldwide ocean surface temperature during June 2016 was 0.77°C (1.39°F) above the 20th century average, the highest global ocean temperature for June in the 137-year record. This value surpassed the previous record set in 2015 by 0.03°C (0.05°F). June 2016 was the 10th highest departure from average among all 1,638 months in the record. June 2016 marks the 40th consecutive June with global ocean temperatures at least nominally above the 20th century average. The 12 highest monthly global ocean temperature departures have all occurred in the past 12 months.
According to the percentiles map, much warmer-than-average temperatures engulfed most of the world's oceans during June 2016, with record high sea surface temperatures across parts of the central and southwest Pacific Ocean, northwestern and southwestern Atlantic Ocean, and across parts of the northeastern Indian Ocean. Meanwhile, near to cooler-than-average conditions were limited across the northern Atlantic Ocean, northern Pacific Ocean and parts of the southern Oceans. The only ocean area with record cold temperatures was east of the Drake Passage off the southern tip of South America.
ENSO neutral conditions (neither El Niño nor La Niña) prevailed across the tropical Pacific Ocean during June 2016. According to NOAA's Climate Prediction Center, La Niña is favored to develop during August–October 2016, with about 55–60 percent chance of La Niña during the Northern Hemisphere fall and winter 2016–17. This forecast focuses on the ocean surface temperatures between 5°N and 5°S latitude and 170°W to 120°W longitude, called the Niño 3.4 region.
| June | Anomaly | Rank (out of 137 years) | Records | ||||
|---|---|---|---|---|---|---|---|
| °C | °F | Year(s) | °C | °F | |||
| Global | |||||||
| Land | +1.24 ± 0.13 | +2.23 ± 0.23 | Warmest | 1st | 2015, 2016 | +1.24 | +2.23 |
| Coolest | 137th | 1907 | -0.65 | -1.17 | |||
| Ties: 2015 | |||||||
| Ocean | +0.77 ± 0.14 | +1.39 ± 0.25 | Warmest | 1st | 2016 | +0.77 | +1.39 |
| Coolest | 137th | 1911 | -0.48 | -0.86 | |||
| Land and Ocean | +0.90 ± 0.14 | +1.62 ± 0.25 | Warmest | 1st | 2016 | +0.90 | +1.62 |
| Coolest | 137th | 1904, 1911 | -0.44 | -0.79 | |||
| Northern Hemisphere | |||||||
| Land | +1.37 ± 0.13 | +2.47 ± 0.23 | Warmest | 2nd | 2012 | +1.41 | +2.54 |
| Coolest | 136th | 1907 | -0.72 | -1.30 | |||
| Ocean | +0.87 ± 0.14 | +1.57 ± 0.25 | Warmest | 2nd | 2015 | +0.89 | +1.60 |
| Coolest | 136th | 1913 | -0.53 | -0.95 | |||
| Land and Ocean | +1.06 ± 0.15 | +1.91 ± 0.27 | Warmest | 1st | 2016 | +1.06 | +1.91 |
| Coolest | 137th | 1913 | -0.51 | -0.92 | |||
| Southern Hemisphere | |||||||
| Land | +0.90 ± 0.15 | +1.62 ± 0.27 | Warmest | 6th | 2005 | +1.20 | +2.16 |
| Coolest | 132nd | 1911 | -0.98 | -1.76 | |||
| Ties: 2009 | |||||||
| Ocean | +0.70 ± 0.14 | +1.26 ± 0.25 | Warmest | 1st | 2016 | +0.70 | +1.26 |
| Coolest | 137th | 1911 | -0.53 | -0.95 | |||
| Land and Ocean | +0.73 ± 0.14 | +1.31 ± 0.25 | Warmest | 1st | 2016 | +0.73 | +1.31 |
| Coolest | 137th | 1911 | -0.60 | -1.08 | |||
| Arctic | |||||||
| Land and Ocean | +1.76 ± 0.19 | +3.17 ± 0.34 | Warmest | 1st | 2016 | +1.76 | +3.17 |
| Coolest | 137th | 1885 | -1.33 | -2.39 | |||

The most current data can be accessed via the Global Surface Temperature Anomalies page.
Year-to-date (January–June)


Six record warm monthly global temperatures during the first half of 2016 resulted in the highest global land and ocean average temperature for January–June at 1.05°C (1.89°F) above the 20th century average, besting the previous record set in 2015 by 0.20°C (0.36°F).
January–June 2016 was characterized by warmer to much-warmer-than-average conditions engulfing most of the world's land and ocean surfaces. Record warmth was widespread across Alaska, western Canada, southern Mexico, northern South America, central Africa, Indonesia, northern and eastern Australia, North Indian Ocean, and across parts of north-central Russia, western Asia, central and eastern tropical Pacific Ocean, the southwestern Pacific Ocean, and the northwestern Atlantic Ocean. Near to much cooler-than-average temperatures were observed across the northwestern Pacific Ocean, northern Atlantic Ocean (south of Greenland), and parts of the southern oceans. The only area with record cold temperatures was east of the Drake Passage off the southern tip of South America.
According to NCEI's Global Regional analysis, all six continents had at least a top three warm January–June period, with North America and Oceania having a record high January–June average temperature since continental records began in 1910. Averaged globally, the January–June 2016 global land surface temperature was 1.76°C (3.17°F) above the 20th century average—the highest temperature departure from average for January–June in the 1880–2016 record. This value surpassed the previous record set in 2015 by 0.39°C (0.70°F). The global oceans temperature during the first half of 2016 was 0.79°C (1.42°F), also the highest temperature departure from average for January–June in the 137-year record, exceeding the previous record set in 2015 by 0.14°C (0.25°F).
Select national information is highlighted below. (Please note that different countries report anomalies with respect to different base periods. The information provided here is based directly upon these data):
- New Zealand's January–June 2016 average temperature was 1.4°C (2.5°F) above the 1981–2010 average and the warmest such period since national records began in 1909.
| January–June | Anomaly | Rank (out of 137 years) | Records | ||||
|---|---|---|---|---|---|---|---|
| °C | °F | Year(s) | °C | °F | |||
| Global | |||||||
| Land | +1.76 ± 0.15 | +3.17 ± 0.27 | Warmest | 1st | 2016 | +1.76 | +3.17 |
| Coolest | 137th | 1893 | -0.87 | -1.57 | |||
| Ocean | +0.79 ± 0.17 | +1.42 ± 0.31 | Warmest | 1st | 2016 | +0.79 | +1.42 |
| Coolest | 137th | 1911 | -0.50 | -0.90 | |||
| Land and Ocean | +1.05 ± 0.17 | +1.89 ± 0.31 | Warmest | 1st | 2016 | +1.05 | +1.89 |
| Coolest | 137th | 1911 | -0.51 | -0.92 | |||
| Northern Hemisphere | |||||||
| Land | +1.96 ± 0.18 | +3.53 ± 0.32 | Warmest | 1st | 2016 | +1.96 | +3.53 |
| Coolest | 137th | 1893 | -0.98 | -1.76 | |||
| Ocean | +0.85 ± 0.16 | +1.53 ± 0.29 | Warmest | 1st | 2016 | +0.85 | +1.53 |
| Coolest | 137th | 1904, 1911 | -0.46 | -0.83 | |||
| Land and Ocean | +1.27 ± 0.17 | +2.29 ± 0.31 | Warmest | 1st | 2016 | +1.27 | +2.29 |
| Coolest | 137th | 1893 | -0.60 | -1.08 | |||
| Southern Hemisphere | |||||||
| Land | +1.24 ± 0.16 | +2.23 ± 0.29 | Warmest | 1st | 2016 | +1.24 | +2.23 |
| Coolest | 137th | 1917 | -0.86 | -1.55 | |||
| Ocean | +0.76 ± 0.17 | +1.37 ± 0.31 | Warmest | 1st | 2016 | +0.76 | +1.37 |
| Coolest | 137th | 1911 | -0.52 | -0.94 | |||
| Land and Ocean | +0.83 ± 0.16 | +1.49 ± 0.29 | Warmest | 1st | 2016 | +0.83 | +1.49 |
| Coolest | 137th | 1911 | -0.55 | -0.99 | |||
| Arctic | |||||||
| Land and Ocean | +2.57 ± 0.18 | +4.63 ± 0.32 | Warmest | 1st | 2016 | +2.57 | +4.63 |
| Coolest | 137th | 1966 | -1.48 | -2.66 | |||


The most current data can be accessed via the Global Surface Temperature Anomalies page.
Precipitation
June
The maps below represent precipitation percent of normal (left, using a base period of 1961–1990) and precipitation percentiles (right, using the period of record) based on the GHCN dataset of land surface stations. As is typical, precipitation anomalies during June 2016 varied significantly around the world. June precipitation was notably drier than normal across the western and central contiguous U.S., Spain, northern Colombia, northeastern Brazil, Chile, southern Argentina, and across parts of central Russia. Wetter-than-normal precipitation was observed across northern Argentina, northern and central Europe, much of Australia, and across central and southern Asia.

Select national information is highlighted below. (Please note that different countries report anomalies with respect to different base periods. The information provided here is based directly upon these data):
- For a second consecutive month, precipitation totals across Australia were above average. The national average precipitation during June 2016 was 49.9 mm (1.96 inches) or 116% above average—the second highest precipitation total since national records began in 1901, behind 1923 (57.2 mm / 2.25 inches). Regionally, Queensland, New South Wales, and Tasmania had a top eight wet June on record.
- Precipitation across the Island of Fiji was below average during June 2016. According to Fiji's Meteorological Service, 21 of the 26 stations observed below to much-below-average conditions during the month, with only one station reporting above-average conditions.
- Much of northern and central Europe had above-average conditions during June 2016. Several locations across The Netherlands received more than 200 mm (7.87 inches) of precipitation during June. Limburg Ysselsteyn received a total of 277 mm (10.91 inches) of precipitation, setting a new record for the month of June. Averaged as a whole, the nation had a total of 118 mm (4.65 inches) of precipitation during June 2016, which is twice the normal monthly total. Precipitation across the United Kingdom was 139% of average, with much of England and Wales observing more than twice their monthly normal precipitation total.
Ocean Heat Content
Ocean Heat Content (OHC) is essential for understanding and modeling global climate since > 90% of excess heat in the Earth's system is absorbed by the ocean. Further, expansion due to increased ocean heat contributes to sea level rise. Change in OHC is calculated from the difference of observed temperature profiles from the long-term mean.
| Basin | 0-700 meters | Rank (1955-2023) | |||||
|---|---|---|---|---|---|---|
| Entire Basin | Northern Hemisphere | Southern Hemisphere | ||||
| Atlantic | 5.740 | 8th | 3.201 | 14th | 2.538 | 8th |
| Indian | 3.551 | 3rd | 1.094 | 1st | 2.457 | 8th |
| Pacific | 3.767 | 14th | 2.308 | 12th | 1.459 | 15th |
| World | 13.076 | 10th | 6.623 | 8th | 6.454 | 10th |
| Source: Basin time series of heat content | ||||||

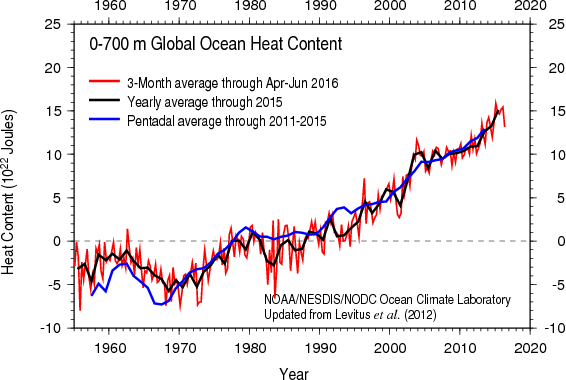
For the quarter Apr-Jun, the 2016 global OHC one was the third highest on record. The subpolar North Pacific and North Atlantic Oceans were cooler than the long-term mean. The Western Equatorial and Sub-tropical Pacific Ocean also show lower than normal OHC, a characteristic that extends across the entire basin along the Equator and southeastward across the South Pacific Ocean. Cooler than long-term mean conditions were present in the South Indian Ocean and in the Southern Ocean south of Australia and New Zealand. The Gulf Stream/North Atlantic Current region showed higher than long-term mean OHC in the western North Atlantic Ocean.
References
- Peterson, T.C. and R.S. Vose, 1997: An Overview of the Global Historical Climatology Network Database. Bull. Amer. Meteorol. Soc., 78, 2837-2849.
- Huang, B., V.F. Banzon, E. Freeman, J. Lawrimore, W. Liu, T.C. Peterson, T.M. Smith, P.W. Thorne, S.D. Woodruff, and H-M. Zhang, 2016: Extended Reconstructed Sea Surface Temperature Version 4 (ERSST.v4). Part I: Upgrades and Intercomparisons. J. Climate, 28, 911-930.